Getting comfortable with Coinbase is one thing, but trading on Coinbase is a completely different level, and the reason is simple: trading requires patience, experience, and understanding of the market in general.
But before you can do any of that, you must first understand the fundamentals of trading charts because you need them to know where the market is moving or how it behaves.
Still don’t have an account on Coinbase? Open in by the link & grab your first crypto worth up to $200.
For US residents only.
What is Crypto Trading?
Trading can be defined as an economic concept of buying and selling assets. These assets can be either goods or services that can be exchanged between two parties. In the case of crypto trading, these assets are cryptocurrencies like Bitcoin, Ethereum, and Solana among many others.
Therefore, a crypto trader trades cryptocurrencies as their goal is to achieve profitable outcomes over a certain time as they believe the price of cryptocurrencies will rise. It is worth noting that trading entirely differs from investing because in investing; an investor is looking for a long-term gain, whereas in trading, traders make money from daily price movement.
There are many platforms where crypto traders trade cryptocurrencies and Coinbase is among the most popular ones as it is renowned for being user-friendly and secure.
Understanding Candlestick Charts
Candlestick charts have a rich history that dates back to 18th century Japan. Due to their practicality in giving an instant snapshot of the market to traders, they have been used ever since. They are considered to be extremely effective as they offer comprehensive information about the market.
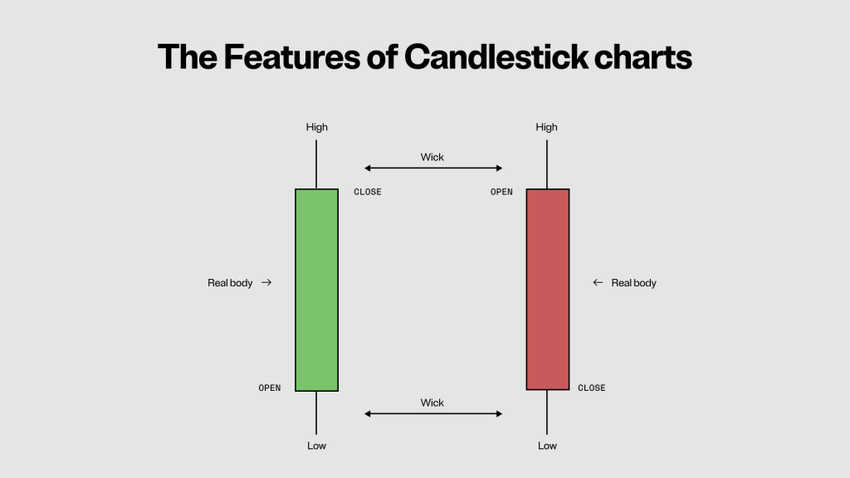
Each vertical bar is known as a “Candle” and comprises a body and a wick.
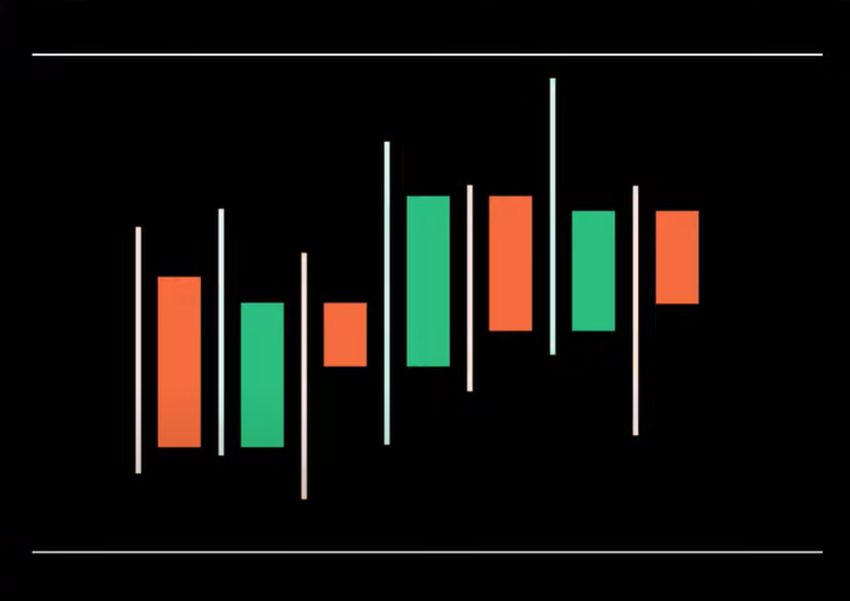
The body includes the red and green bars whereas the wick is the thin line that is placed above and below the candlestick.
Both body and wick show us the relationship between open and closed, as well as low and high prices. For traditional stocks, each candle represents one trading day, but in the world of crypto, they represent one trading hour or even shorter.
Green or bullish candlesticks mean that the price went up. When a trader reads green candles, the opening price is always at the bottom of the candle’s body, whereas the closing price is at the top.
On the other hand, red or bearish candlesticks work opposite and represent the price going downwards. Upon reading red candles, the opening price is at the top of the candle’s body, and the closing price is at the bottom.
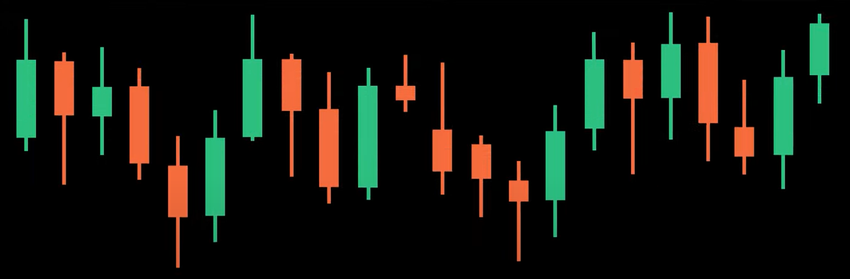
Each candlestick has a different shape and size because they are showing different price movements over time. Furthermore, they can also be used to gauge price movement thus giving traders the ability to make informed predictions regarding what direction the market is headed.
It is important to remember that candlesticks do not give the entire picture of the market, and relying solely on them to execute successful trades can be risky.
Identifying Patterns
Individual candlesticks form patterns that traders use to recognize major support and resistance levels. Multiple candlestick patterns indicate an opportunity in the market. This is because some provide insight regarding selling or buying pressure, whereas others identify market indecision.
Getting yourself familiarized with the basics of candlestick patterns is important as it will help you make informed decisions. Some of the common candlestick patterns include:
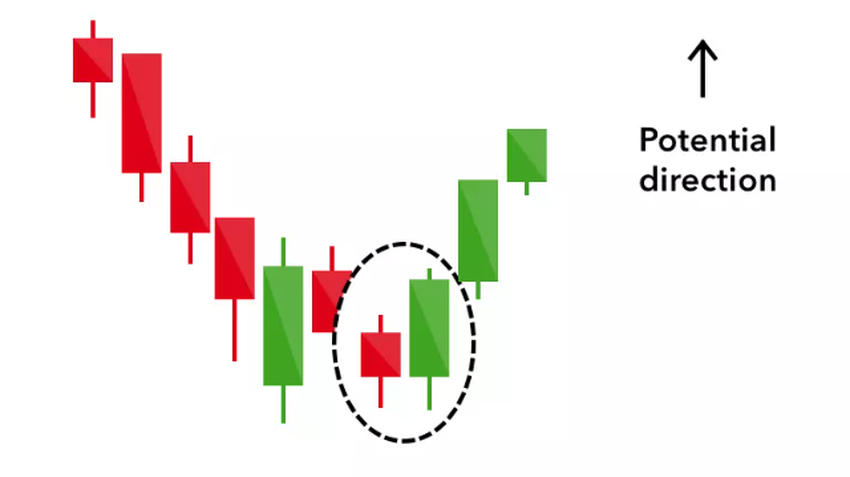
1. Bullish Engulfing
This pattern is formed of two candlesticks; one is a short red body, and the next one is a larger green candle. This pattern shows an upcoming upward direction.
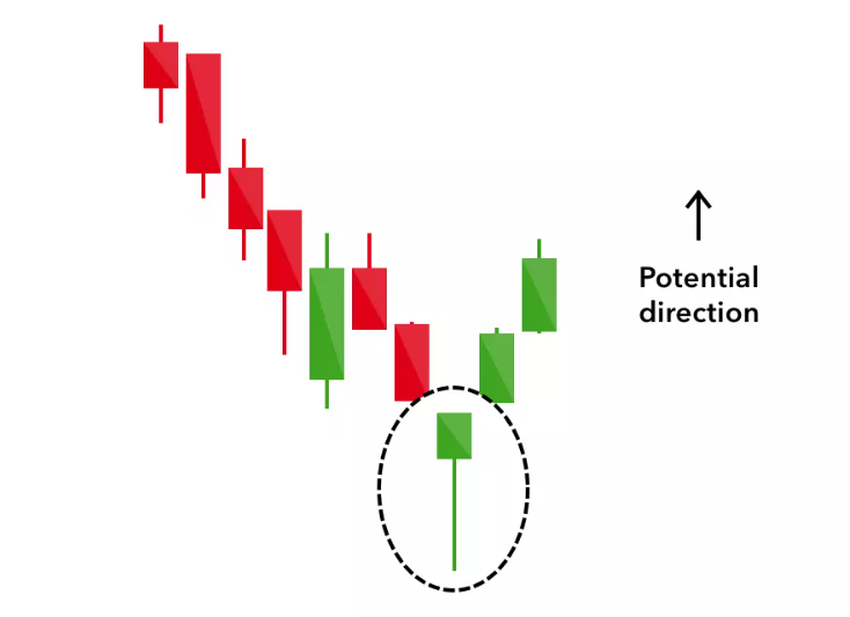
2. Hammer
Hammer candlestick is formed of a short body with a long lower wick and is found at the bottom of a downward trend.
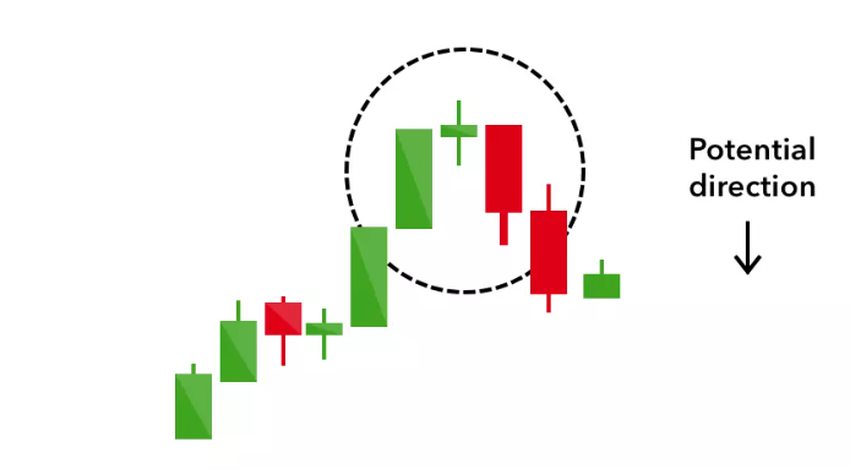
3. Evening Star
The evening star candlestick is a three-candlestick pattern and represents a potential downward direction. It comprises a short candle that is sandwiched between a long green candle and a long red candlestick.
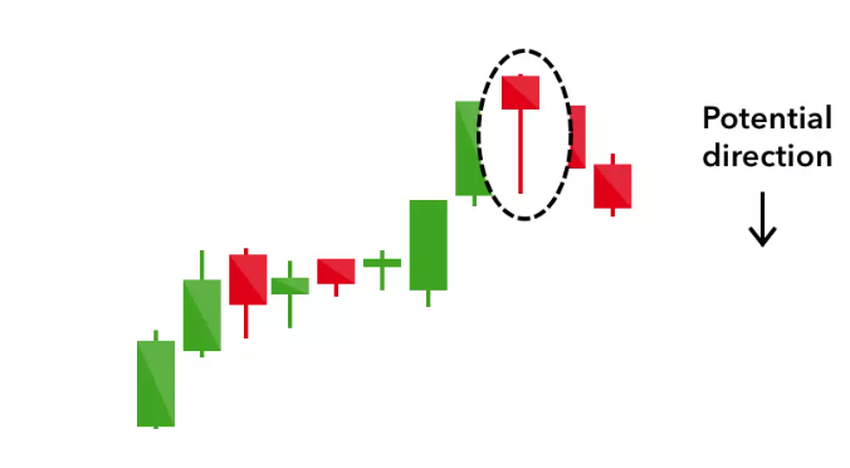
4. Hanging Man
A hanging man is a bearish or a downward equivalent of a hammer. It has the same shape but is formed at the end of the upward trend. This pattern shows an upcoming downward direction.
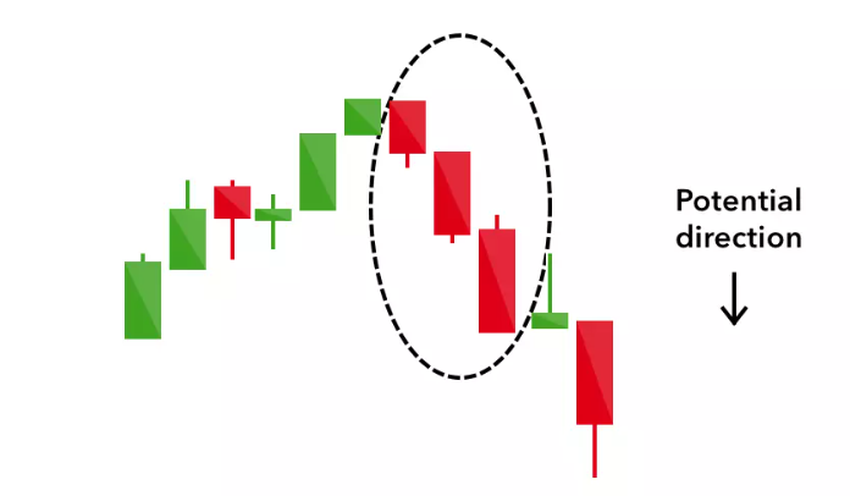
5. Three Black Crows
This pattern comprises three consecutive long red candles. Each candle opens at a similar price to the previous one, however, due to selling pressure, their price moves lower and lower with each close. This pattern represents the start of a bearish downtrend.
🎁 Bonus time: Test Your Trading Knowledge and Join Free Trading Community
Having learned about the basic concepts about crypto trading, it is time to put your knowledge to the test. To make sure you understand everything we have covered in this lesson, take a quiz below.
Basics of trading
Test you trading knowledge and join BeInCrypto trading community on Telegram🚀
Join our Crypto Trading Community! Dive deeper into the world of cryptocurrency trading by connecting with experts and enthusiasts alike. Get your questions answered by our experienced BeInCrypto traders and learn from real-time discussions and shared experiences.