


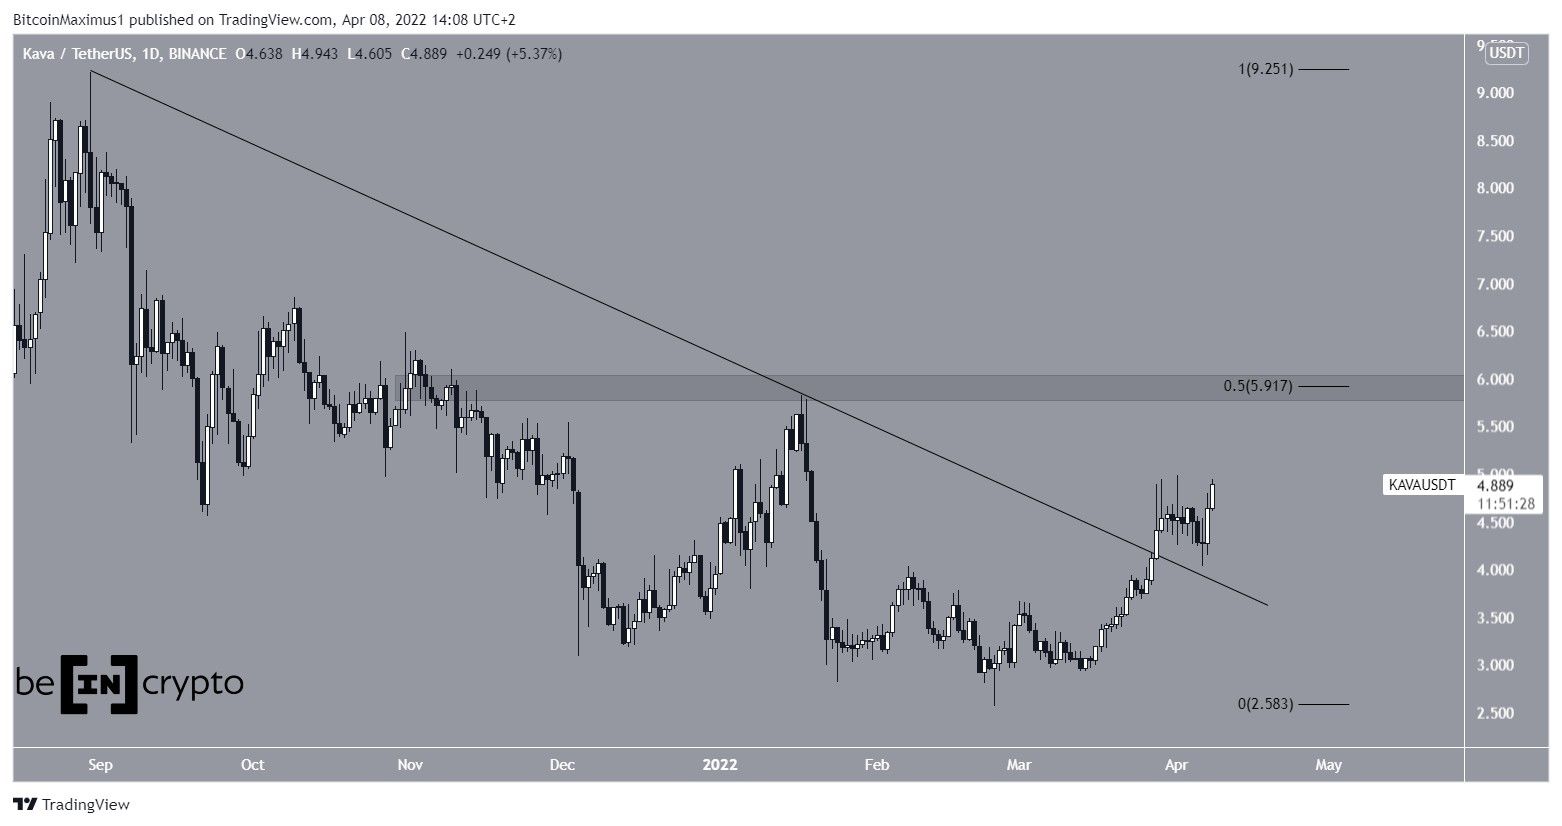
Kava.io (KAVA) has broken out from a long-term descending resistance line. It accelerated its rate of increase after bullish readings from technical indicators.
KAVA had been decreasing alongside a descending resistance line since reaching an all-time high price of $9.21 on Aug 30. The downward movement led to a low of $2.55 on Feb 24.
The price has been moving upwards since and broke out from the resistance line on March 28. This is a sign that the correction could be complete.
So far, KAVA has reached a high of $4.98, doing so on April 1.
If the upward movement continues, the next closest resistance would be at $5.92. This is the 0.5 Fib retracement resistance level when measuring the entire downward movement.
Ongoing increase
Cryptocurrency trader @CryptoNTez tweeted a chart of KAVA, stating that the price could break out from its long-term descending resistance line.
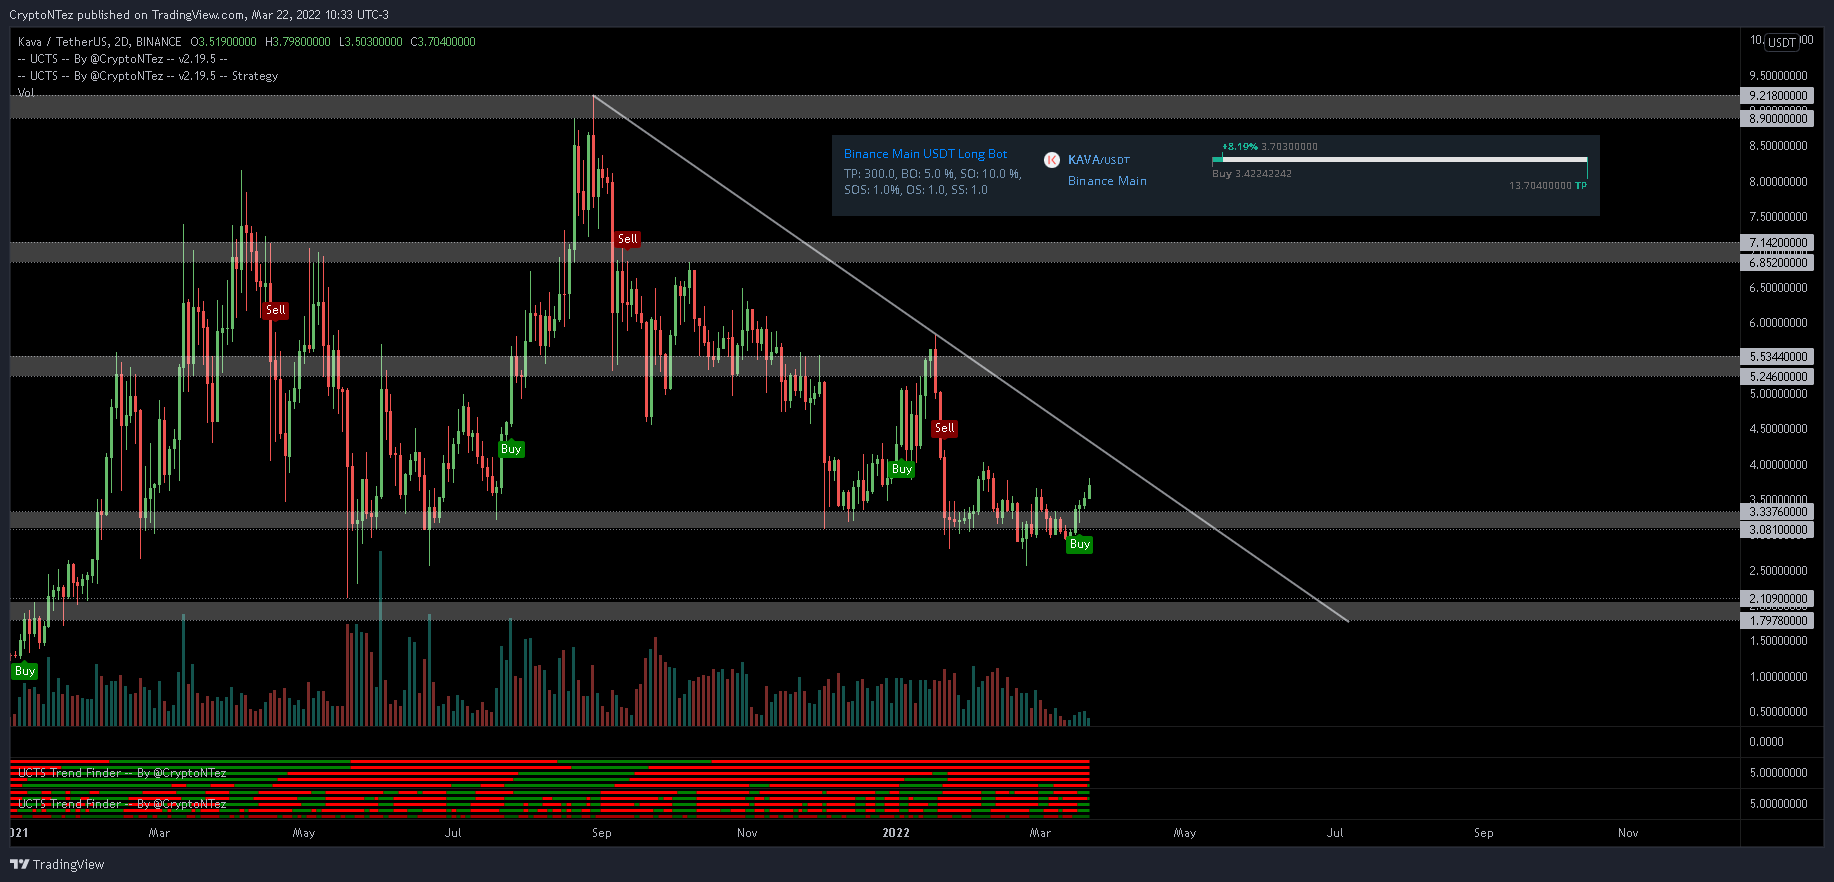
Since the tweet, KAVA has already broken out from the line.
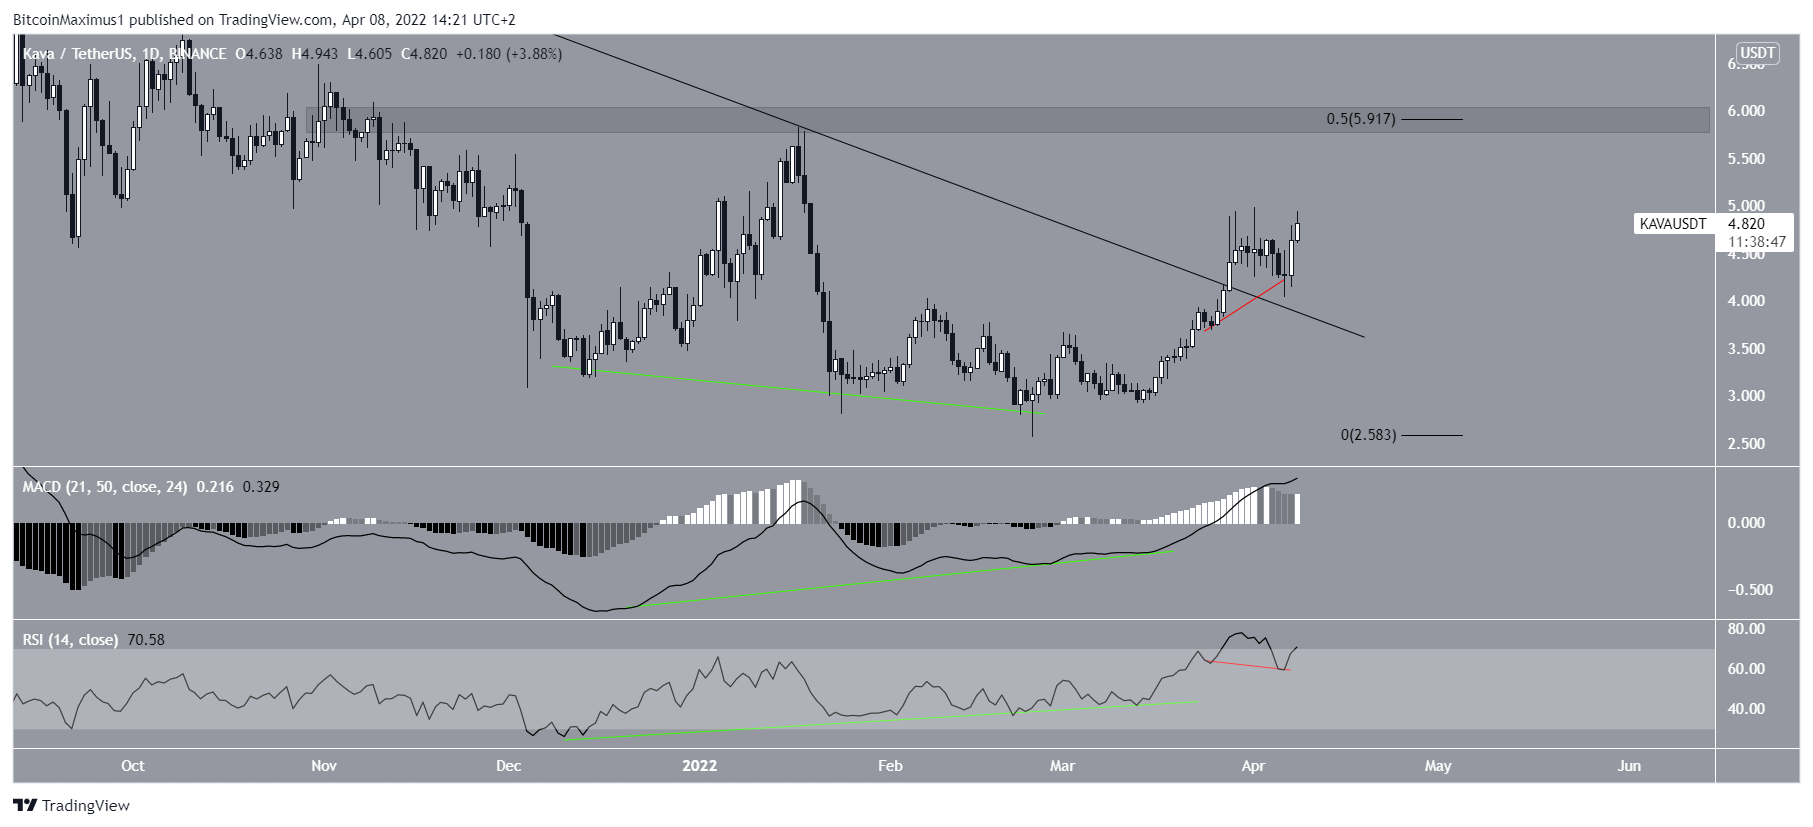
A closer look at the daily movement shows that the breakout was preceded by significant bullish divergences in both the MACD and RSI (green lines). Since then, the MACD has crossed into positive territory and the RSI has moved above 50. Both of these are considered signs of bullish trends.
In addition to this, the RSI has now generated a hidden bullish divergence (red line). This is a sign of trend continuation, which suggests KAVA will continue to move upwards.
Therefore, the daily time frame indicates that the continuation of the upward movement towards $5.90 is expected.
KAVA wave count analysis
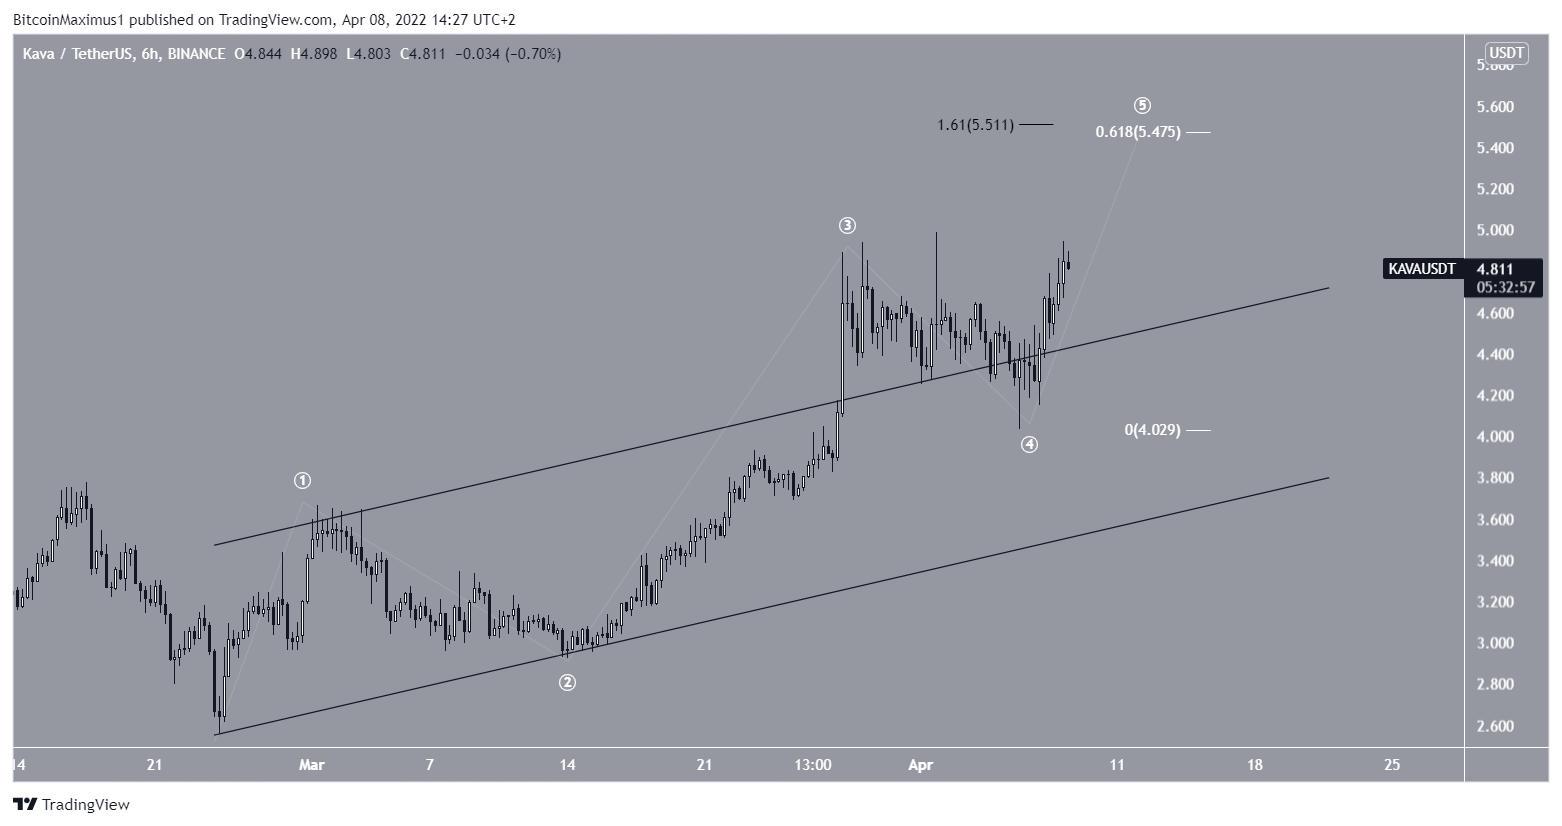
The wave count suggests that KAVA began a five-wave upward movement (white) on Feb 23. If correct, it is currently in the fifth and final wave of this upward movement.
The decrease between March 28 and April 6 constituted a fourth wave pullback, as evidenced by the brief decrease and bounce inside the previous ascending parallel channel.
The most likely target for the top of the fifth wave is $5.50. The target is found by the 1.61 external Fib retracement of wave four (black) and the 0.618 length of waves 1-3 (white).
For Be[in]Crypto’s latest Bitcoin (BTC) analysis, click here


