


Bitcoin (BTC) has bounced at a confluence of short-term support levels, which are expected to initiate a relief rally.
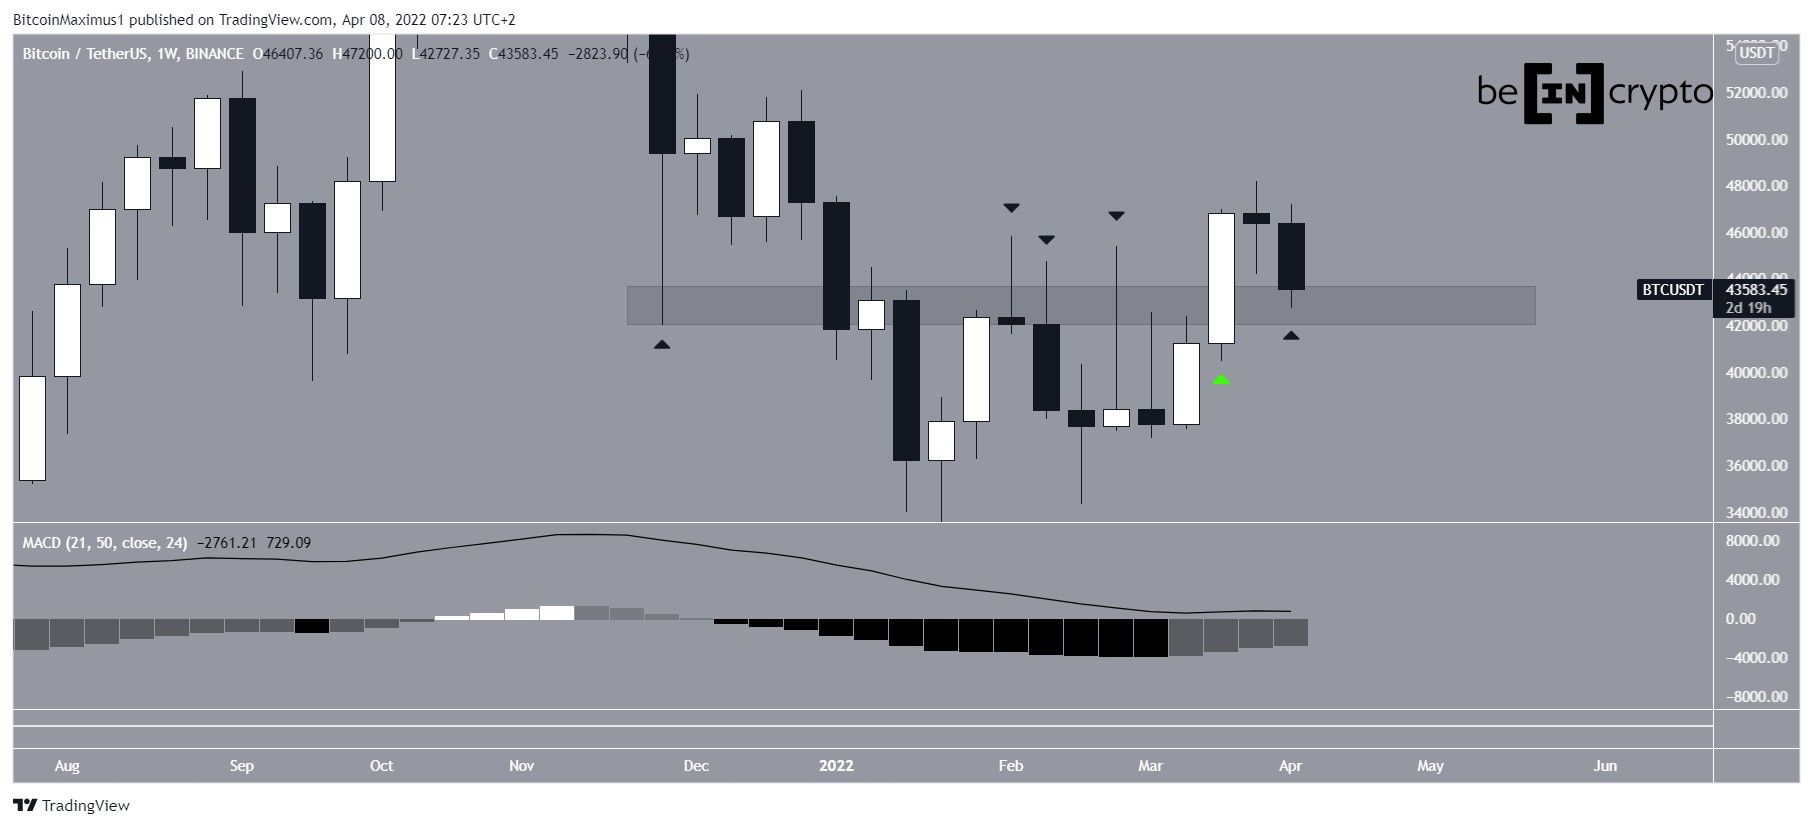
The weekly chart shows that Bitcoin is still trading above the $43,000 area, which had acted as support in November 2021 before turning to resistance in February 2022. It’s possible that the area will act as support once again.
BTC broke out during the week of March 21-28, amid a bullish engulfing candlestick (green icon). The current decrease is still contained inside the body of that candlestick, currently near its midline.
The MACD is still bullish as it’s generated three successive higher momentum bars and is still in positive territory.
Therefore, the weekly time frame still provides a bullish outlook.
BTC breaks down
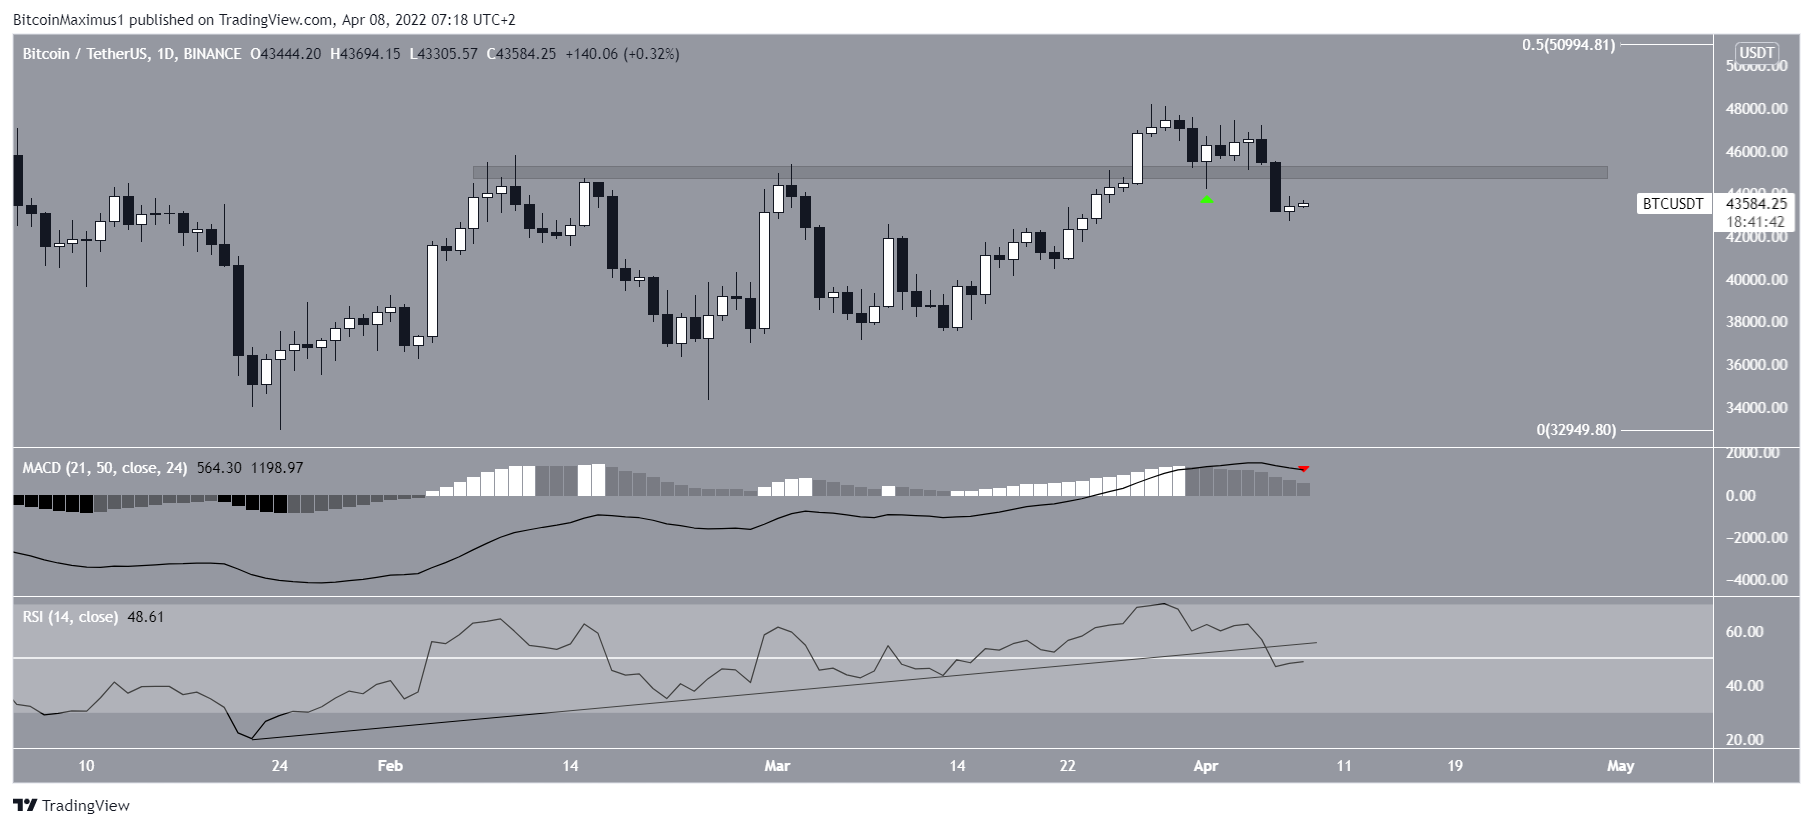
The daily chart provides a more bearish picture. BTC has been falling since reaching a local high of $48,189 on March 28. Initially, it bounced at the $44,800 horizontal area on April 1 (green icon). This seemingly validated the area as support.
However, BTC failed to initiate an upward move and broke down from the area on April 6.
Unlike the weekly time frame, technical indicators on the daily chart are more bearish. This is especially visible in the RSI, which has broken down from an ascending support line that had been in place since Jan. 24. The MACD has also generated eight successive lower momentum bars (red icon).
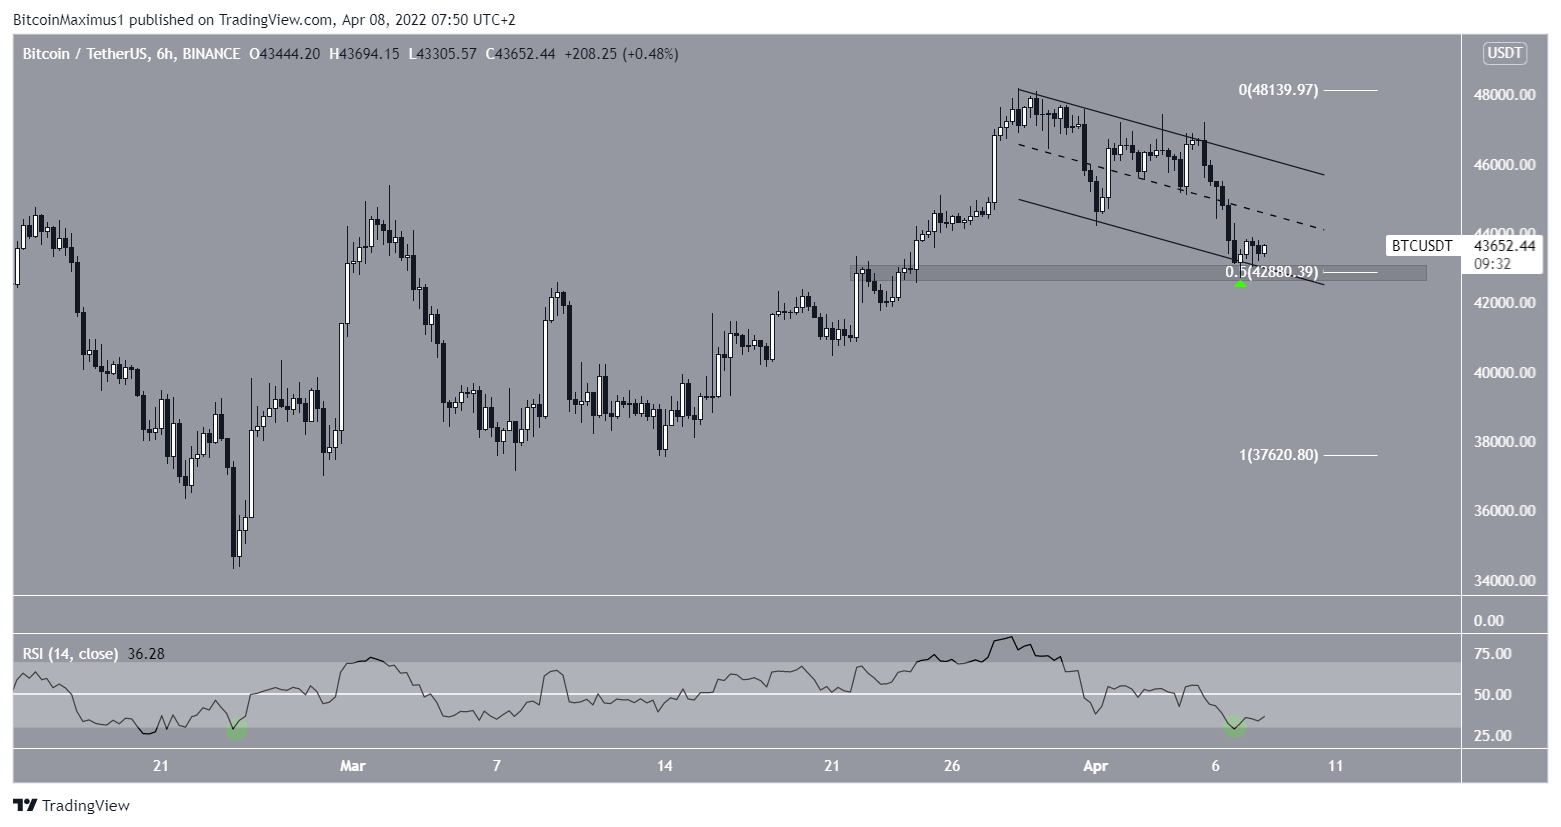
The six-hour chart shows that BTC has been trading inside a descending parallel channel since the aforementioned March 28 high.
On April 7, it bounced at a confluence of support levels, created by the:
- Support line of the channel
- 0.5 Fib retracement support level
- $42,900 horizontal support area
If the rebound continues, the midline of the channel near $44,300 would be expected to provide resistance. However, apart from the oversold RSI, there are no signs of a potential bullish reversal.
Future movement
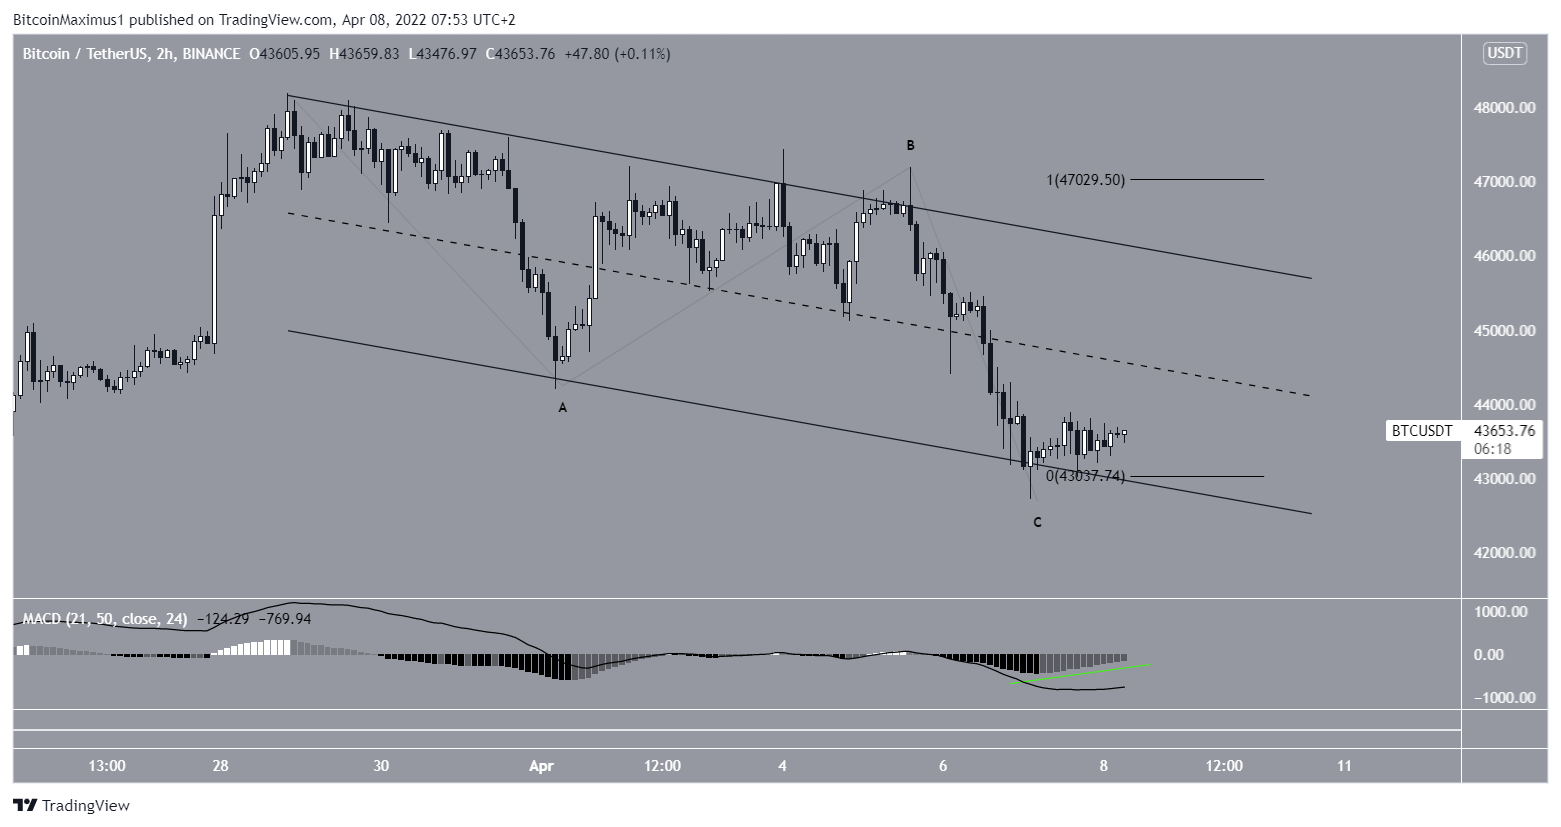
The two-hour chart supports the possibility of a relief rally.
Firstly, the MACD has given a bullish reversal signal by generating numerous higher successive momentum bars (green line).
Secondly, the entire decrease since March 28 could be an A-B-C corrective structure, in which waves A and C had an exact 1:1 ratio. This supports the possibility for a bounce at least to the middle of the channel and likely higher.
However, a breakdown from the channel would put the entire bullish wave count at risk.
For BeInCrypto’s previous Bitcoin (BTC) analysis, click here


