


The price of Bitcoin (BTC) experienced a flash crash to $42,000 over the weekend, followed by a strong bounce and stabilization around $49,000. The decline was caused by a cascading liquidation of futures contracts. Traders lost 58,202 BTC and this was the second-largest liquidation event in 2021.
At the same time, the structure of the BTC price action since Q2 2021 indicates a long period of consolidation below the important 1.618 Fib macro resistance level. There are arguments that the last Bitcoin shakeout before the next impulsive wave of upside has just occurred. However, when comparing the current fractal with previous BTC cycles, there are both some similarities and structural deviations.
Record liquidations in 2021
Bitcoin’s fall to a low of $42,000 was driven by a cascade of liquidations of long futures positions. On-chain analyst @TXMCtrades tweeted a chart of the 1-day change in open interest for all of 2021.
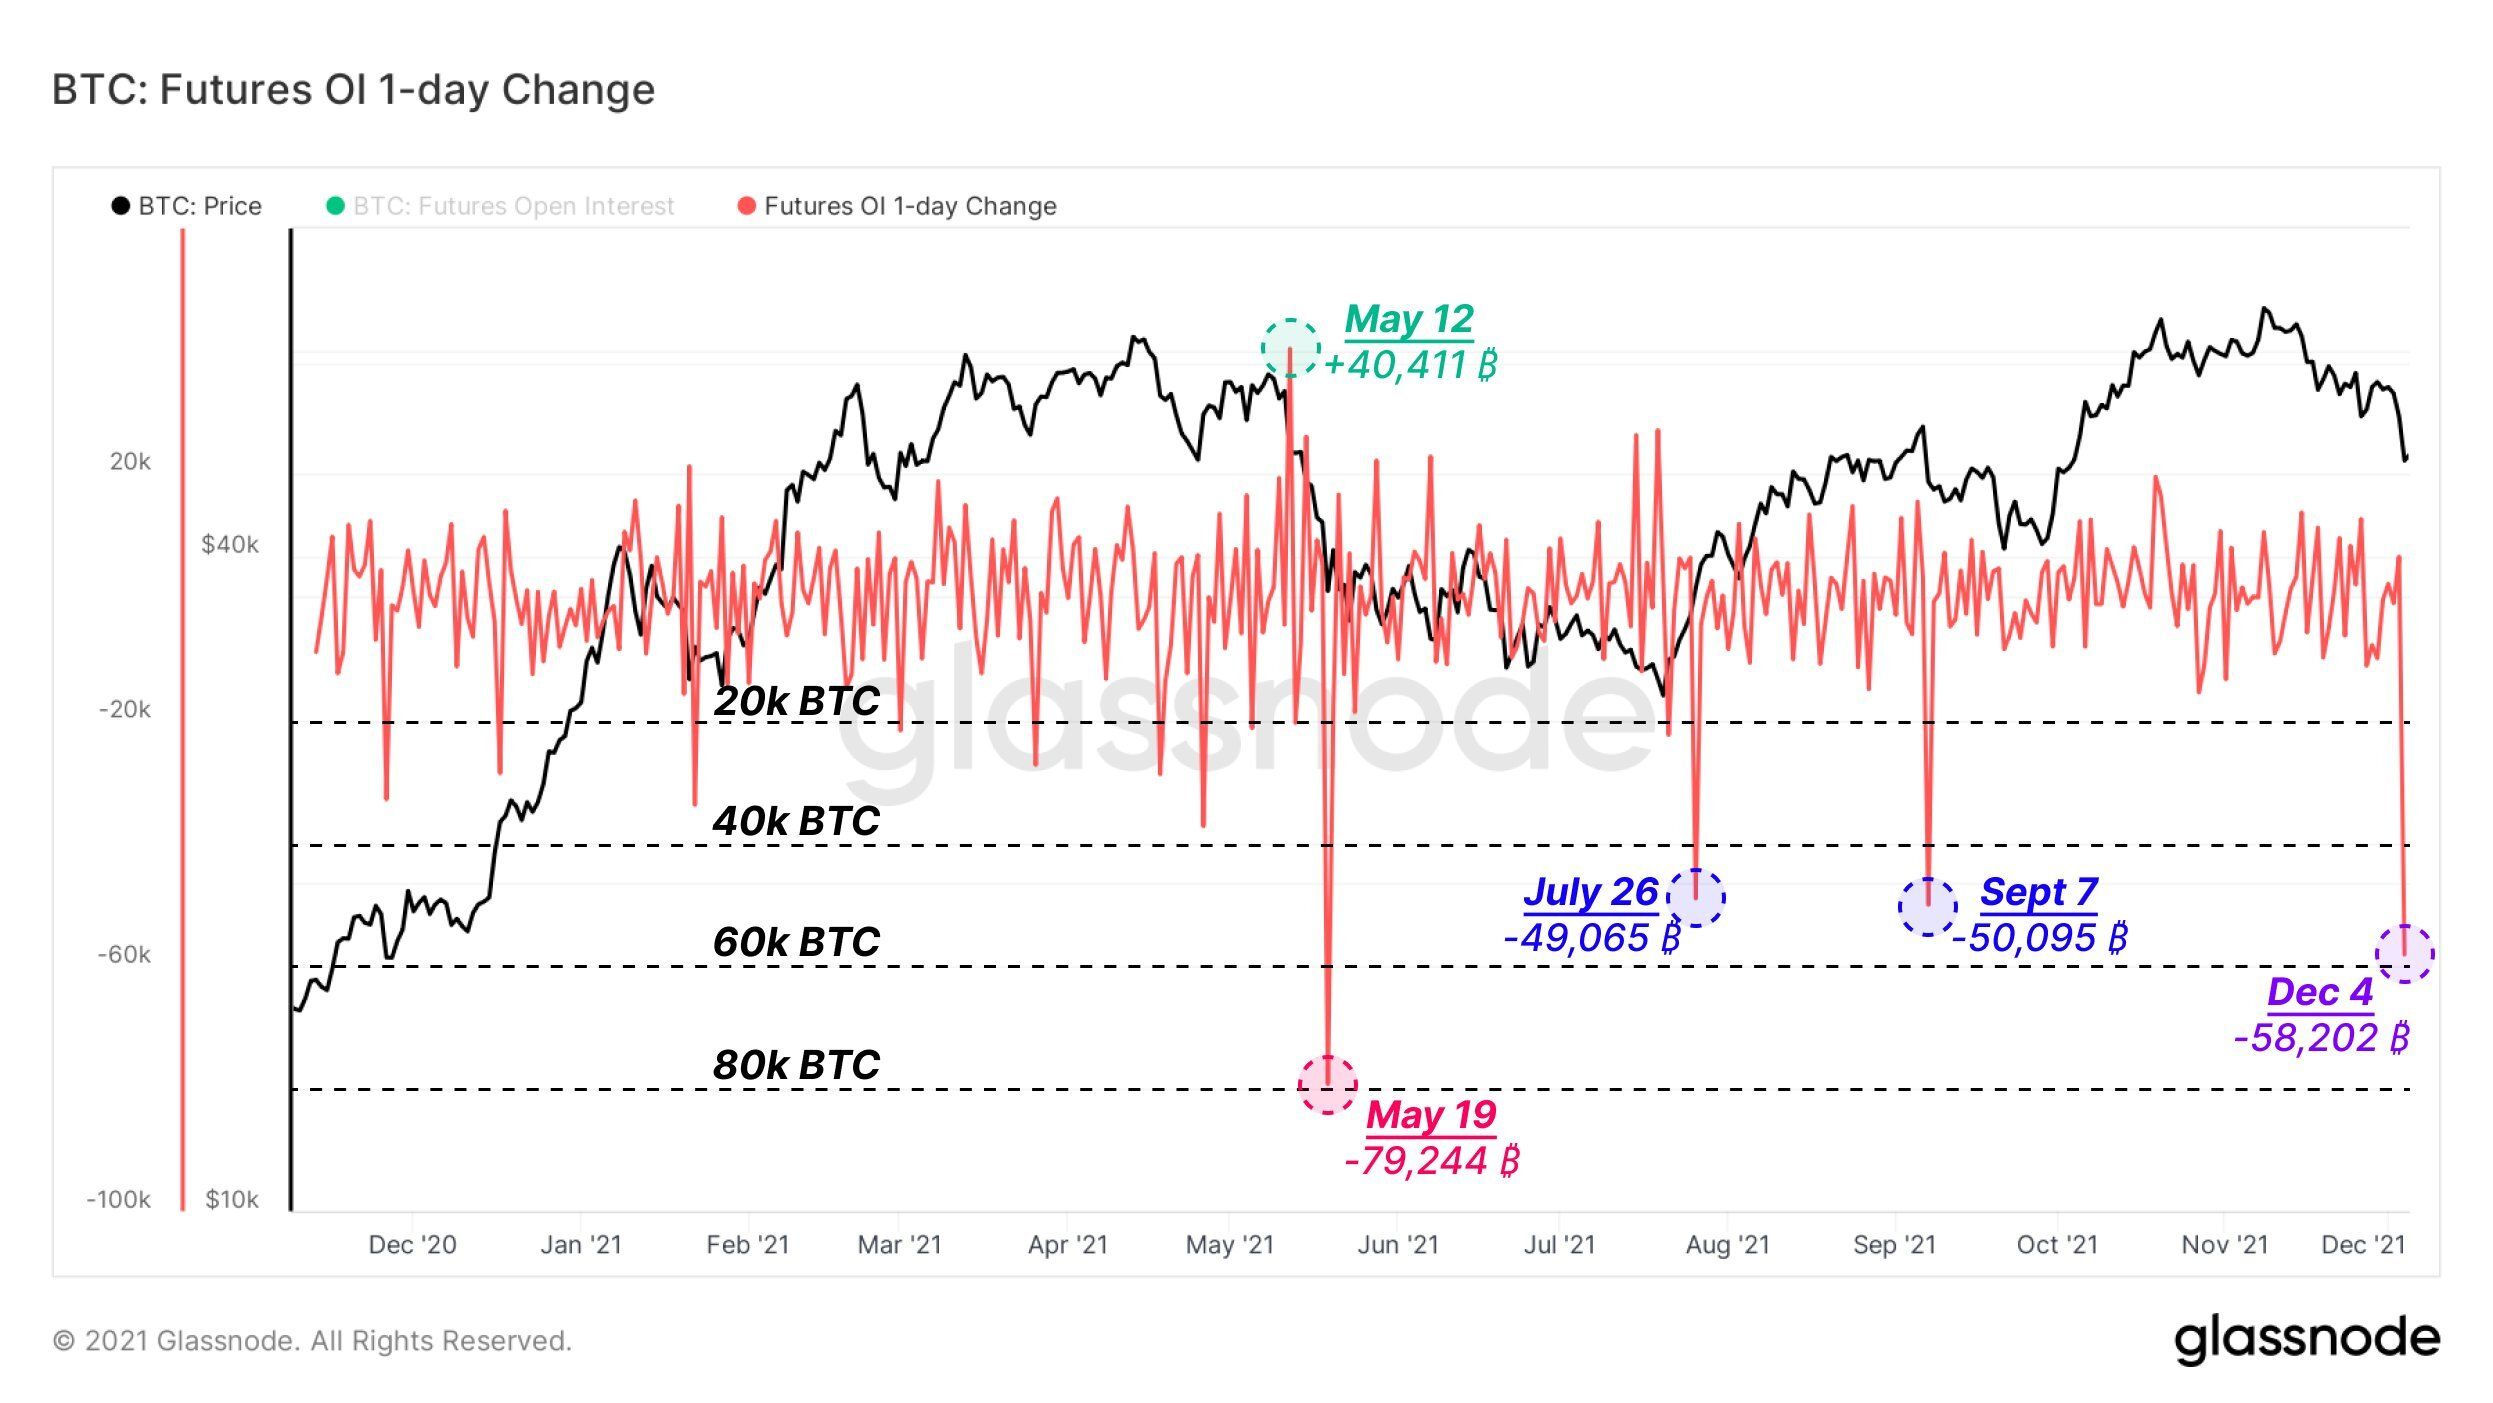
It turns out that on December 4, traders lost a total of 58,202 BTC as a result of liquidating their positions. This was the second-largest event of its kind, behind only the crash of May 19, 2021, when as much as 79 244 BTC was lost on a single day.
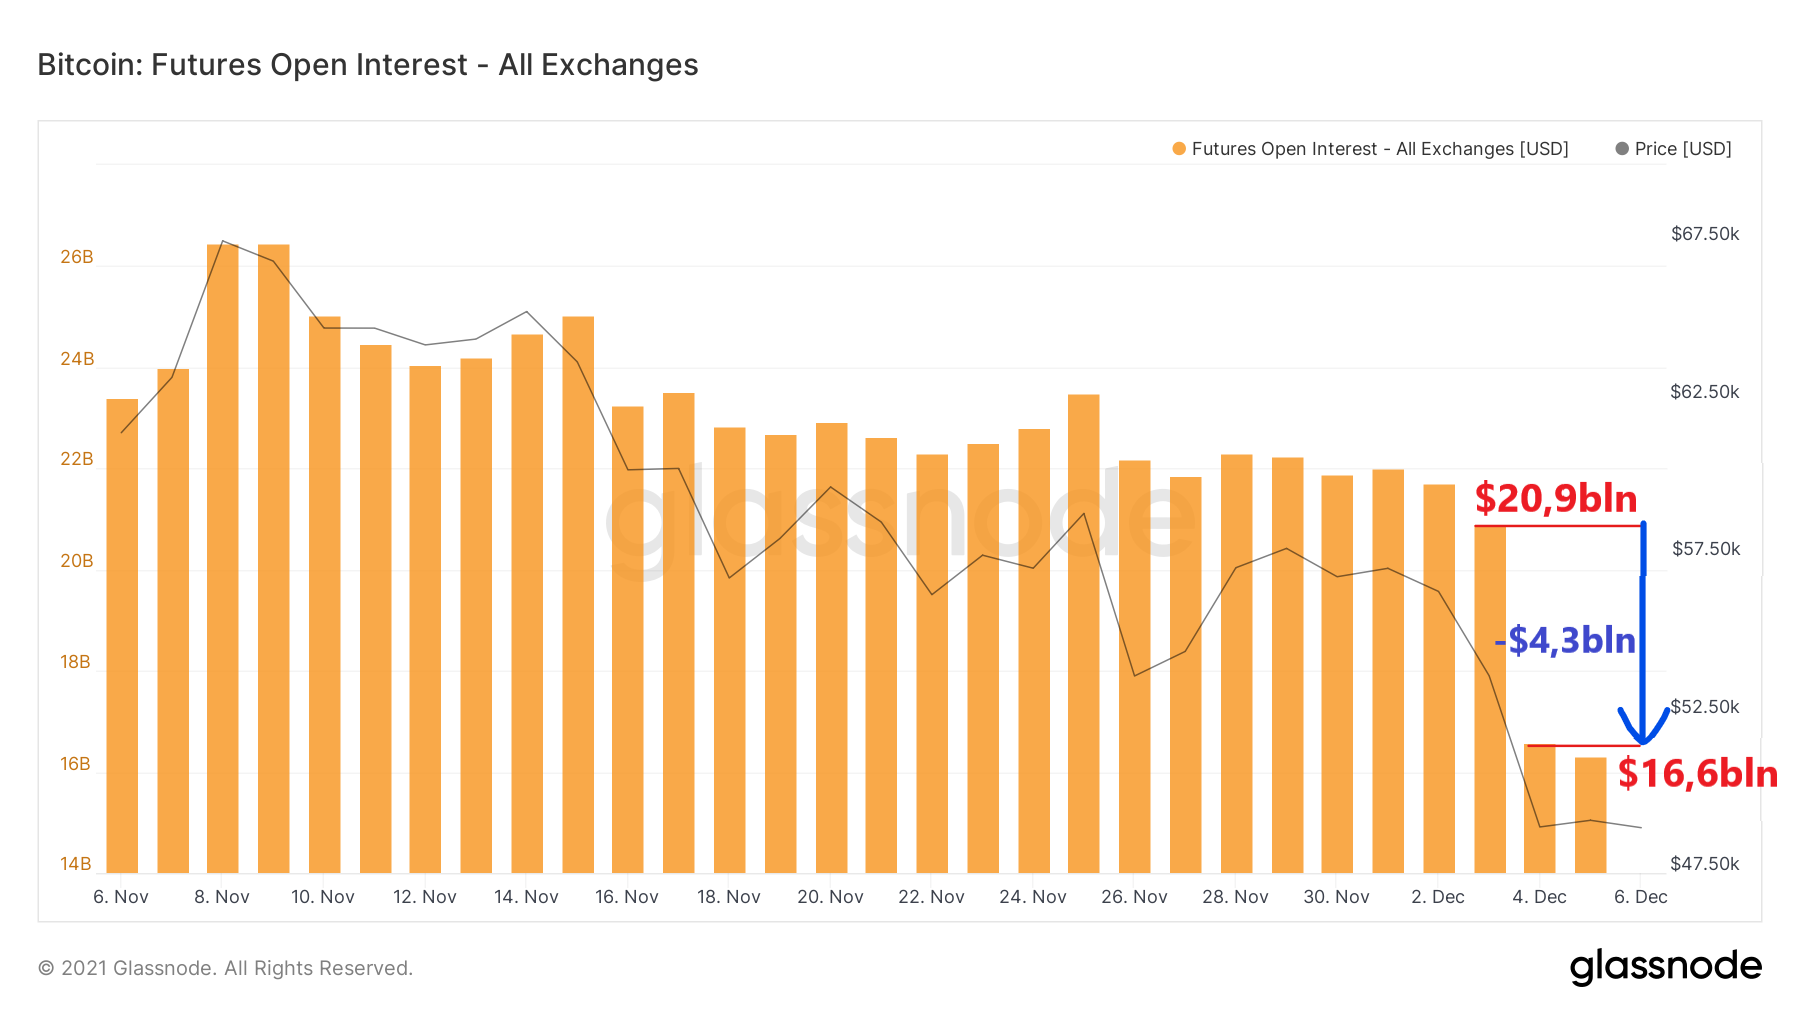
Looking at the change in the chart of futures open interest between 3 and 4 December, we see the scale of these liquidations. It turns out that traders’ total positions were reduced by a staggering $4.3 billion in one day! This is a drop of as much as 20.5% – from $20.9 billion to $16.6 billion.
One consequence of such a dramatic event is an instant change in perpetual futures funding rate. On-chain analyst @DylanLeClair tweeted a chart that illustrates this change. Through the increases in the last 4 months, counting from August 2021, traders with long positions usually had to pay to hold their positions (green bars).
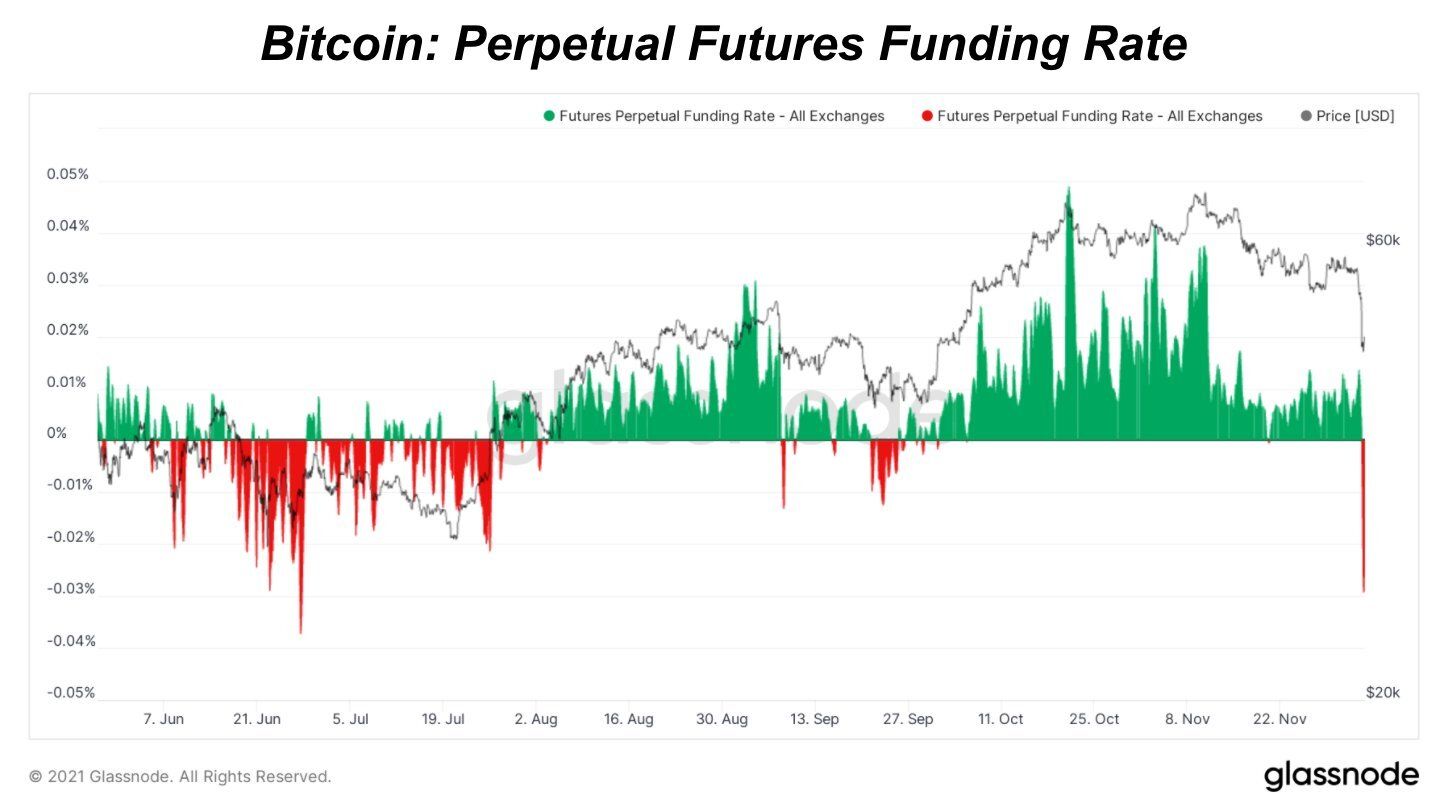
On 4 December, there was a sharp change and the funding rate fell to around -0.03%. This commission must now be paid by holders of short positions. This is the lowest value since July 2021.
Bitcoin’s last shakeout?
The above data indicates that many cryptocurrency market participants did not expect such a drastic decline. Back in November 2021, leading analysts were predicting a BTC valuation of around $98,000, so market sentiment was clearly bullish. This sentiment was reinforced by historical data, which indicated that November and December were typically up months in the market.
Despite the apparent lack of parabolic rises, there are still many arguments for a continuation of the bull market. These are consistent with the hypothesis of Bitcoin’s lengthening cycles and the possibility of a peak in 2022.
One of them was published yesterday on Twitter by crypto market analyst @TechDev_52. He compares technical aspects of the fractal structure of the current cycle and the two previous ones. In all cases, the interesting period is when the macro resistance of the external 1.618 Fib retracement is reached, measuring from the peak of the previous bull market to the bottom of the next cycle.
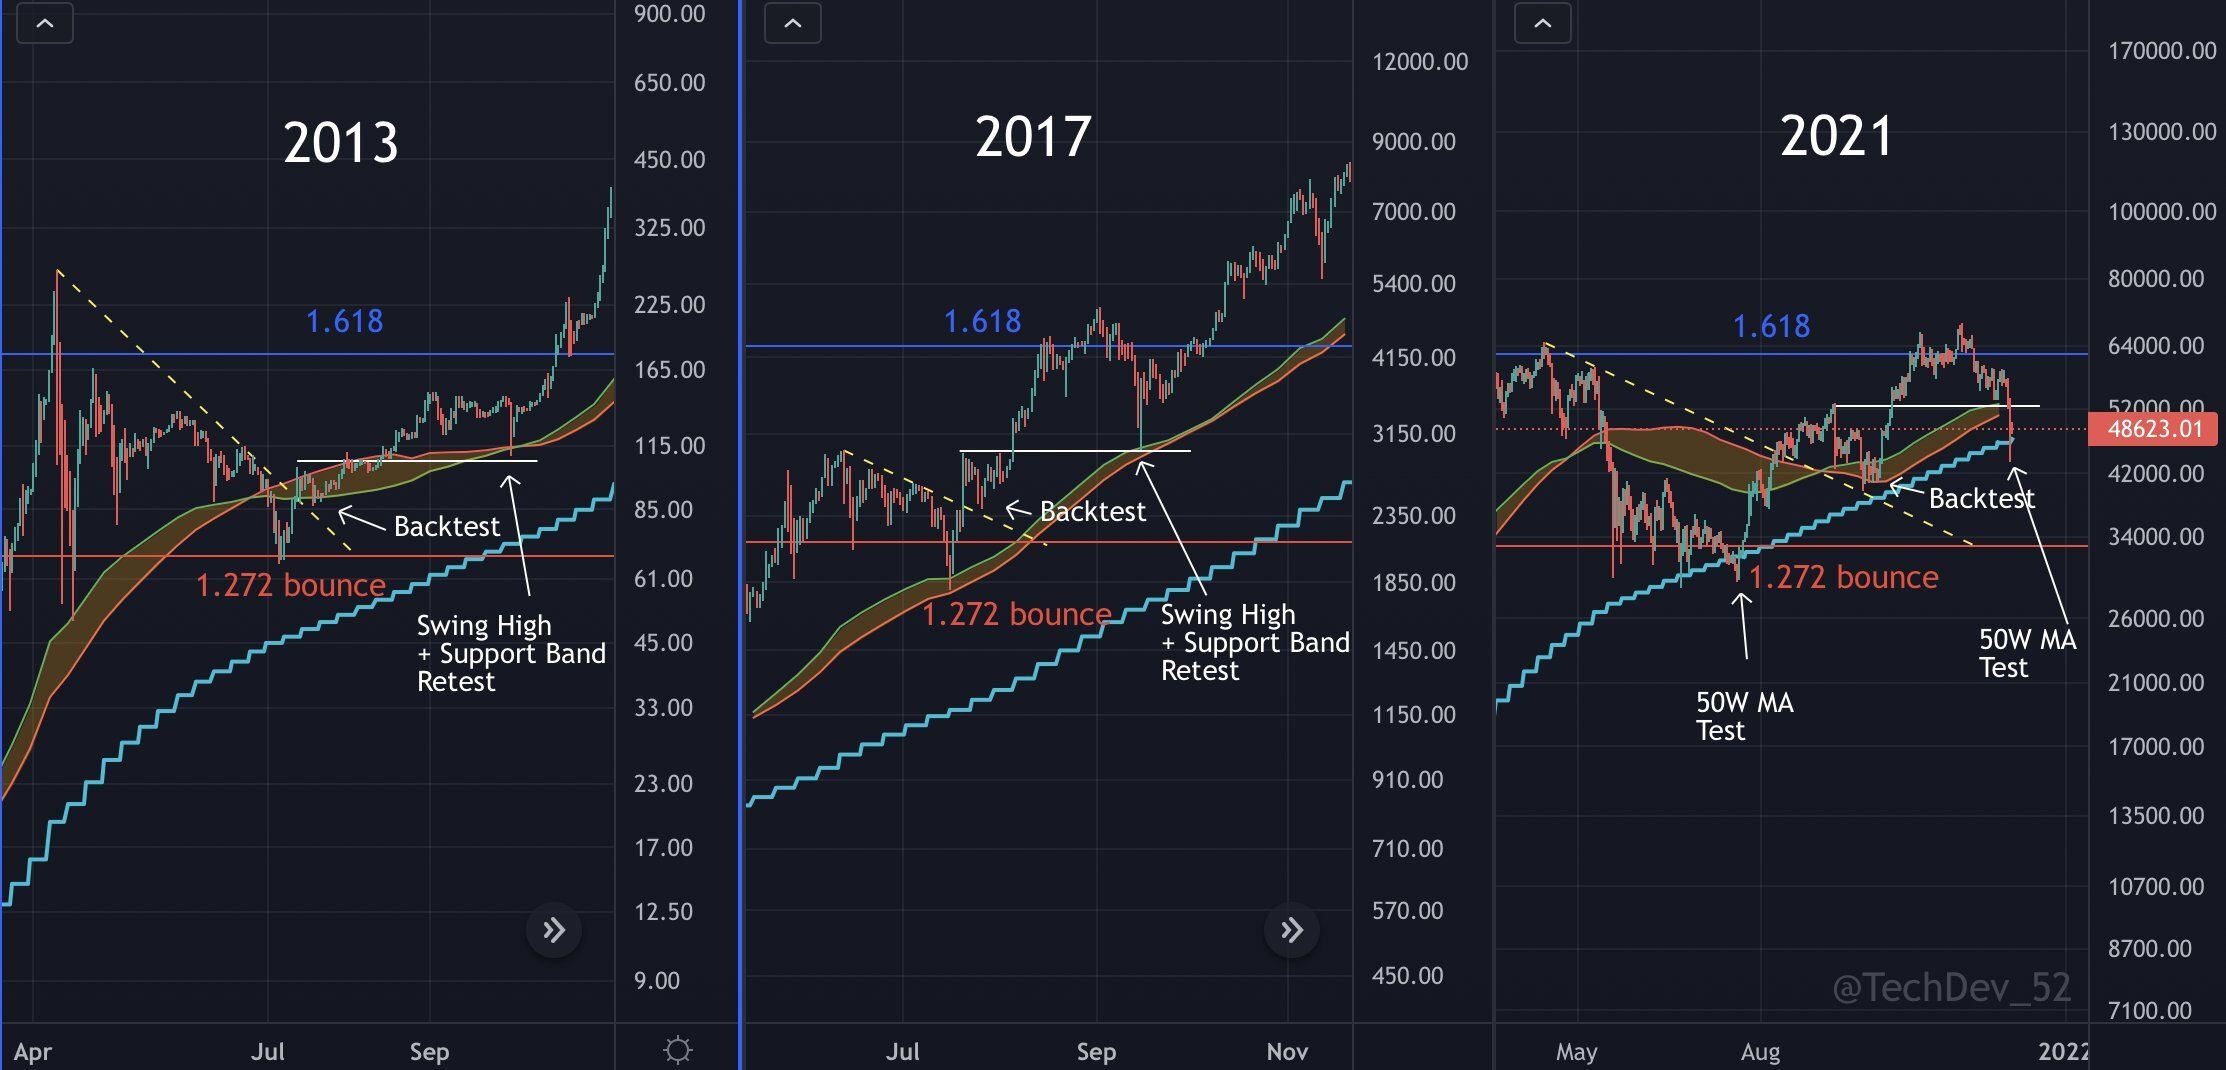
In all cases, we see a multi-month consolidation below the 1.618 Fib level. In the two previous cycles, it ended with a breakout above this resistance and a parabolic continuation of the upside to the new ATH. Interestingly, the correction always reached the vicinity of the external 1.272 Fib retracement. It was followed by an impulsive breakout of the falling resistance line (yellow dashed) and its confirmation (backtest).
However, the most important from the perspective of the weekend crash is the white horizontal line visible on all charts. It marks the level of the swing high after the breakout, which in previous fractals was later bullishly re-tested. This happened just before the definitive breakout above the key macro resistance 1.618 Fib level.
Structural deviations
However, here @TechDev_52 points out “structural deviations”. The white line of the previous peak was broken. In addition, the price failed to hold the so-called bull market support band formed by the weekly 20 MA and 21 EMA. Historically, this has often been a sign of a trend reversal. Despite these bearish signals, the analyst points out that the price has bounced off the weekly 50 MA, which also served as support during the July lows.
“This cycle has respected the 50W SMA like the last respected the 20W.”
If, despite some deviations, the fractal structure is preserved, there is a chance that this is Bitcoin’s last shakeout before the uptrend continues. However, for this to happen, the 1.618 Fib level near $61,500 must be regained and validated as support.
For BeInCrypto’s latest Bitcoin (BTC) analysis, click here.


