


The Bitcoin (BTC) price decreased considerably last week, reaching its lowest levels since Jan. 2021.
However, it has managed to create a higher low above the $30,000 support area.
Weekly BTC Levels
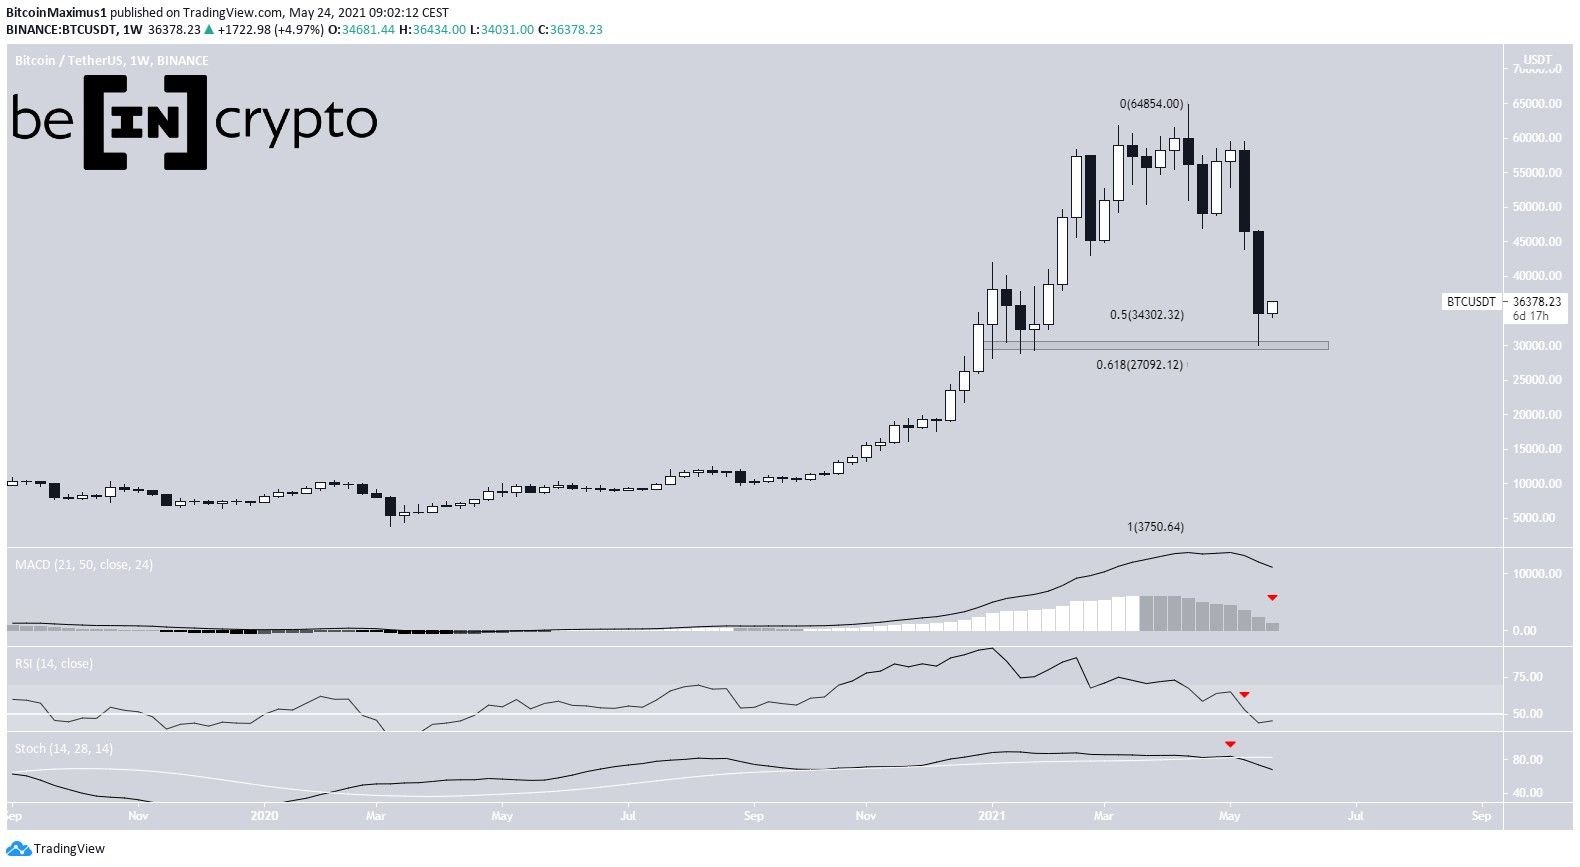
Last week, BTC created another bearish candlestick. The decrease took it to the $30,000 support area that was created in January 2021.
The price has recovered slightly since and is attempting to reclaim the $34,300 area. This is the 0.5 Fib retracement level of the entire previous upward movement. It has yet to reach a close below this level amid the current correction.
However, technical indicators are decisively bearish. The RSI has crossed below 50 while the Stochastic oscillator has made a bearish cross. Furthermore, the MACD is close to turning negative.
Ongoing BTC bounce
The daily chart is similarly bearish.
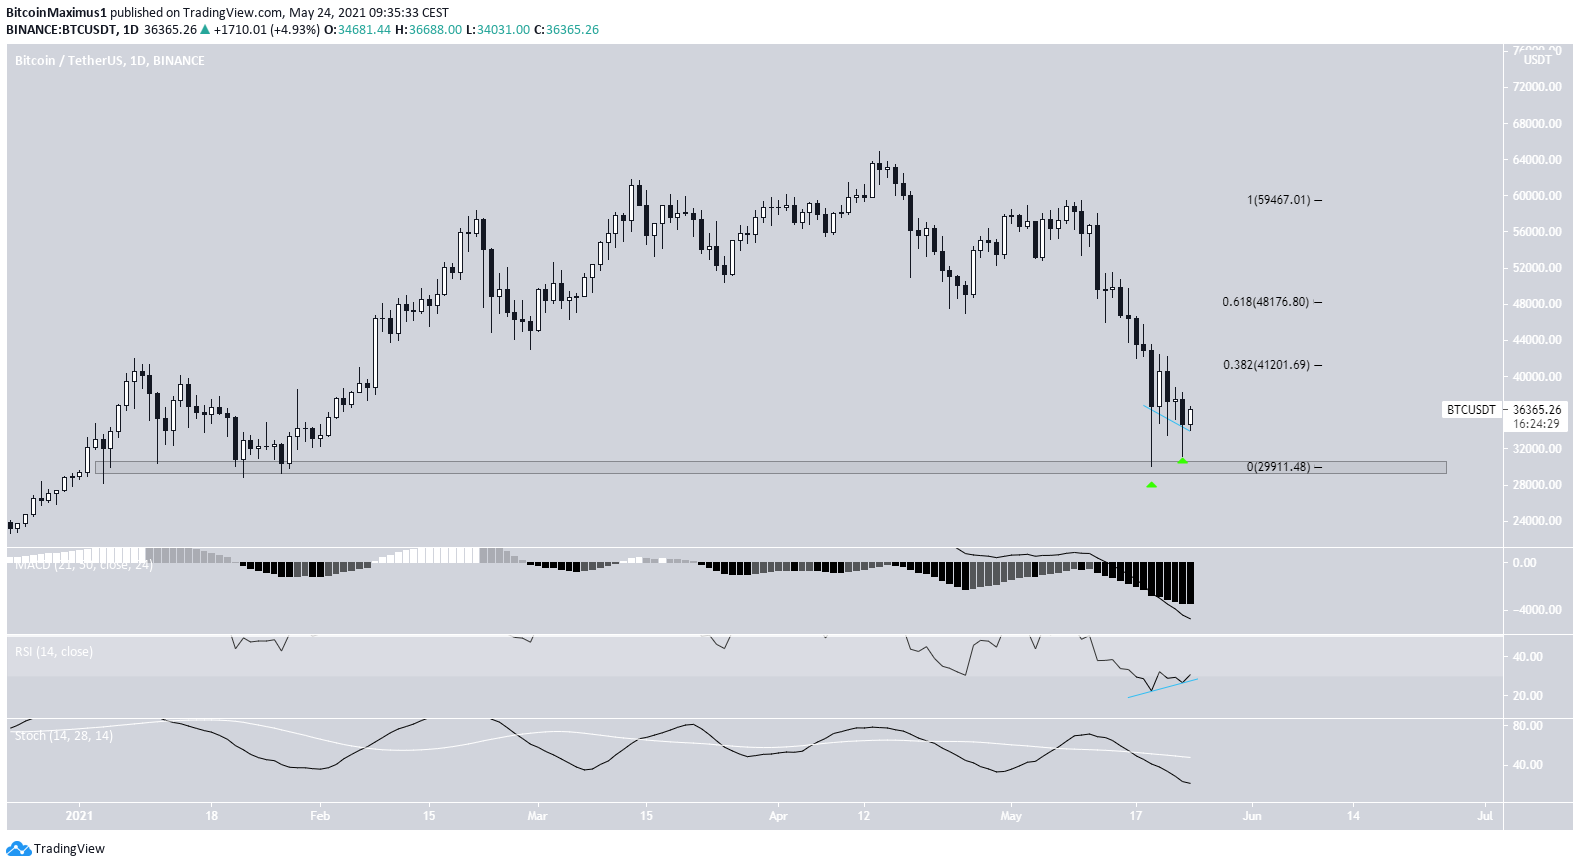
The MACD is negative, the Stochastic oscillator is decreasing, and the RSI is in oversold territory.
However, there is a bullish divergence developing in the RSI, which is in the process of crossing above 30. In addition, this has been combined with two long lower wicks, both signs of buying pressure.
The closest resistance levels are found at $41,200 and $48,200. These are the 0.382 and 0.618 Fib retracement resistance levels, respectively.
Short-term movement
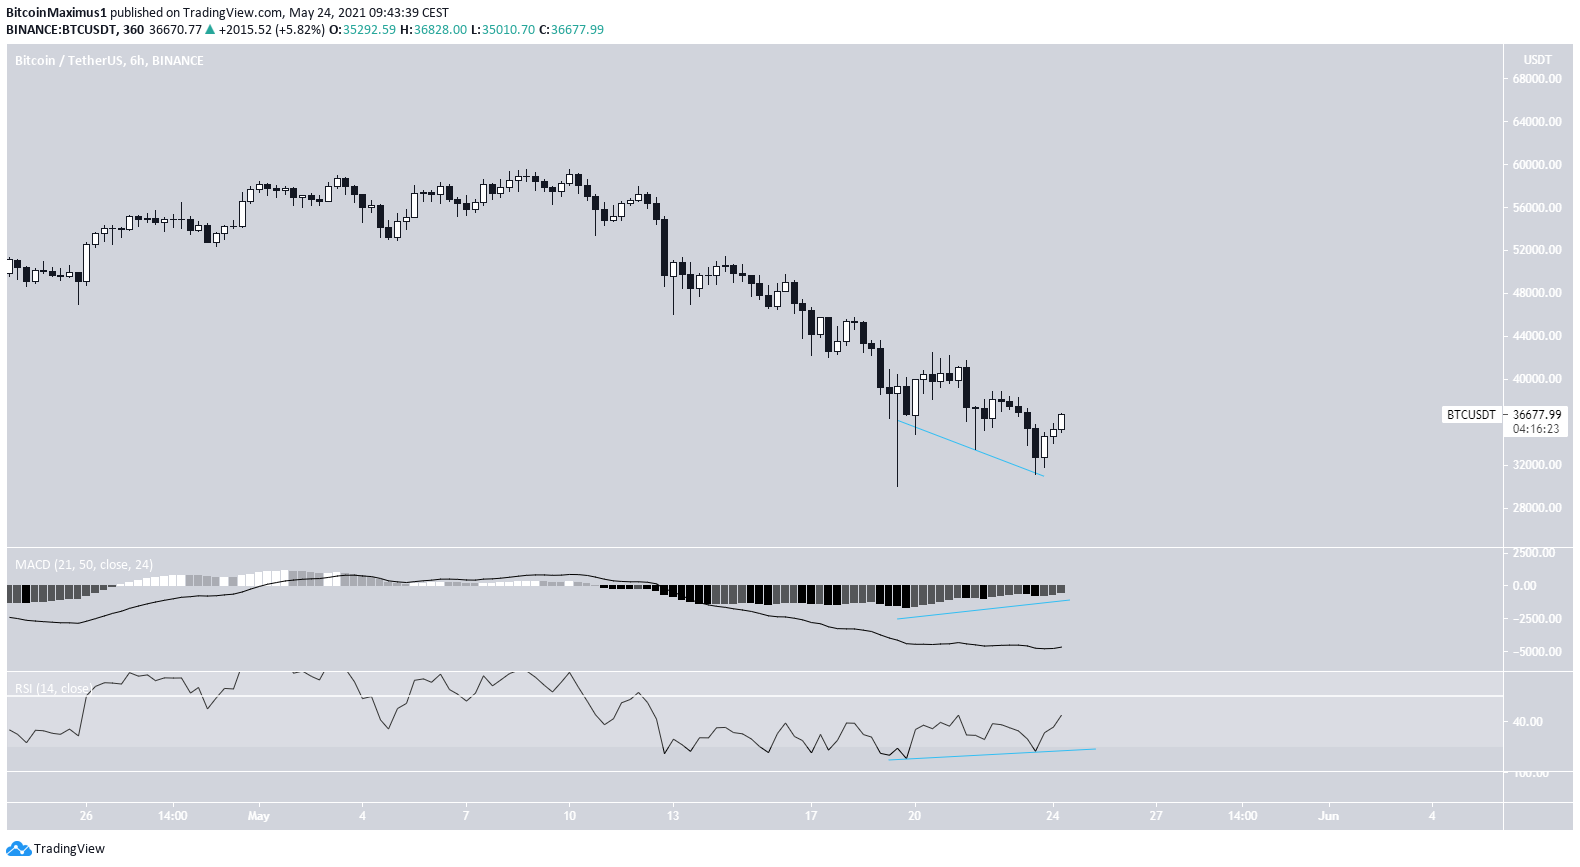
The six-hour chart appears to be more bullish.
It shows a very pronounced bullish divergence in both the MACD and RSI. The former is very close to crossing into positive territory.
This is a possible sign of a trend reversal, at least in the short term.
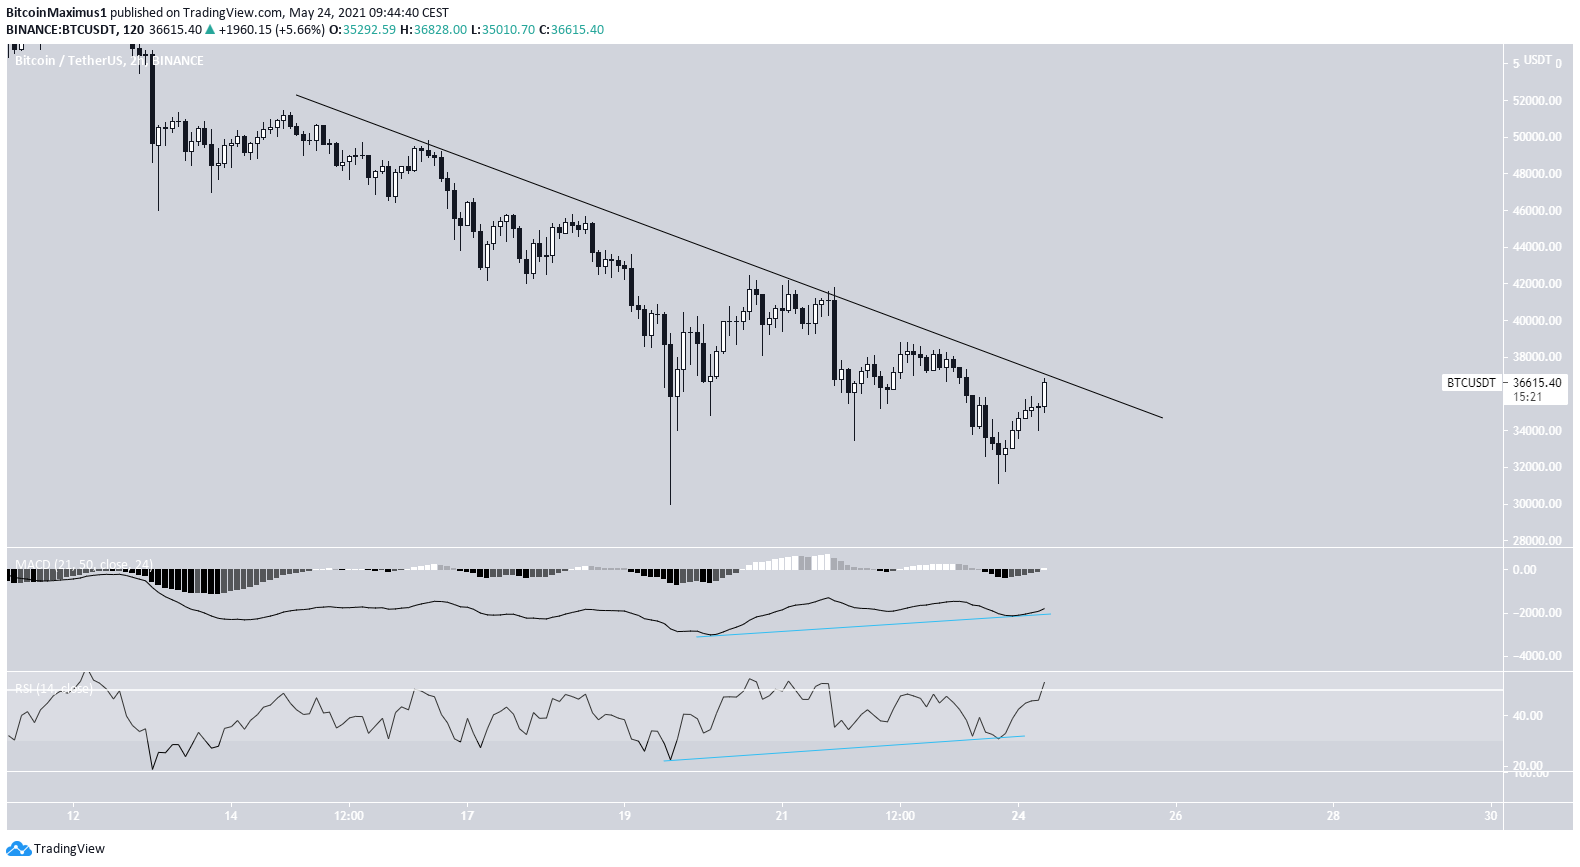
The two-hour chart shows a potential descending resistance line in place.
However, similar to the six-hour chart, both the MACD and RSI have generated an even more significant bullish divergence. The MACD has also crossed into the positive territory.
As a result, a breakout from the descending resistance line is likely.
Conclusion
Bitcoin is expected to break out from a descending resistance line and gradually increase towards the resistance levels at $41,200 and possibly $48,200.
For BeInCrypto’s previous bitcoin (BTC) analysis, click here.



