


On Dec 7, 2018, the Civic Secure Identity Ecosystem (CVC) was listed on Coinbase Pro. Four days later, it closed at an all-time low.
CVC launched in July 2017 with a fixed supply of one billion tokens. Its purpose is to act as a universal identity verification service on the blockchain. Its value, however, has fallen since July 16, 2017. On Dec 11, 2018, it reached an all-time low, even after being listed on Coinbase Pro only four days earlier.
Major Price Fluctuations with Trends
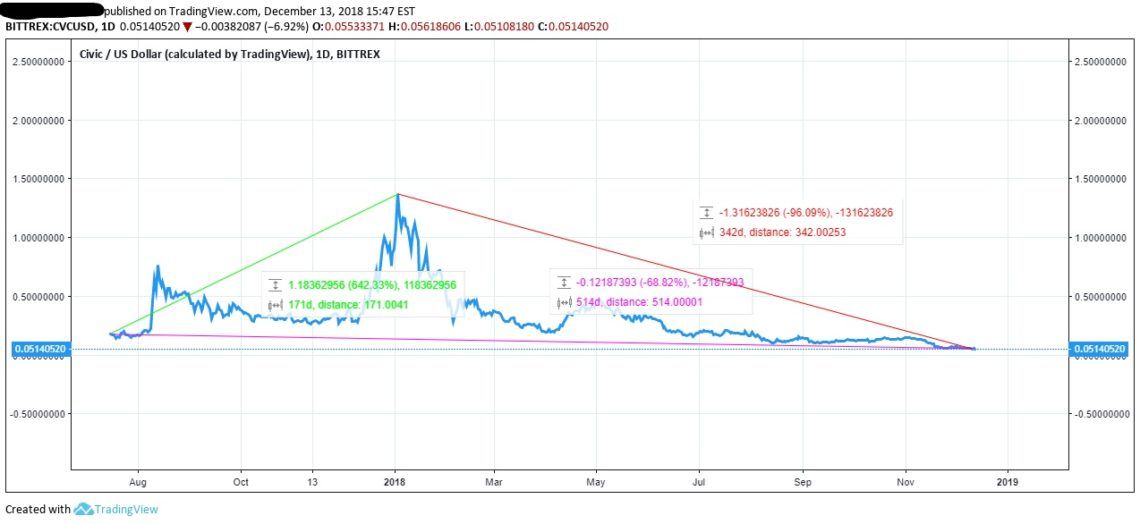
July 16, 2017, is the first day CVC is charted by TradingView. At the close on Dec 12, 2018, 514 days elapsed. Our data set includes each of these date points as seen in the chart below:
Three trends are tracked during this period focusing on the relationship between four variables:
- Closing price on July 16, 2017 (the first day CVC is charted)
- The closing high reached Jan 3, 2017
- The closing low reached on Dec 11, 2018
- The closing price on the final day of the data set (Dec 12, 2018)
These trends are discussed in more detail below:
1) The green trend line documents the change in value between July 16, 2017, and Jan 3, 2018, when the CVC’s closing high was reached.
The closing price on July 16, 2017, is given at USD 0.1771. On Jan 3, 2018, the price had increased to $1.1369864. During this 171 day period, CVC’s value in USD increased 642.33 percent.
2) The red trend line documents the decrease in value from the closing high of Jan 3, 2018, and the closing low reach by CVC on Dec 11, 2018.
Over the following 342 days, CVC lost 96.09 percent of its total value falling to a closing low of $0.5362474 on Dec 11, 2018.
3) The purple trend line documenets the overall decrease in value across the entire data set.
Between July 19, 2017, and Dec 12, 2018, CVC drops from USD 0.17710000 to USD 0.05522607, a total loss of 68.82 percent.
RSI Correlates Periods of Increased Price to Overbuying
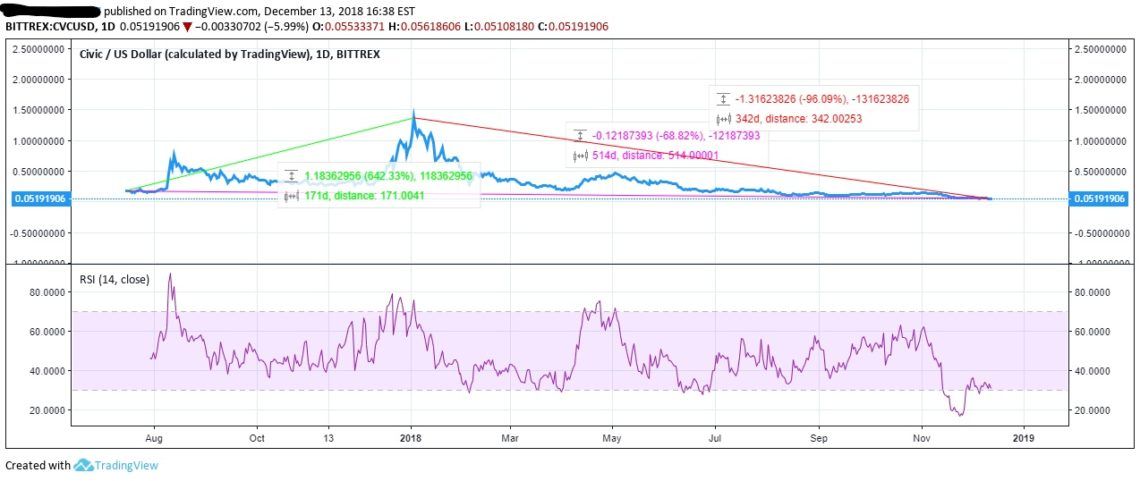
On Aug 9, 2017, the price of CVC was $0.22424015. 24 hours later, the price more than doubled to $0.45575925. During this same period, relative strength index (RSI) increased from 61.8253 to 84.3394. Price also increased to $0.64123840 on Aug 10. RSI maintained its overbought status until Aug 15.
As can be seen in the graph above, increases and decreases in RSI during this period correlate with increases and decreases in the average USD price of CVC.
When RSI exceeds 70, an asset enters into a period of overbuying. At 80, a period of significant overbuying occurs. Significant overbuying of CVC reached its height for the data set on Aug 11, 2017, when it hit 89.6207.
Correlations between the period of overbuying as indicated by RSI and abnormal increases in price occurred during two other periods:
Between Dec 18, 2017, and Jan 3, 2018
During this period, RSI fluctuated between overbought levels (70+) and high levels of normal buying (the lowest RSI during this period was 57.2095 on December 30). It did not, however, reach significant levels of overbuying above the 80 point zone.
January 3 also marked the highest closing price of CVC in USD, reached after a period of growth beginning in early December. After January 3, price and RSI drop significantly.
Between April 15 and May 3, 2018
Similarly to the period Dec 18, 2017, and Jan 3, 2018, RSI fluctuated between overbought levels (70+) and high level of normal buying during the time period between April 15 and May 3.
Price increases began on April 6 (eight days prior) and ended on May 3. During this period, an increase of $0.19691190 on April 6 increased to $0.47623920 on May 3, an increase of 141.85 percent.
A Collapse in Price Leading to Current Overselling
Following May 3, the price of CVC continued falling. On June 22, it fell to $0.17475199, a value lower than that observed on July 16 when it was first charted. Over the next nearly six months, the price would continue falling until reaching its lowest closing point of $0.05362474.
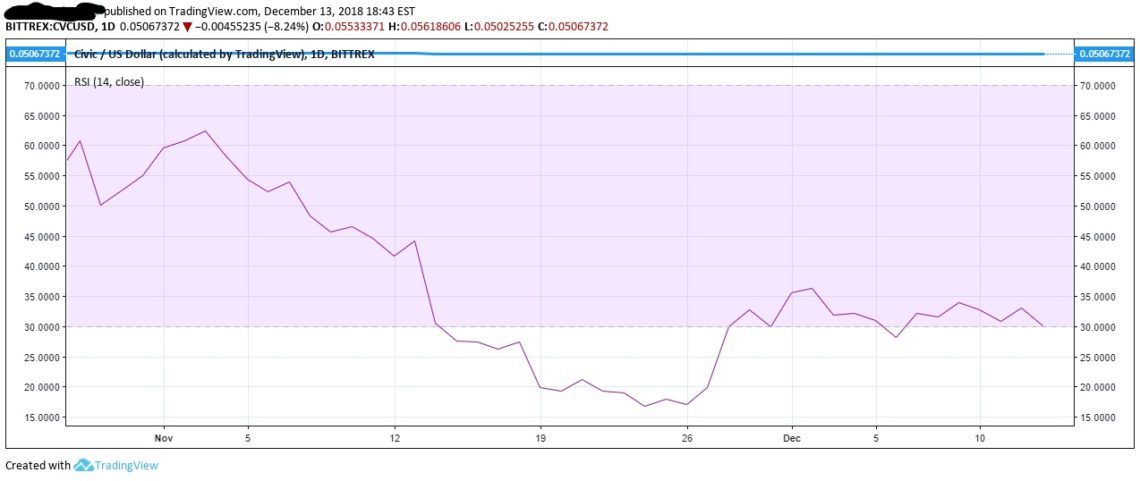
Despite continuing decreases in price until Dec 11 when the low of $0.05362474 was reached, RSI values during the period Nov 27 to Dec 11 remained at the low range of normal buying and selling, except on Nov 30 and Dec 6 when values RSI reached 29.9166 and 28.1519 respectively.
Qualitative Factors Worth Noting
Two noteworthy qualitative factors occurring on Dec 7 and 11, 2018, may impact value in the future:
- The listing of CVC on Coinbase Pro on Dec 7, 2018
- The announced partnership between Civic and Johnson Controls on Dec 11, 2018.
The effects of both over a longitudinal period may result in an increase in the value of CVC.
So far, however, the listing of CVC on Coinbase Pro has not changed the overall decline in value seen during this period. On the contrary, CVC reached its all-time closing low only four days after being listed.
One day after the announced partnership between CVC and Johnson Controls, however, correlate with an increase in the value of CVC. The price on Dec 12, 2018, at $0.005522607 marks a 24-hour increase in the value of $0.00160133, a total rise of just under 3 percent. This correlation, however, is not necessarily causal.
More time must elapse before a technical analysis will be able to conclusively determine whether either or both of these events will lead to a shift in the current negative trend encountered by CVC over the last 514 days.
Conclusion
Civic’s fall during this 515 period should be correlated with the increase in MANA’s increase in value during its 380-day traded period discussed here. Though the data set for Civic is significantly larger than MANA’s, both organized within similar parameters: the total amount of time charted by TradingView. The starting point of the data sets correspond to the date in which trading information for each became available.
The increase in the value of MANA over its trading period is significant because it marks longitudinal increases in value and potential as a long-term holding that we cannot coorelate to CVC. However, the partnership with Johnson Holdings or its current listing on Coinbase Pro, and listings on future exchanges may increase the value of CVC.
What do you think? Do you think Civic can be saved or is it doomed to failure? Let us know your thoughts in the comments below!


