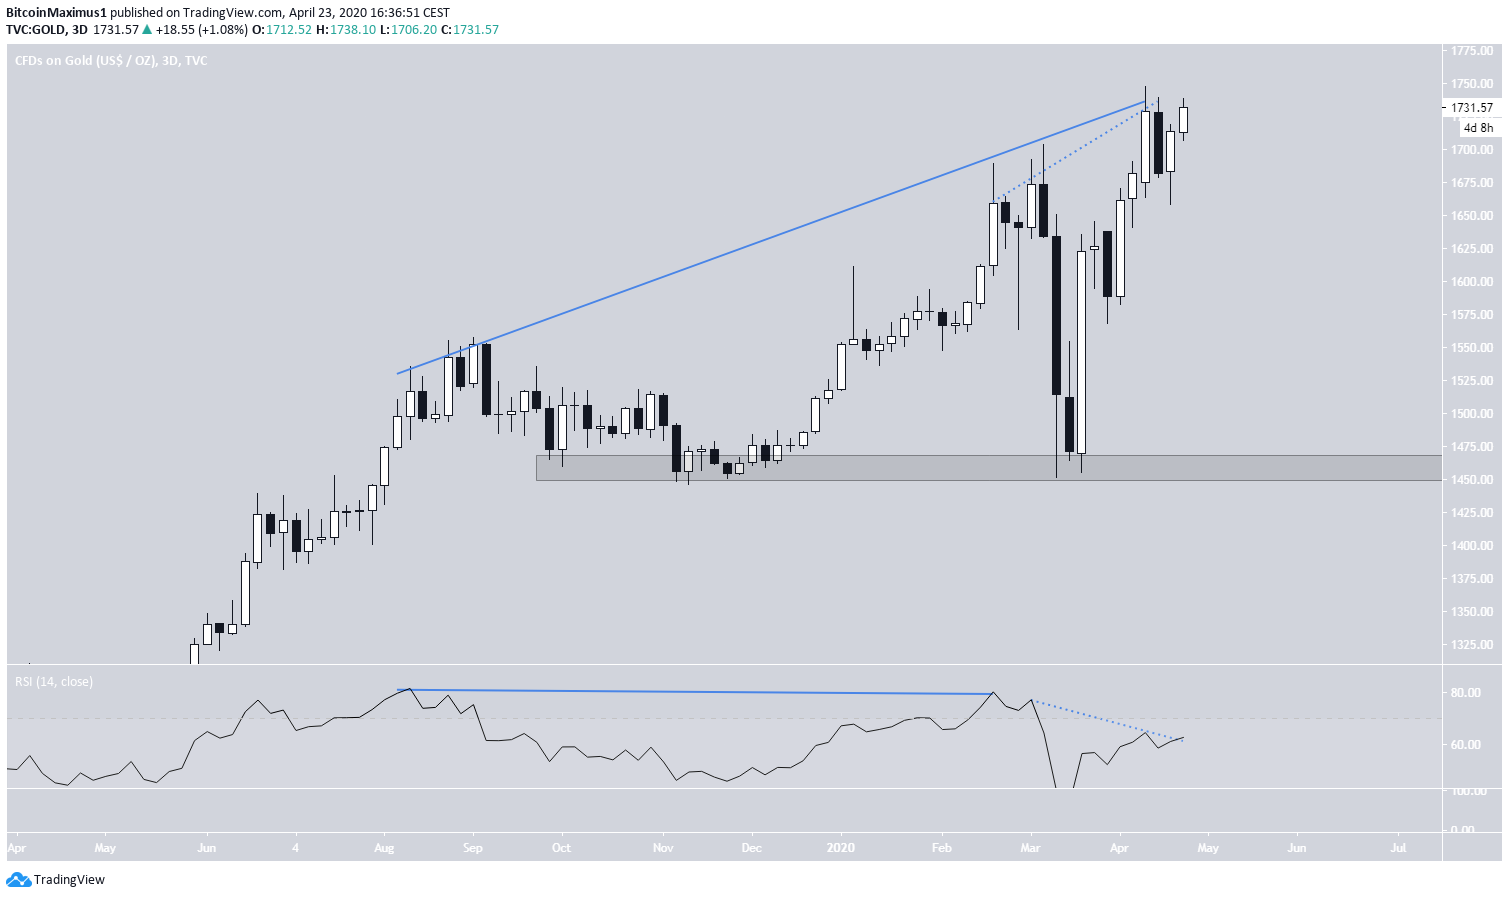
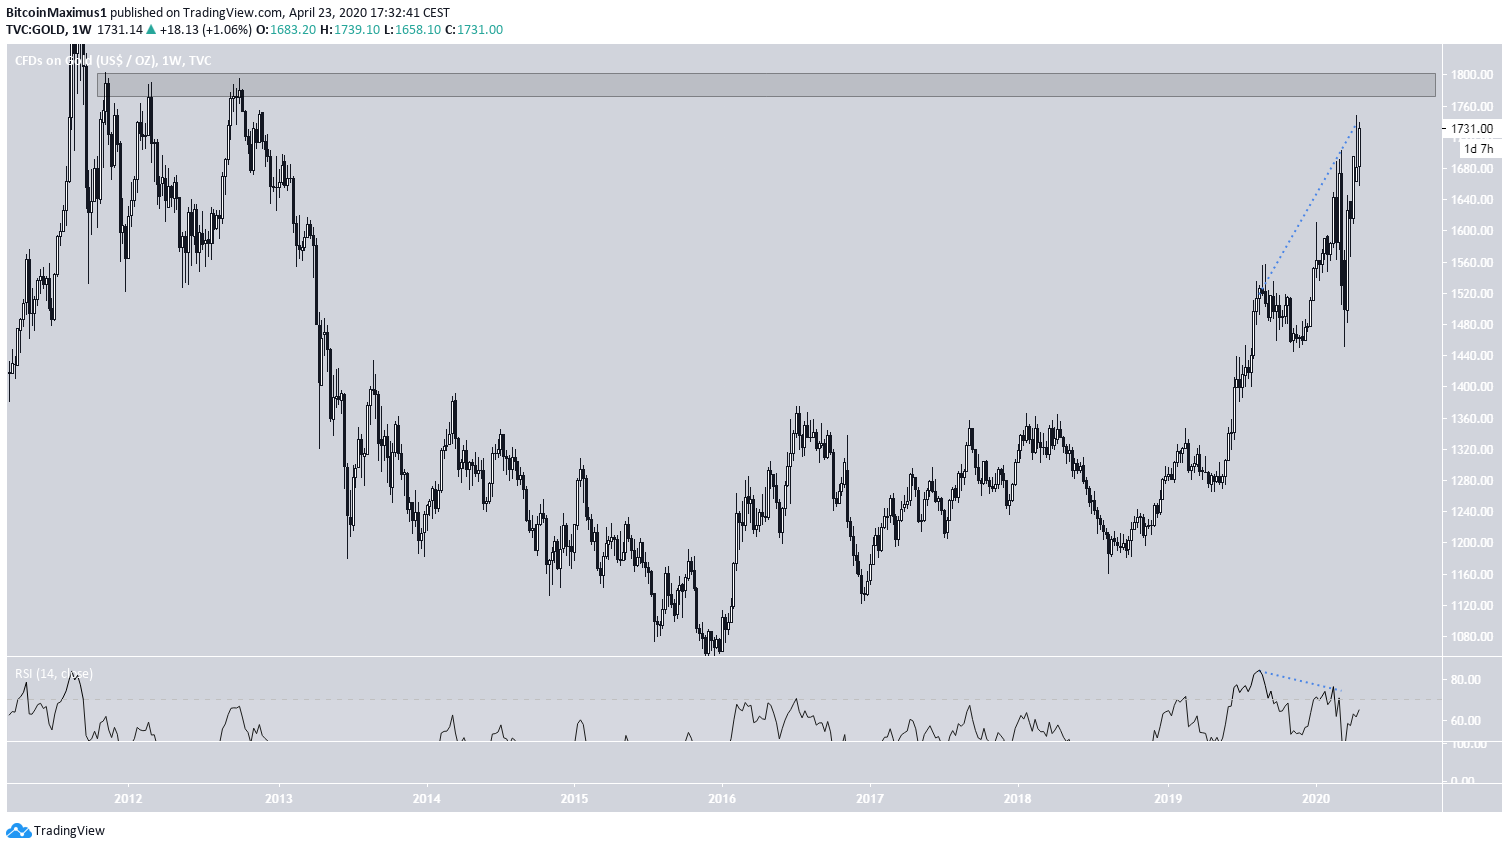
The gold price has increased considerably since March 16, having recouped the entire losses from March 9-11. However, the rally has begun to show weakness in the form of several bearish divergences.
After the massive oil crash on April 20, questions on whether other commodities will follow suit and which will be the first to do so have been rampant. Twitter user @Russian_Market made an interesting prediction, stating that the oil price crash will be followed by a similar decrease in the price of gold.
“After oil crash we will see gold crash.”Below, we will take a look at the gold price and see if it is likely to go down. We previously posted an analysis that compares the correlation of the BTC price and that of oil, so the current one will focus mainly on gold and BTC.
Gold
The gold price has recouped almost the entire losses resulting from the March 9-12 decrease, which was present in almost every market. After the decrease, the price reached the $1,450 support area, which has been offering support almost for the entirety of 2019. The price reached a bottom of $1,451 on March 16 and has been increasing ever since. While the price has created several bullish engulfing candlesticks, it has shown some strong signs of weakness. There is a considerable bearish divergence developing in the three-day RSI in two separate instances. This suggests that the price is likely to go down in the near future, possibly validating the $1,450 support area once more.

Comparison to Bitcoin
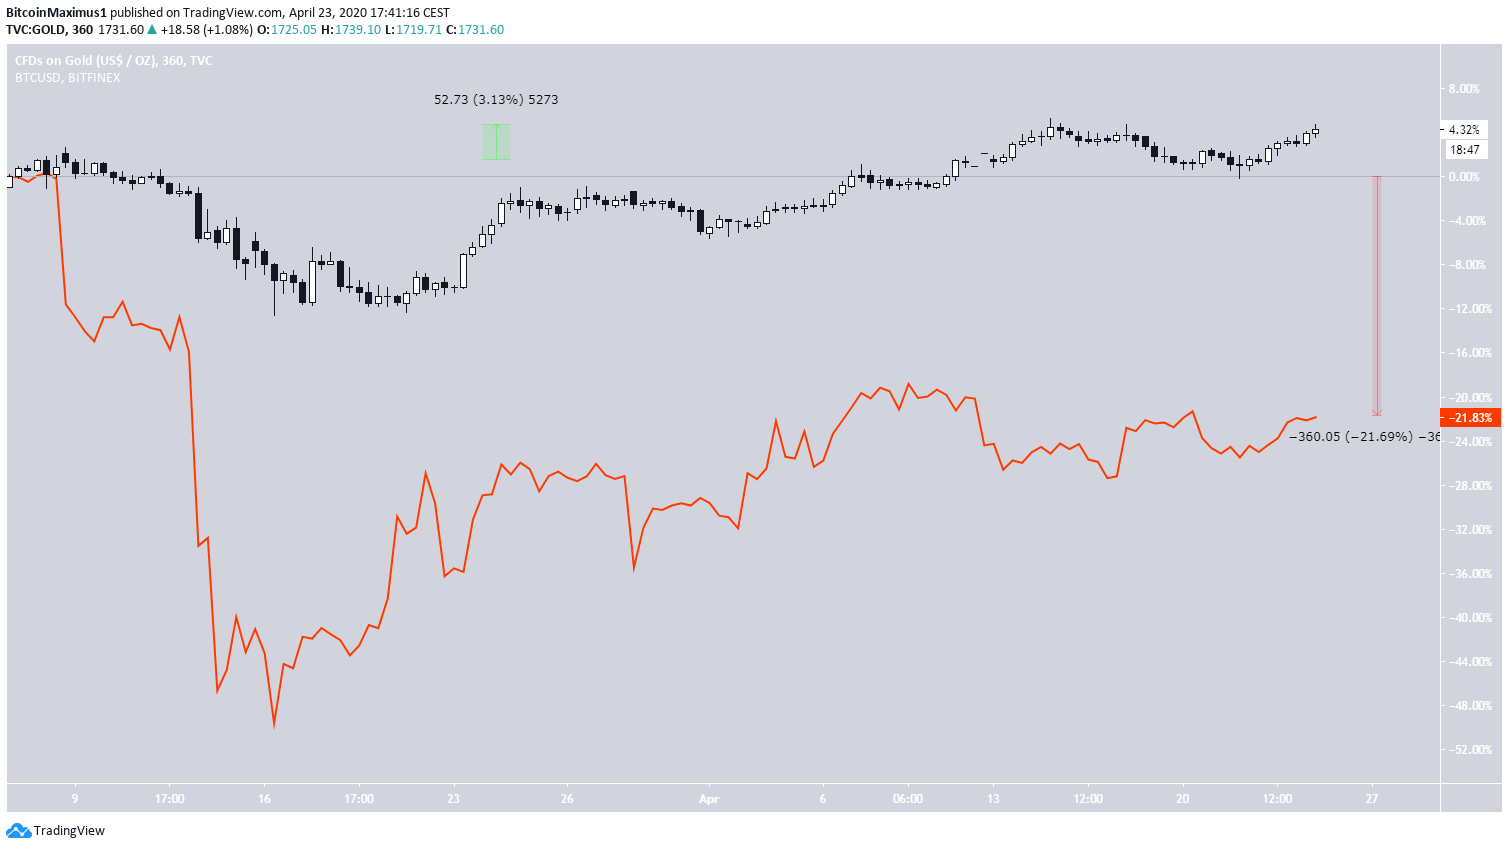
When comparing the gold price (candlesticks) to that of Bitcoin (orange), we can see that the latter has fared much worse since the rapid decrease on March 9-12. While gold has increased by 3% relative to the price on March 9, BTC has decreased by 21%. Therefore, the recovery of gold has been much quicker than that of BTC, since the price has already reached a new high relative to that in March.
Top crypto platforms in the US
Disclaimer
In line with the Trust Project guidelines, this price analysis article is for informational purposes only and should not be considered financial or investment advice. BeInCrypto is committed to accurate, unbiased reporting, but market conditions are subject to change without notice. Always conduct your own research and consult with a professional before making any financial decisions. Please note that our Terms and Conditions, Privacy Policy, and Disclaimers have been updated.

Valdrin Tahiri
Valdrin discovered cryptocurrencies while he was getting his MSc in Financial Markets from the Barcelona School of Economics. Shortly after graduating, he began writing for several different cryptocurrency related websites as a freelancer before eventually taking on the role of BeInCrypto's Senior Analyst.
(I do not have a discord and will not contact you first there. Beware of scammers)
READ FULL BIO
Sponsored
Sponsored
