


![Is the Current Ethereum Price Reminiscent to That of Amazon in 2006? [Premium Analysis]](/_mfes/post/_next/image/?url=https%3A%2F%2Fassets.beincrypto.com%2Fimg%2FvlLefvJdVFUnOPILcLA0_y-5ZH4%3D%2Fsmart%2F7067c8c488be491899a5fd4b5894a42d&w=1920&q=75)
Both Ethereum and Amazon have been subject to a rapid price increase followed by a very long correction. While there are some similarities between the prices of both, they are insufficient in order to be considered fractals.
At the current time, the Amazon and Ethereum prices are at very different points in their market cycle. While the former is near an all-time high, Ethereum has been decreasing for almost two years.
However, the price movement of Amazon in its inception shares some similarities with that of Ethereum. Market analyst @IamCryptoWolf outlined a fractal in which the Ethereum price follows that of Amazon.
Ethereum vs Amazon fractal. pic.twitter.com/RRMO3EbdJl
— Wolf 🐺 (@IamCryptoWolf) December 4, 2019
If Ethereum continues following this fractal, it will reach a new all-time high in the end of 2021.
Let’s take a closer look at the prices of both assets and see if that will be the case.
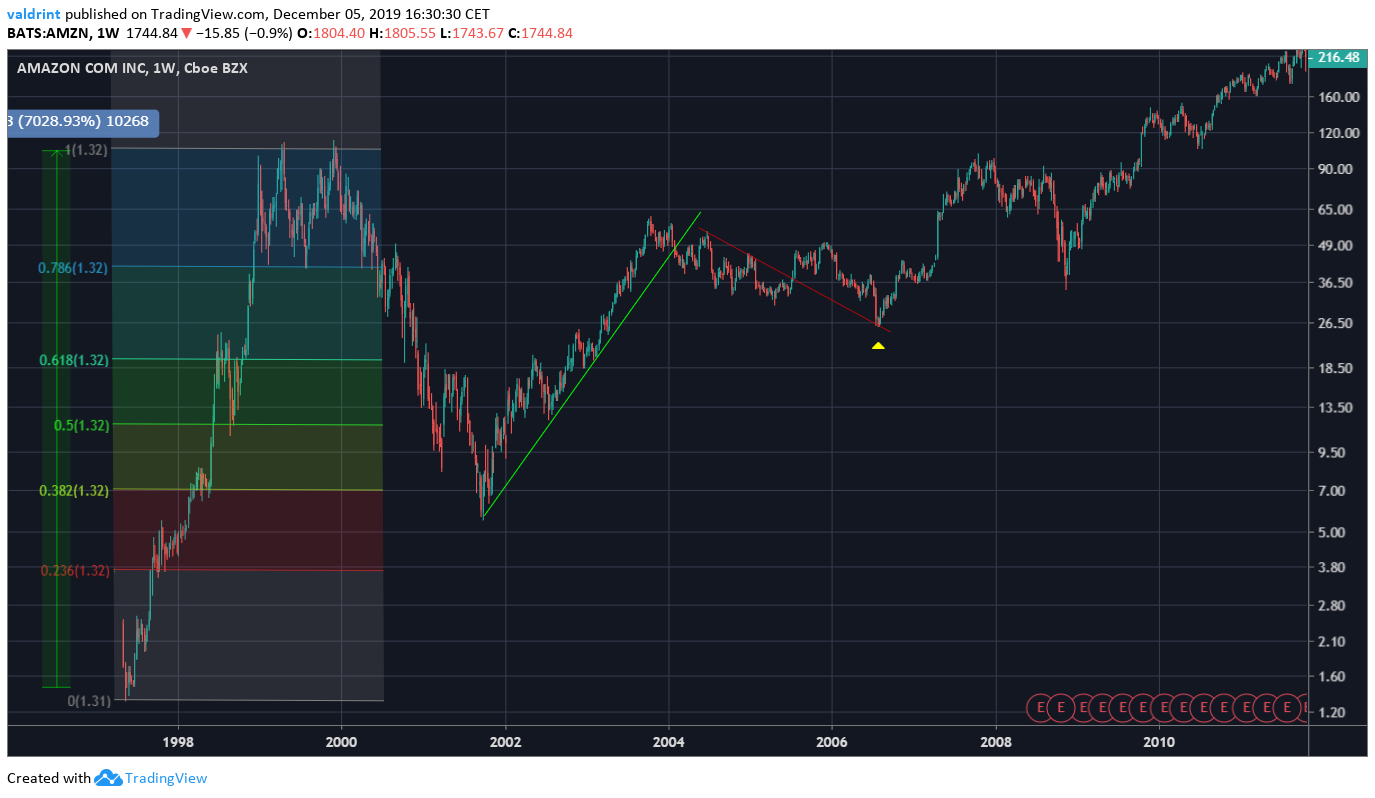
Amazon
On May 17, 1997, the Amazon price reached a low of $1.71. It began a rapid upward move that lasted until December 1999, at the time the dot-com bubble burst.
The price reached a high of $113, an increase of 70x relative to the low, before embarking on a two-year-long downward trend. The price retraced all the way to the 0.382 fib level and began an upward move.
On November 2003, the price reached a high of $63 before decreasing along a descending resistance line. Once it broke out above the line and validated it, it began the 13-year upward trend which has taken it to the current price of $1750.
According to the tweet, the validation of the resistance line (yellow arrow) indicates the position of the current Ethereum price relative to Amazon’s market cycle.
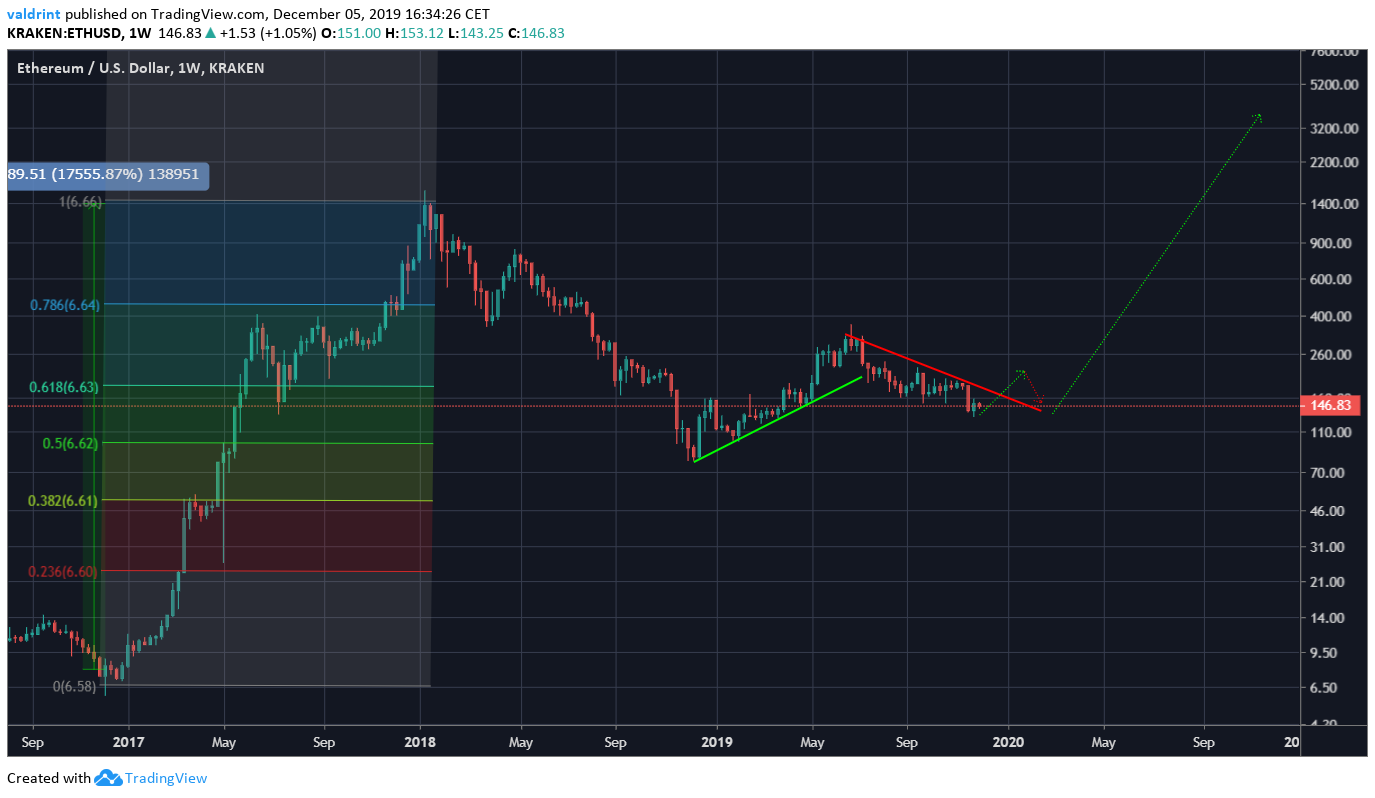
 Ethereum
For the fractal, the tweet does not measure the Ethereum price from its inception but rather from its 2017 low.
The Ethereum increase was more than twice stronger than that of Amazon, since the price increased by 175x.
Afterward, the price began a yearlong downtrend which ended with a low of $80, slightly below the 0.5 fib level. This differs from Amazon’s correction, which retraced all the way to the 0.382 fib level.
Since the price reached a high of $363 in June, it has been decreasing along a descending resistance line. In order to continue following the Amazon fractal, it should break out above the line and validate it as support.
Verdict
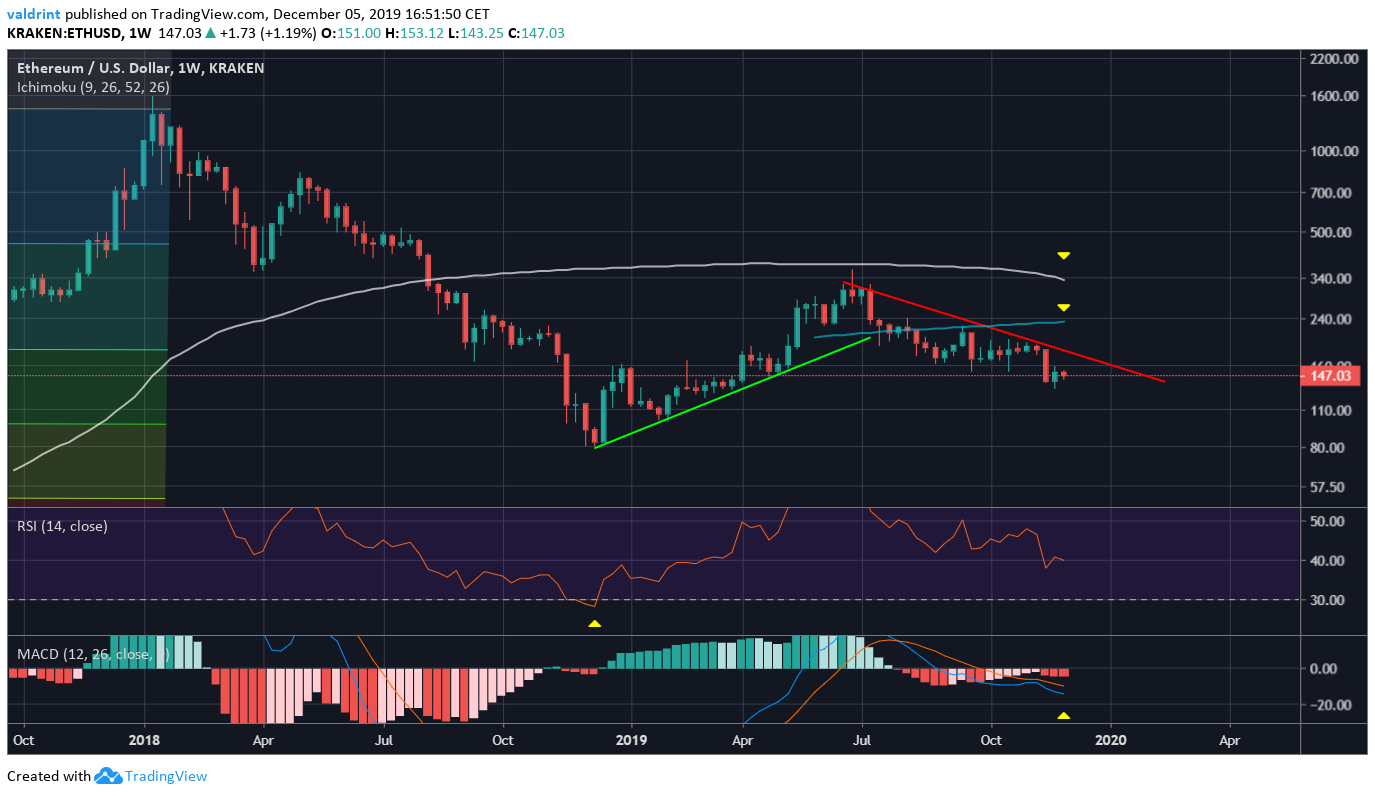
Looking at technical indicators, the Ethereum price is trading below the 100- and 200-week moving averages (MA).
The RSI is at 40, indicating neither oversold nor overbought conditions. The December 2018 low coincided with an oversold RSI. The MACD has almost made a bullish cross.
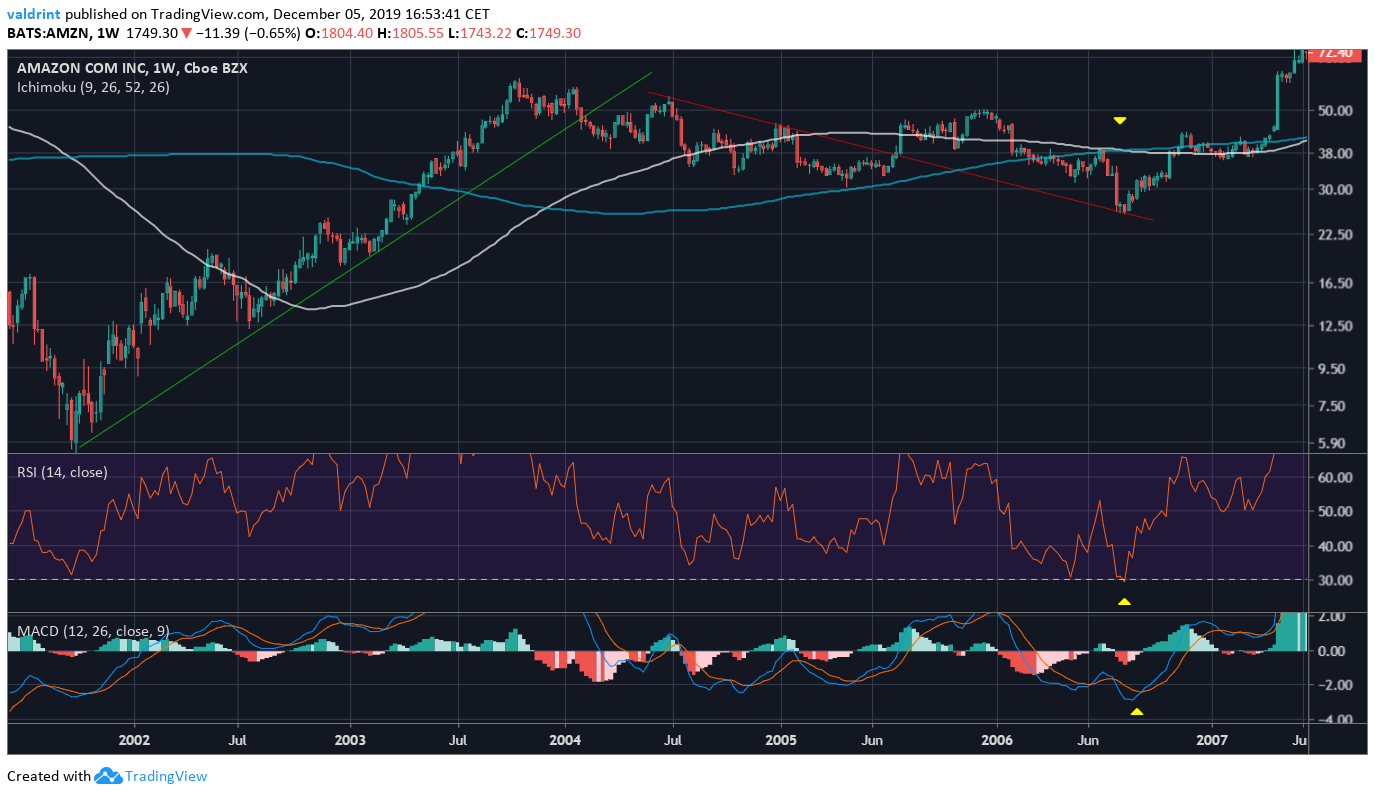
In 2006, Amazon also traded below the 100- and 200-week MAs and the MACD was in the process of making a bullish cross. Both these readings are similar to those of Ethereum.
However, the RSI had made a double bottom inside the oversold area, indicating that an upward move will soon begin.
To conclude, while the prices of Ethereum and Amazon have some similarities, we do not believe that they are sufficient to use the price of Amazon to determine the future price of Ethereum. Additionally, these similarities dissipate almost completely if we use the entire price history of Ethereum instead of a selected time period.
Disclaimer: This article is not trading advice and should not be construed as such. Always consult a trained financial professional before investing in cryptocurrencies, as the market is particularly volatile.


