


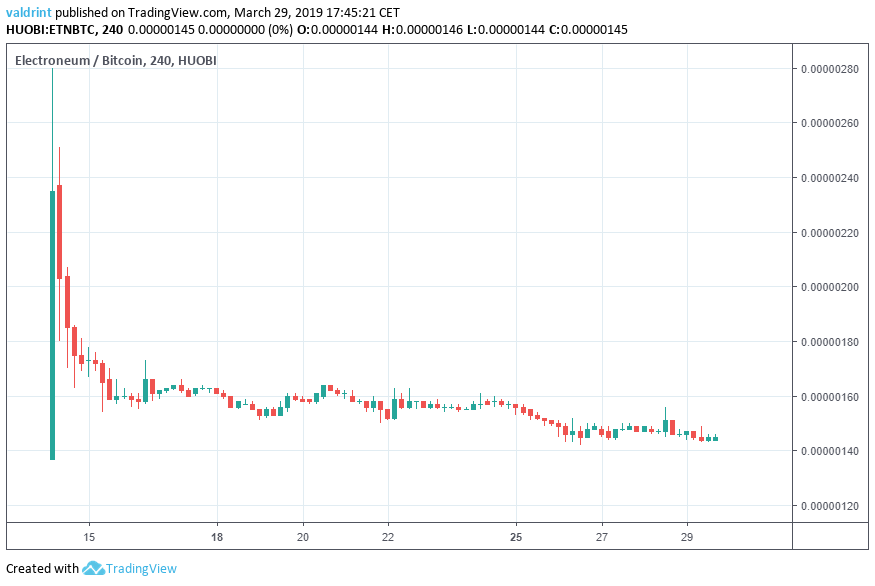
On Mar 13, Electroneum (ETN) was listed on Huobi. The next day prices spiked from less than 140 satoshis to 280 on Mar 14.
It has been on a gradual downtrend since, reaching a low of 141 satoshis at the time of writing on Mar 29.
While the Huobi listing provided a strong boost to the coin for a very brief period of time, ETN has returned to levels before the listing. The dump has not been catastrophic, but it is certainly noticeable:
Electroneum (ETN): Trends And Highlights For March 29, 2019.
- Electroneum is trading inside a descending channel.
- There is bullish divergence developing in the RSI.
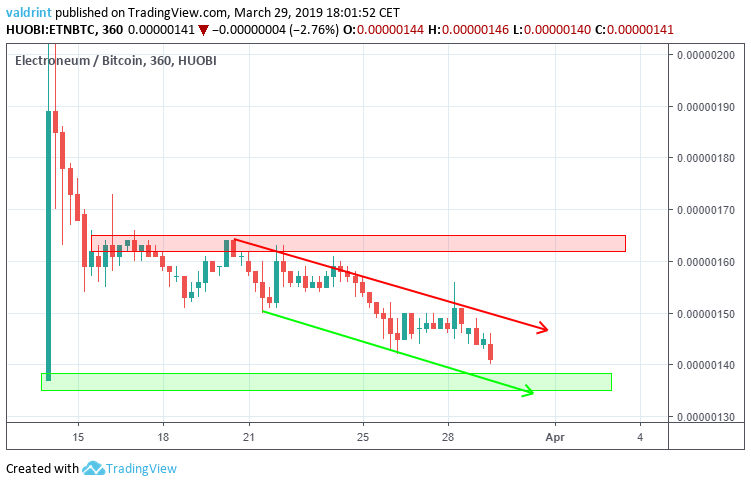
- There is resistance near 163 satoshis.
- There is support near 137 satoshis.
Descending Channel
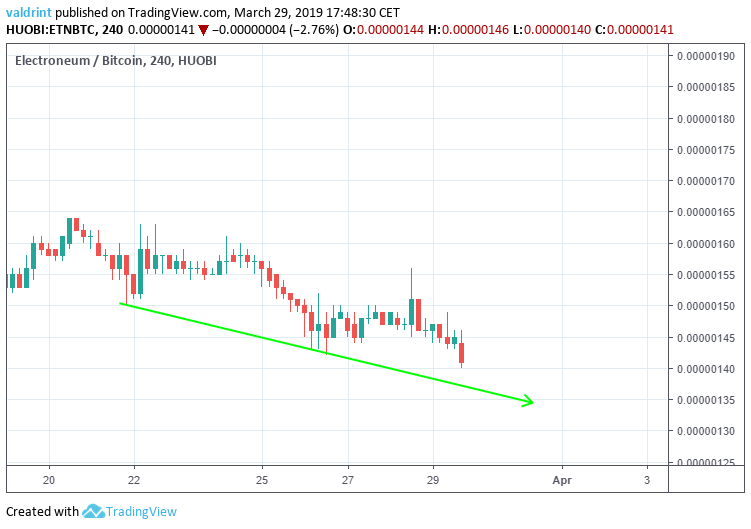
The price of ETN on Huobi is analyzed at four-hour intervals from Mar 19 to Mar 29 to trace its current trading pattern.
The price made a low of 150 satoshis on Mar 21. It has been slowly decreasing since, creating several lower lows.
Tracing these lows gives us a descending resistance line:
The price of ETN made a high of 164 satoshis on Mar 20. A gradual downtrend ensued. The price has made several lower highs. Tracing these highs gives us a descending resistance line.
The support and resistance lines combine to form a descending parallel channel:
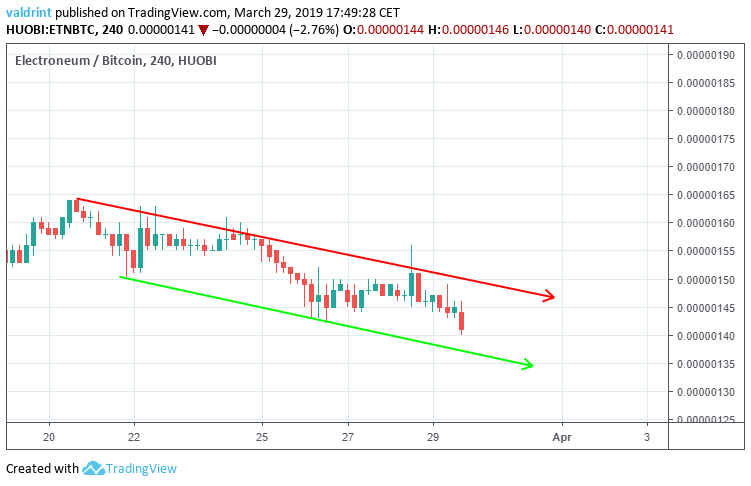
This is a generally neutral pattern with prices rising and falling between support and resistance. However, the downward angle of the channel suggests gradual average price decreases.
RSI Divergence
To better assess future price fluctuations, we incorporate relative strength index (RSI) into our analysis.
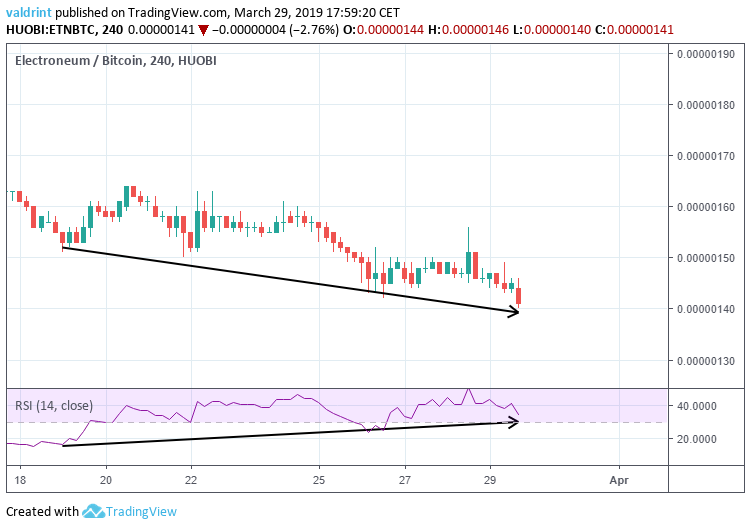
On Mar 19, the price made a low of 151 satoshis. It has proceeded to make lower lows since. Similarly, the RSI made the first low on Mar 19. However, it has continued to generate higher values.
This is known as bullish divergence and often precedes increases in price.
Based on this indicator, it is likely that the price will increase towards the resistance line in the near future.
Reversal Areas
The price of ETN on Huobi is analyzed at six-hour intervals from Mar 14 to Mar 29 in order to better visualize possible reversal areas. Resistance and support areas are used.
The closest resistance area is found near 137 satoshis. If the price keeps decreasing at the rate predicted by the channel, it is likely that it will reach this area in the near future. However, RSI indicates a possible upward movement. Based on the channel, it appears likely that price may drop to the support line and then initiate an upward move toward resistance.
Summary Of Analysis
Based on our analysis, ETN is likely to keep decreasing at the rate predicted by the descending channel. We believe a breakout will eventually occur, but not necessarily in the near future. However, short-term price increases are likely.
It appears as if ETN may drop to the support line before an upward move ensues. This means a small dip in price before a slightly larger gain in the short-term despite long-term losses.
What do you think will happen to the price of ETN? Let us know in the comments below.
Disclaimer: This article is not trading advice and should not be construed as such. Always consult a trained financial professional before investing in cryptocurrencies, as the market is particularly volatile.


