

- The $6,900 area holds and BTC begins an upward move towards $7,800.
- The $6,900 area fails to hold and BTC decreases towards the midpoint (EQ) of the previous range at $6,300.
At the time of writing, the price was trading at $6,895. In the article below, we will take a look at the BTC price in different time-frames and alongside technical indicators in order to determine which possibility has a higher chance of transpiring.$BTC
— George (@George1Trader) April 10, 2020
Just closed 20% of my short. This is the last place where bulls could step in hard imo… Break back above the yearly open and we're probably going for those highs into 7.6k -7.8's. Break below the weekly open and it's game over.
Let's see. pic.twitter.com/1xgZLW69Lb
Trading Range
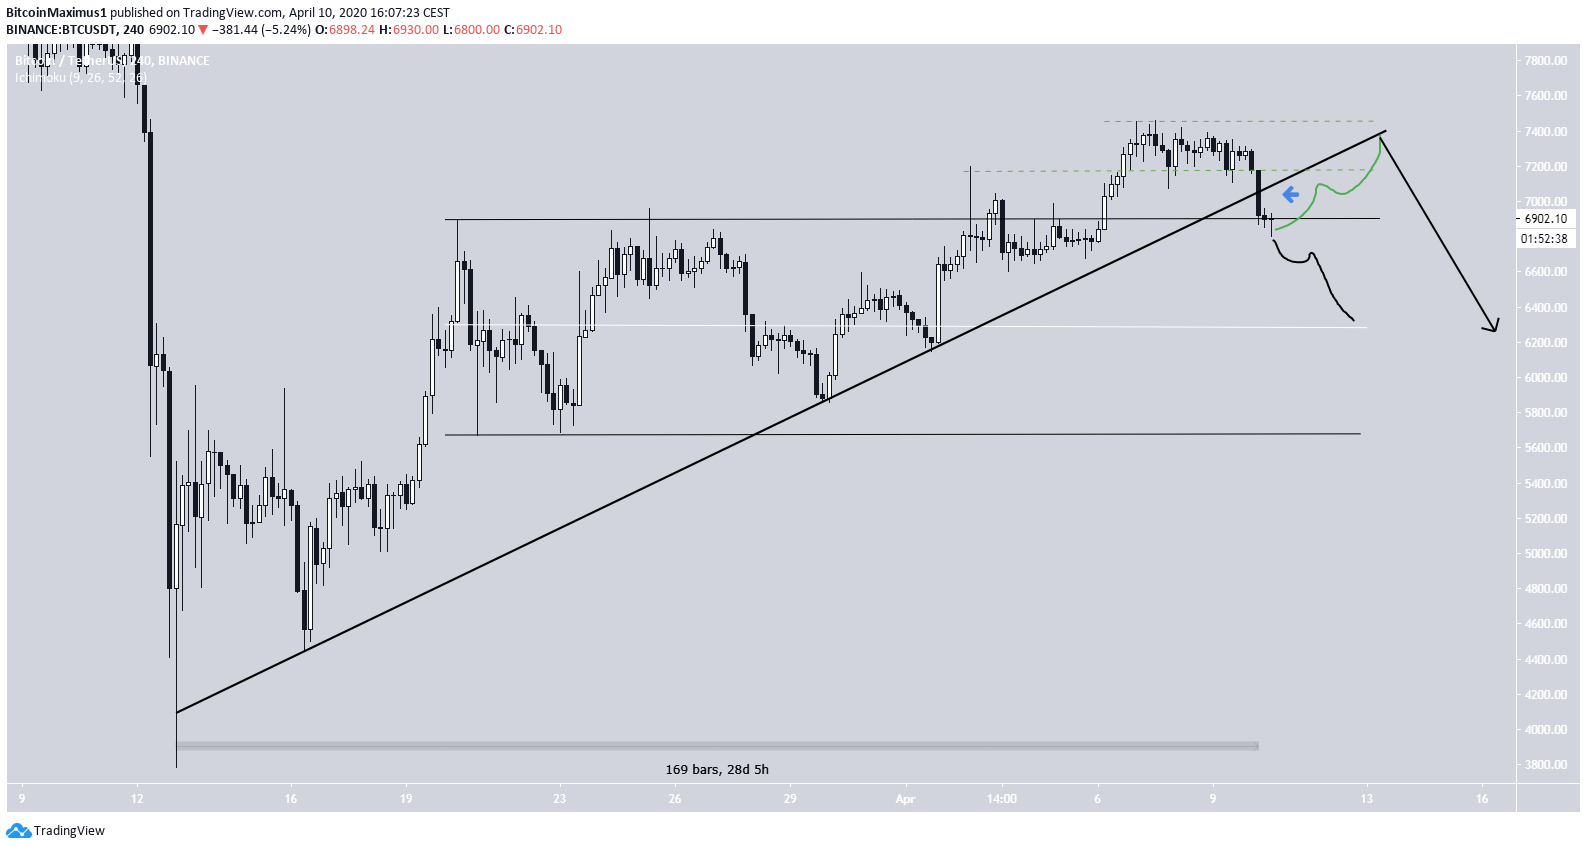
The BTC price is currently trading right at the resistance line of the previous range at $6,900. The two possibilities for future movement are shown in the image below. At first glance, it seems more likely that the price will decrease. After BTC broke out above the range on April 7, it could not sustain the higher prices and has fallen back to the breakout level. If the price bounces upwards, this would likely be a retest of the breakout level that leads to higher prices. This possibility is outlined by the green lines and could take the price initially towards $7,200 and then to $7,450 afterwards. However, if the price falls back within the range, it would mean that the breakout failed and the price is likely to decrease rapidly toward the EQ at $6,300 and possibly $5,700 afterwards.
Bullish Argument
One possible argument for the bullish scenario to be the correct one comes from the daily chart. The price has reached the breakout level from above, meaning that this could still be a re-test. However, the price would have to create a long lower wick and close above $6,900 in order to keep the bullish hopes alive. Furthermore, the price is facing close resistance from the 50-day moving average (MA) and is below the yearly open.
Disclaimer
In line with the Trust Project guidelines, this price analysis article is for informational purposes only and should not be considered financial or investment advice. BeInCrypto is committed to accurate, unbiased reporting, but market conditions are subject to change without notice. Always conduct your own research and consult with a professional before making any financial decisions. Please note that our Terms and Conditions, Privacy Policy, and Disclaimers have been updated.
