


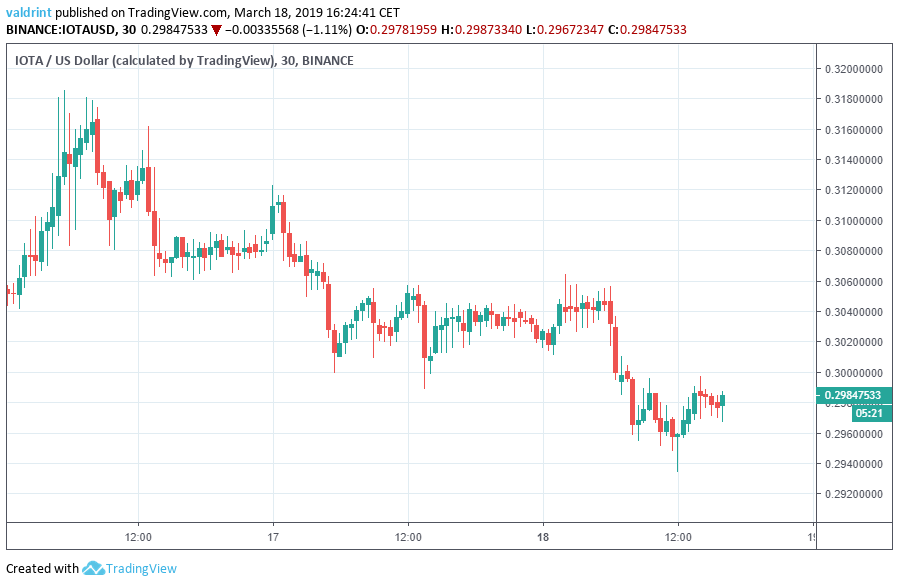
On March 16, 2019, the price of IOTA (IOTA) reached a high of nearly $0.32. It has been on a gradual downtrend since.
Here is the price outlook for the period of Mar 16 through Mar 18:
Our analysis of IOTA on Mar 13 predicted that price would increase and result in a breakout above resistance. Our prediction was validated the following day.
Check out our March 13 Analysis of IOTA Here!
According to today’s analysis, we predict that IOTA will likely continue trading within a downward facing channel. This means gradual losses for the foreseeable future. Highs within the channel may still be experienced; however, they are expected to grow successively lower over time. In the case of a breakout or breakdown, we assess that a breakout is more likely—which means the possibility of a reversal and rapid price increases.
IOTA: Trends and Highlights For March 18
- IOTA’s price has been on a downward trend since Mar 18.
- IOTA is trading inside a descending channel.
- There has been bullish divergence developing in the RSI.
- There are resistance areas near $0.31 and $0.33.
- There is support near $0.269 and $0.242.
Ascending Support Line
The price of IOTA (IOTA) on Binance is analyzed in thirty-minute intervals from Mar 16 to Mar 18.
On Mar 16, the price made a high of $0.317. A gradual downtrend ensued. Several market cycles were completed along this trend. Each high was lower than the last. Tracing these highs gives us a descending resistance line.
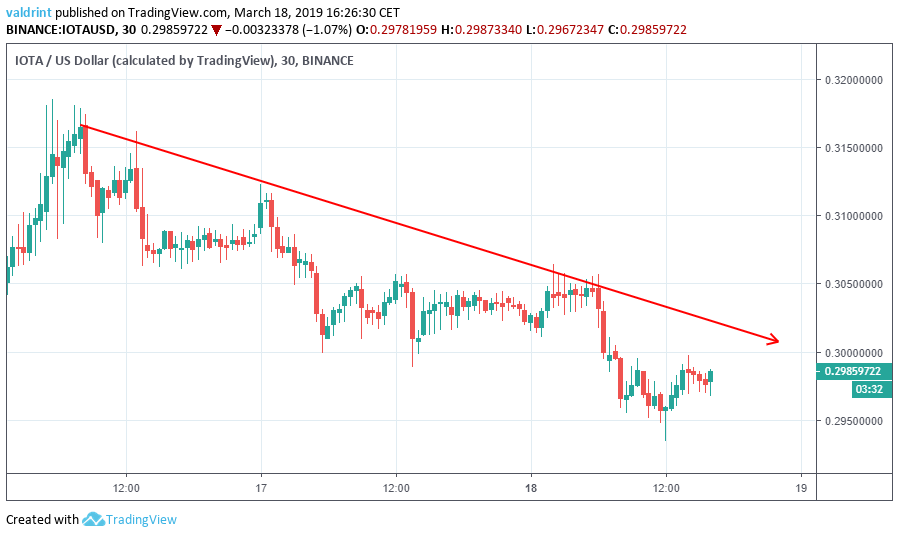
The resistance line can effectively act as a ceiling to price, preventing further upward movement. It also projects the upper limits of price for a given period based on historical price fluctuations. Finally, it gauges the rate of decrease.
Price has been decreasing at the same rate as predicted by the resistance line.
It is likely that the price will keep decreasing at a steady rate as predicted by the support line.
Descending Channel
On Mar 17, the price made a low of $0.3. It has gradually decreased since, with each low being lower than the preceding one. Tracing these lows gives us a descending support line.
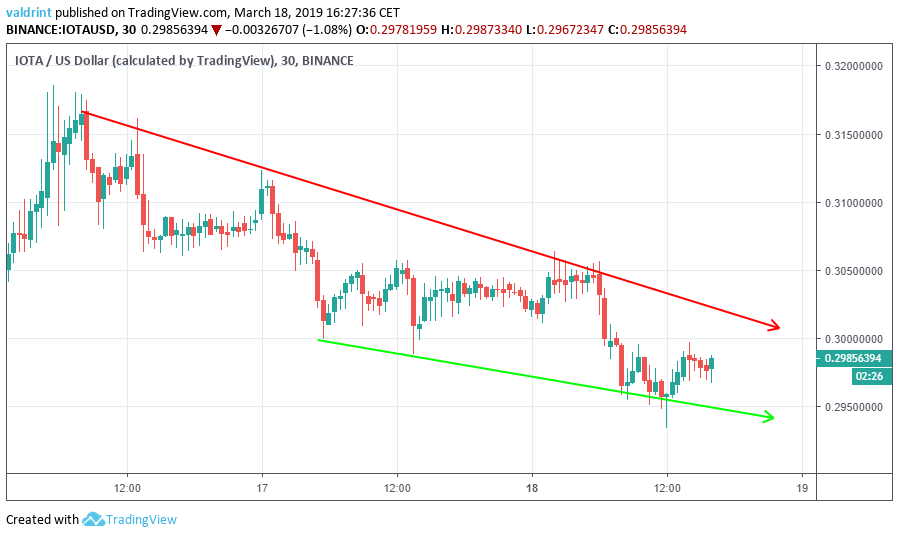
Similarly to the resistance line, the support line acts as a floor to price, preventing further downward movement.
The resistance and support lines combine to create a descending channel. This is generally a neutral pattern suggesting that price will fluctuate between the resistance and support. However, when the trend is facing downward, gradual longitudinal price decreases can be expected.
In the case of IOTA, it is also possible that the channel turns into a descending wedge, which is a bullish pattern.
It is likely that the price trades within the confines of the descending channel with gradual price decreases. There remains the possibility of a breakdown below support—which would likely increase the rate of losses—or a breakout above resistance—which would lead to a likely reversal and possible rapid price increases.
Potential Breakout
Combining relative strength index (RSI) bullish/bearish divergence with support/resistance essentially predicts price fluctuations.
The RSI is an indicator which calculates the size of the changes in price in order to determine oversold or overbought conditions in the market.
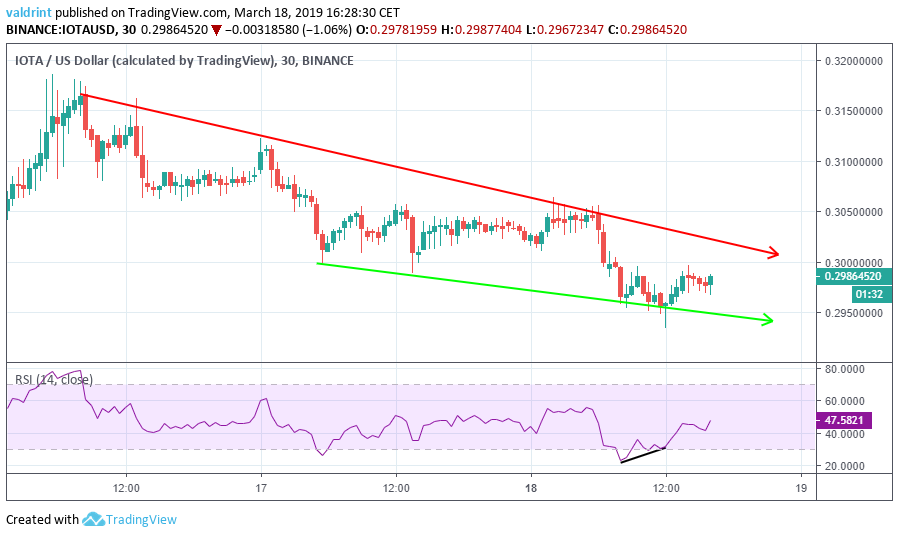
The price made a low of $0.2957 on Mar 18. It continued to make a lower low during the same day.
During the same interval, the RSI made the original low on Mar 18. However, it continued to create a higher low.
This is known as bullish divergence and often precedes price increases.
Using these indicators, it is likely that the price will move towards the resistance line to touch it, before ultimately breaking out. However, it also remains possible that a breakout is not imminent and that price will continue trading within the downward facing channel for the foreseeable future.
Future Movement
The price of IOTA (IOTA) on Binance is analyzed in four-hour intervals from Feb 12 to Mar 18 to determine possible future prices int he case of a breakout or breakdown.
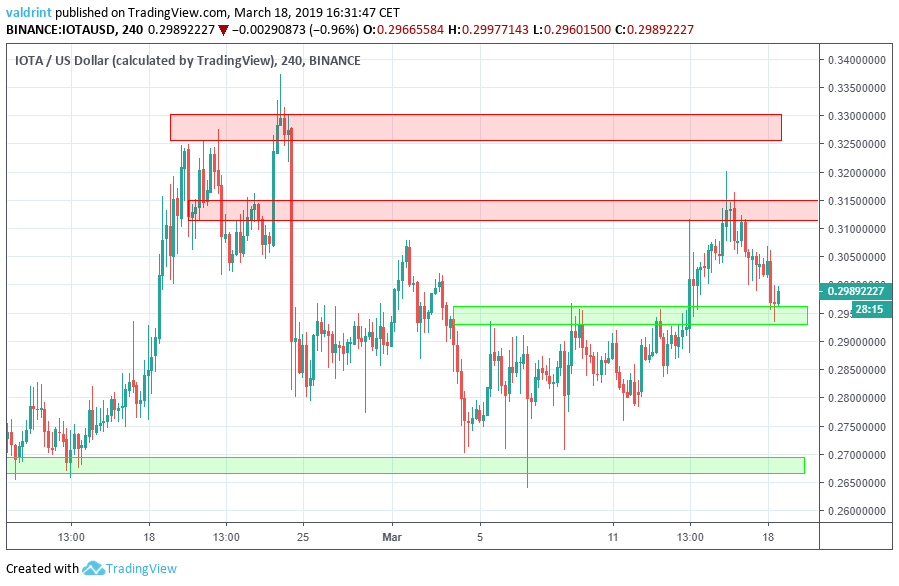
Resistance and support areas are formed when the price reaches a certain level several times. They can act as a ceiling/floor that prevents the price from moving further in that direction
The first resistance area is found near $0.31, followed by the second one near $0.33. If the price were to break out of the channel, these would present likely reversal areas. This scenario is more likely than a breakdown; however, a breakout cannot be conclusively determined as forthcoming.
The closest support area is found near $0.269. The second one is found near $0.242. If the price were to break down from the channel, these would provide likely reversal areas. According to our analysis, this scenario is unlikely.
Summary of Analysis
Based on this analysis, it is likely that the price of IOTA should continue trading within the downward facing channel. A breakout remains possible.
A breakdown below support initiating more rapid price decreases would invalidate this prediction. Partial validation would occur if a breakout occurs imminently without continued trading in the downward channel. Full validation would occur if a breakout follows continued movement in the channel for some time prior.
Where do you think the price of IOTA is heading? Let us know your thoughts in the comments below.
Disclaimer: This article is not trading advice and should not be construed as such. Always consult a trained financial professional before investing in cryptocurrencies, as the market is particularly volatile.


