


The price of IOTA (IOTA) has been on an upward movement since March 4, 2019. There has been significant volatility in the market, but each low has been higher than the previous one. The rate of growth has been increasing since Mar 12.
Our previous analysis predicted that the price would consolidate and potentially break down. While the breakdown has not yet occurred, the price has traded near the same level it had been previously.
Today’s analysis of IOTA predicts continuing price increases for the foreseeable future.
Key Highlights For March 13
- The price has been on an upward trend since Mar 4.
- The price is trading inside an ascending triangle.
- There has been bearish divergence developing in the MACD and the RSI.
- There are resistance areas near $0.305 and $0.33.
- There is support near $0.269 and $0.242.
Ascending Support Line
The price of IOTA (IOTA) on Binance is analyzed in one-hour intervals from Mar 4 to Mar 13.
On Mar 4, the price made a low of $0.270. Several market cycles have been completed since then, with each low being higher than the previous one. Tracing these successive lows gives us the ascending support line.
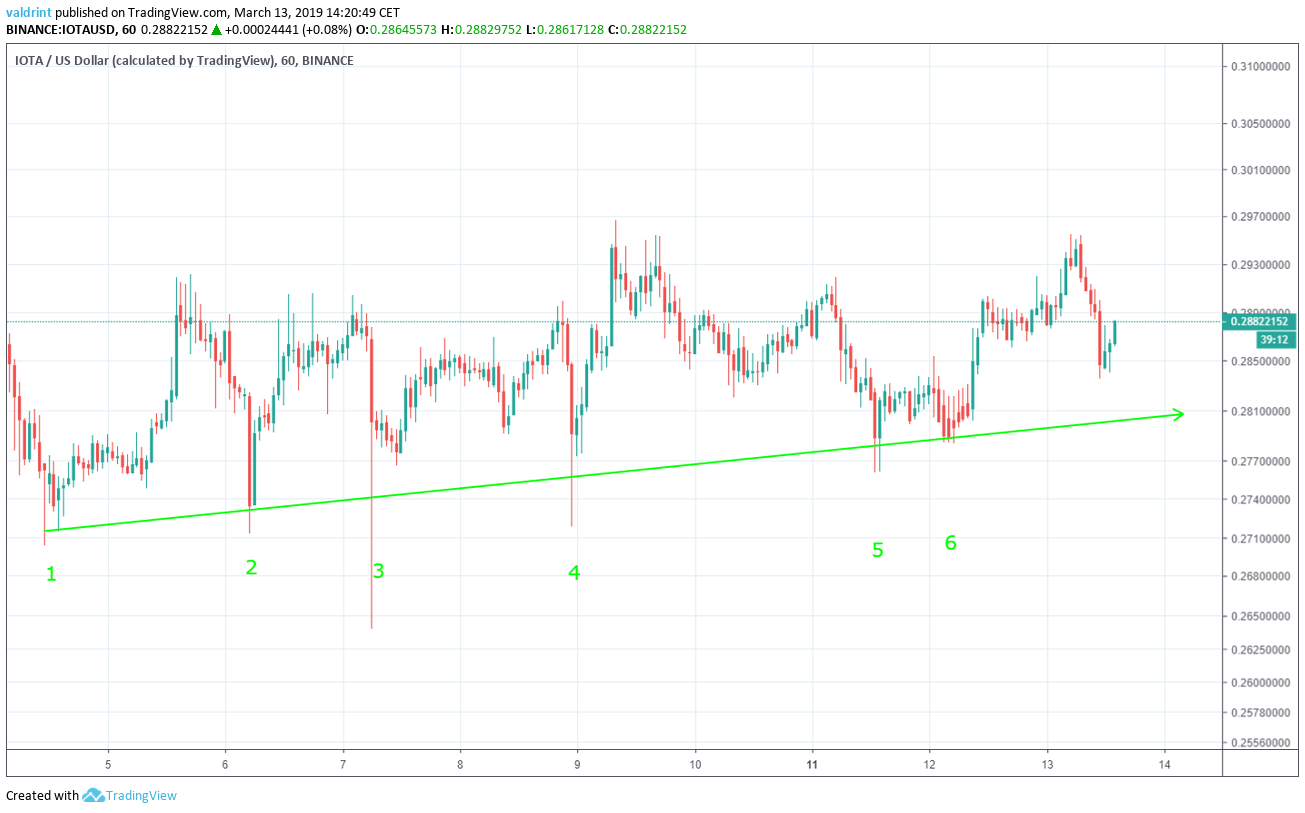
The support line can act as a floor to price—theoritically preventing further downward movement. It also projects the future rate of growth and most likely lower limits of price. In the case of IOTA, the price has increased at the same rate as predicted by the line.
Wick breakdowns such as the one on Mar 7 can be considered insignificant because they are not succeeded by a continuous decrease.
It is likely that the price will keep growing at a steady rate as predicted by the support line.
Ascending Triangle
On Mar 9, the price made a high of $0.296. It has revisited the same level three times. Tracing these highs gives us a horizontal resistance line.
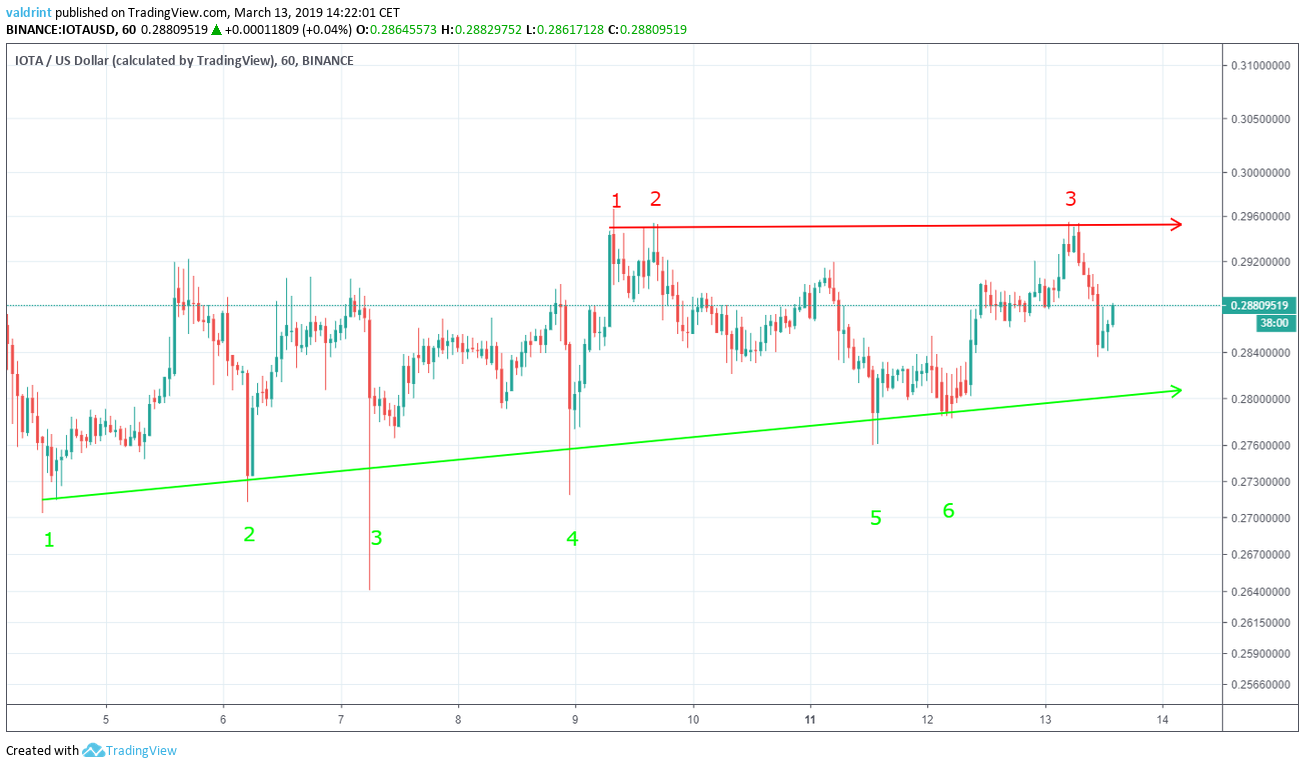
The resistance line can effectively act as a ceiling to price in the way support acts a floor. It also projects the upper limits of price for a given period based on historical price fluctuations.
The resistance and support lines combine to create an ascending triangle—a bullish pattern. This further confirms the projection of future price increases as indicated by the upward moving support.
It is likely that the price trades within the confines of the ascending triangle until a point of convergence between the resistance and support occurs. At the current rate of growth, IOTA will then break out of the resistance with continuing price increases.
Potential Breakout
Combining moving average convergence divergence (MACD) and relative strength index (RSI) bullish/bearish divergence with support/resistance essentially predicts price fluctuations.
The MACD is a trend indicator that shows the relationship between two moving averages (long and short-term) and the price. It is used to measure the strength of a move. The RSI is an indicator which calculates the size of the changes in price in order to determine oversold or overbought conditions in the market.
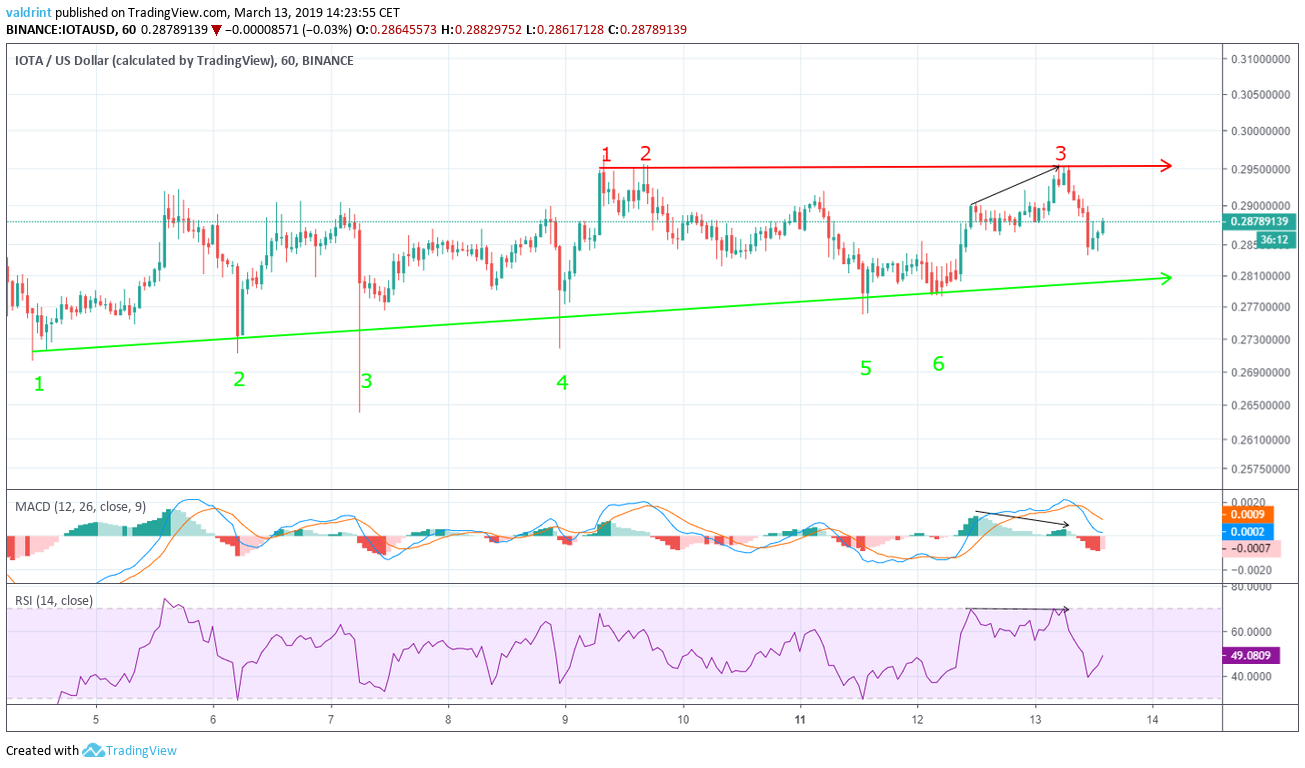
The price made a high of $0.291 on Mar 12. It continued to make a higher high on Mar 13.
Similarly, the MACD and RSI made the first high on Mar 12. However, the made lower/identical highs on Mar 13, respectively. This is called bearish divergence and often precedes price decreases.
A slight decrease has occurred since the divergence.
Using these indicators and the creation of a bullish pattern, it is likely that the price needs more consolidation inside the triangle, before ultimately breaking out. It is possible that the price touches the support line before making an upward move.
Future Movement
The price of IOTA (IOTA) on Binance is analyzed in four-hour intervals from Feb 7 to Mar 13.
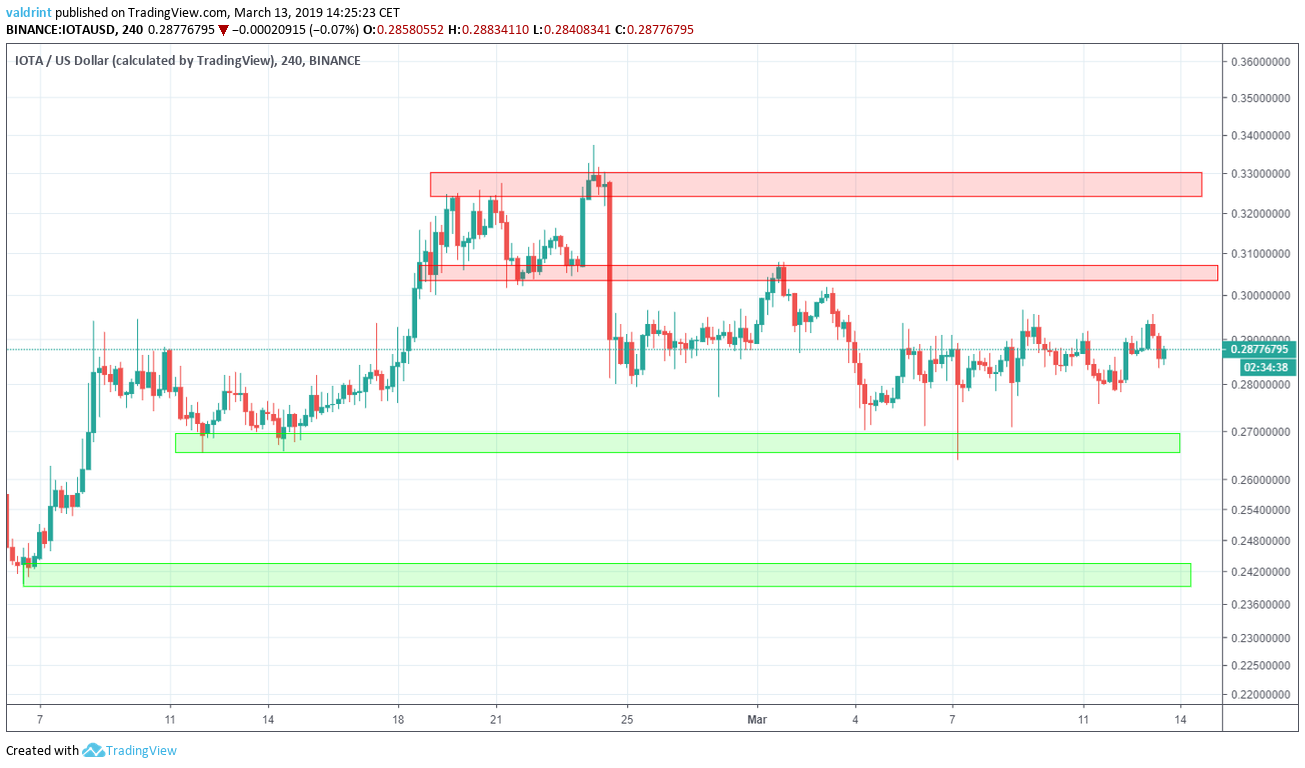
Resistance and support areas are formed when the price reaches a certain level several times. They can act as a ceiling/floor that prevents the price from moving further in that direction
The first resistance area is found between $0.3 and $0.31, followed by the second one near $0.33. If the price were to break out of the triangle, these would present likely reversal areas.
The closest support area is found near $0.269. The second one is found near $0.242. If the price were to break down from the triangle, these would provide likely reversal areas. According to our analysis, this scenario is unlikely.
Summary of Analysis
Based on this analysis, it is likely that the price of IOTA consolidates inside the triangle, before ultimately breaking out. If the price breaks out, the prediction will be partially validated. If it touches the support line and then breaks out, it will be fully validated. A breakdown below the support line would invalidate the prediction.
Disclaimer: This article is not trading advice and should not be construed as such. Always consult a trained financial professional before investing in cryptocurrencies, as the market is particularly volatile.


