


IOTA (MIOTA) and DASH (DASH) have both recently initiated upward moves and validated their respective resistance lines.
Furthermore, MIOTA has been trading near its resistance for several days. DASH, on the other hand, reached the resistance line earlier this week before experiencing slight price losses.

A breakout appears possible for both, but we must analyze the cryptocurrencies in more depth before we can draw any conclusion. We begin our analysis by looking at IOTA:
IOTA Reaches Resistance
MIOTA/USD reached a low of 4400 satoshis on Apr 26. A rapid upward move followed, and the price reached a high of 6244 satoshis on Apr 29.
Subsequently, the price began falling. It validated the support line on May 13 before pushing upward to the resistance line. The price has been decreasing since, trading inside the descending channel outlined below:
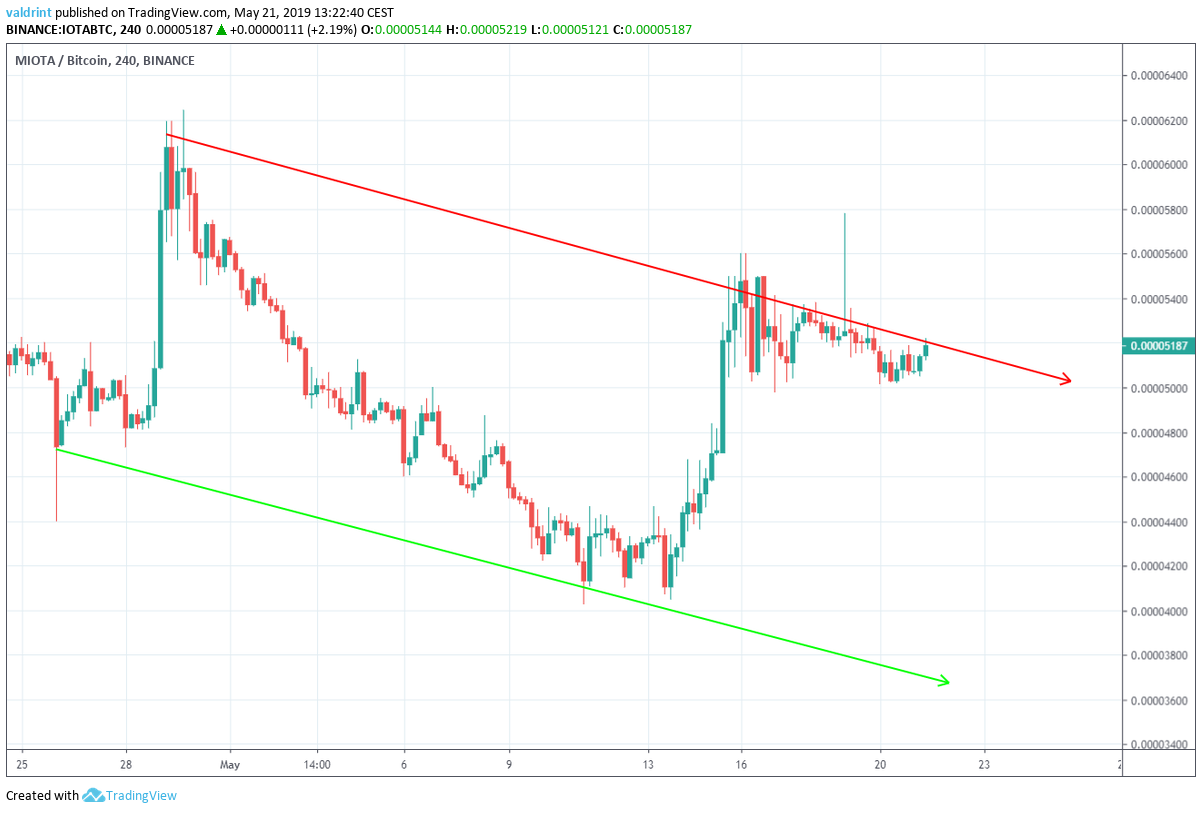
After reaching the resistance on May 15, it began trading sideways. Since that time, it has continued trading slightly below the resistance line. During this period, the line has been validated several times.
Possible Reversal
At the current time, MIOTA could drop toward the support line and possibly validate it. However, it could also begin increasing again and breakout from its current trading pattern. To determine which is more likely, the price of MIOTA is analyzed alongside the RSI and the MACD below:
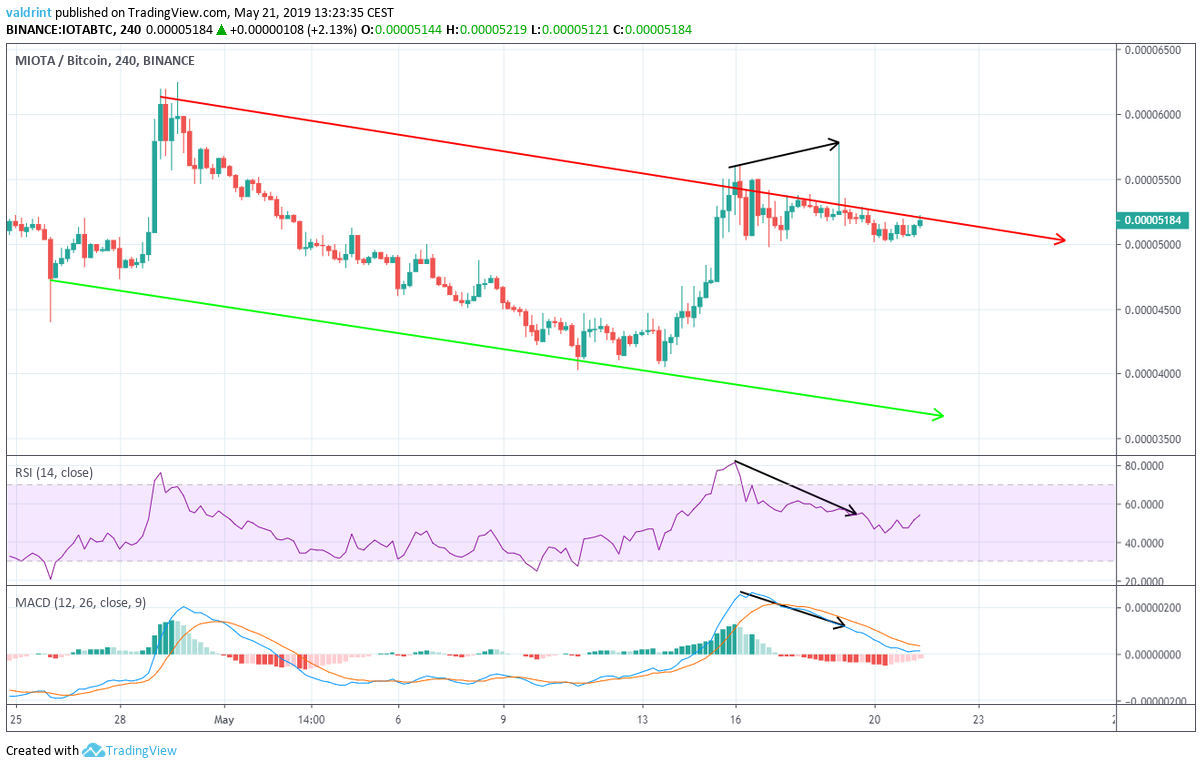
Between May 16 and 19, bearish divergence can be observed within the RSI and MACD. This suggests that price should likely decrease soon. A breakout does not appear likely.
DASH Inside An Ascending Channel
On May 4, the price of DASH reached a high of $130.36. A gradual decrease followed. the price reached a low of $111.11 on May 10.
Since then, the price has been increasing, trading inside the ascending channel outlined below:
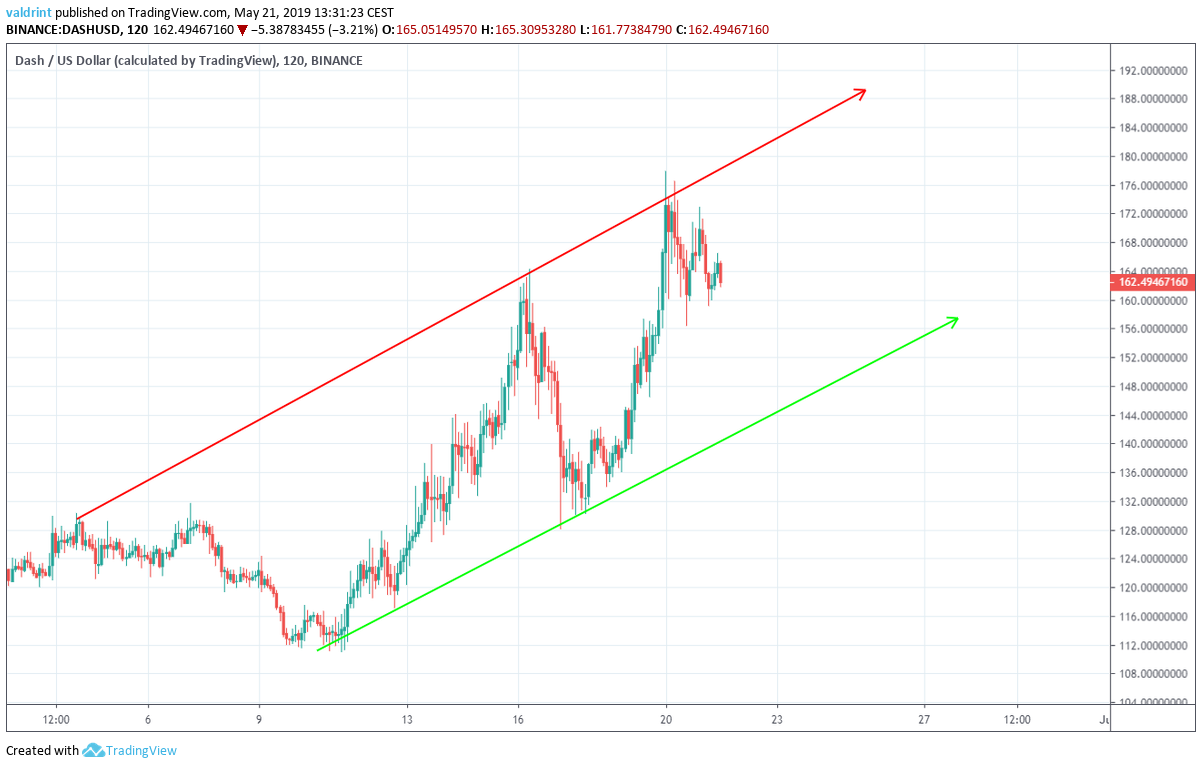
Unlike MIOTA, DASH dropped from the resistance line shortly after it was validated on May 16 and again on May 20.
However, DASH is still trading near the resistance line and appears poised for greater losses. Of course, a surprise rebound could lead to a breakout.
Has DASH Reached a Top?
To better determine what direction DASH will move in the near future, its price is analyzed at two-hour intervals alongside the RSI below:
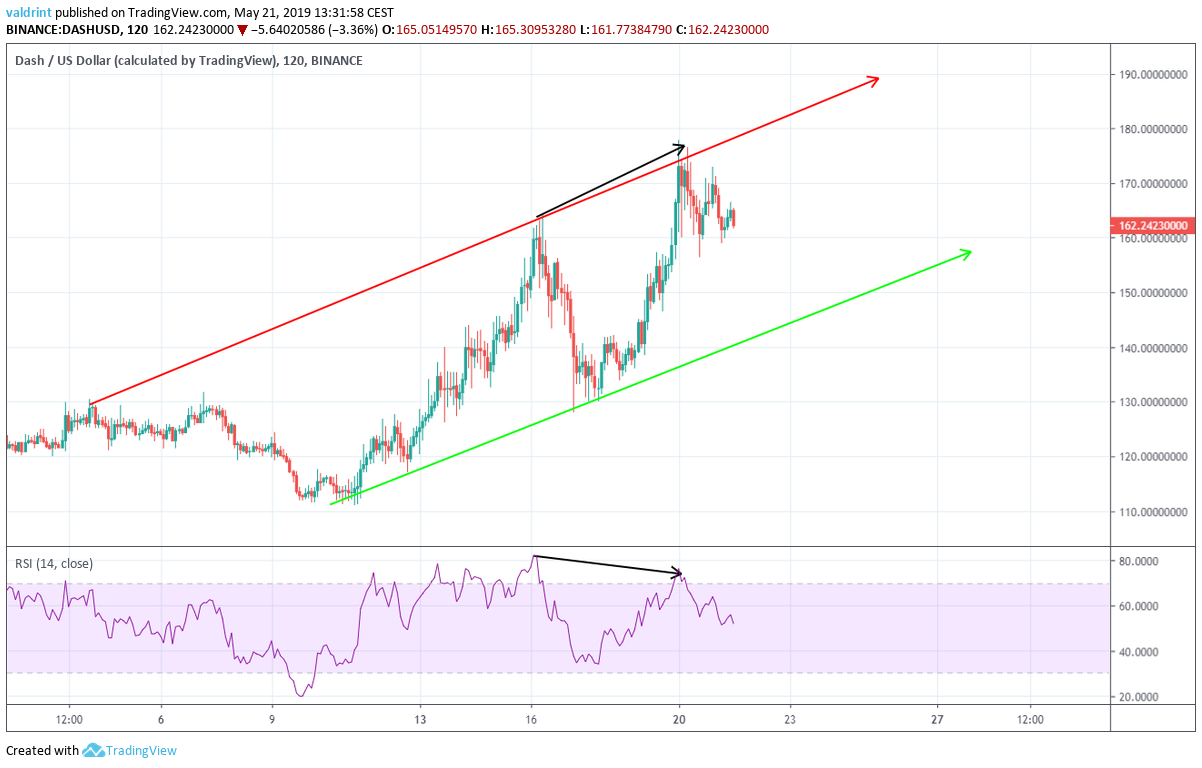
DASH is experiencing bearish divergence in the RSI during the same timeframe as MIOTA: May 16 -19. This suggests that DASH not yet completed its downward movement.
It is likely to continue falling like MIOTA. Though neither may reach their respective support lines in the immediate future, we expect that they will head in that direction.
Conclusion
To conclude, both DASH and MIOTA are trading near the resistance lines of neutral patterns. Furthermore, they both have generated bearish divergence within the RSI. Bearish divergence had also developed in the MASD for MIOTA.
It is worth noting that Bitcoin (BTC) and many altcoins including Stellar (XLM) also recently generated bearish divergence.
Therefore, we believe that both DASH and IOTA will decrease towards the support lines in their patterns.
A summary of our findings is presented in the table below:
| IOTA | DASH | Winner |
| Descending Channel | Ascending Channel | Tie |
| Bearish Divergence In The RSI And The MACD | Bearish Divergence In The RSI | Tie |
Do you think IOTA and DASH will reach their respective support lines? Let us know your thoughts in the comments below!
Disclaimer: This article is not trading advice and should not be construed as such. Always consult a trained financial professional before investing in cryptocurrencies, as the market is particularly volatile.


