


The IOTA (IOTA) price is trading inside a long-term resistance area, a breakout above which could trigger a rapid increase.
However, the price has fallen into a bearish pattern, and technical indicators are showing weakness, making a rejection much more likely.
IOTA Faces Resistance
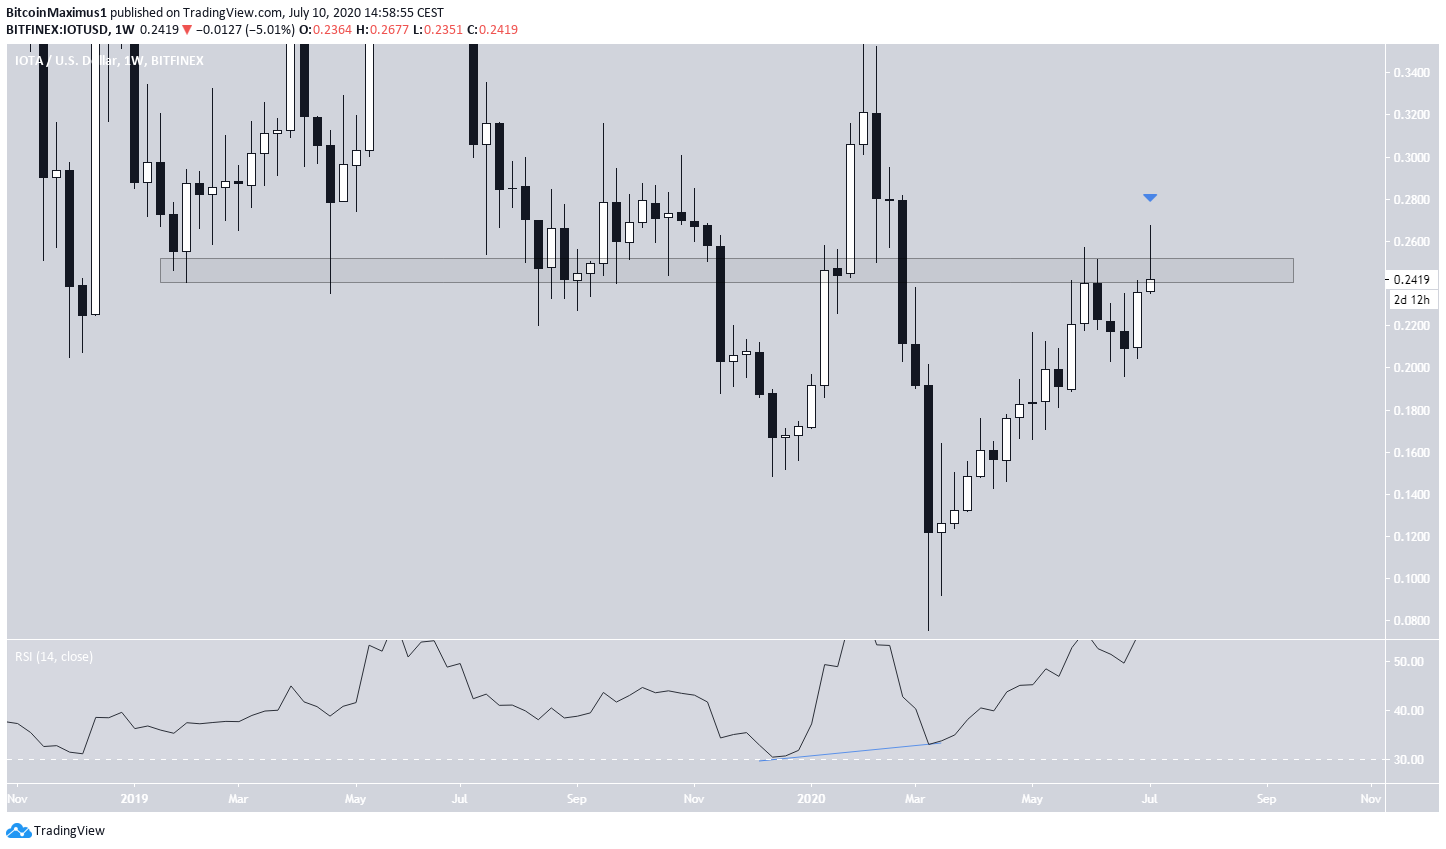
The IOTA price is currently trading inside the $0.245 resistance area. This area is extremely important since it acted as support for the majority of 2019 before the price eventually broke down. Therefore, an increase above this level could cause the continuation of the current upward move at an accelerated pace.
Before beginning the current upward movement, IOTA generated some bullish divergence in the weekly RSI.
However, the current weekly candlestick is shaping up to be a shooting star, as the long upper-wick pierced this resistance area. If the price fails to close above, it could be a strong sign that the upward trend has already ended and IOTA has begun a correction.
Cryptocurrency trader @BitBitcrypto stated that he has entered a long position on IOTA near the current level. However, due to the fact that the price is trading inside resistance, this seems like a questionable decision.
Evening Star Pattern
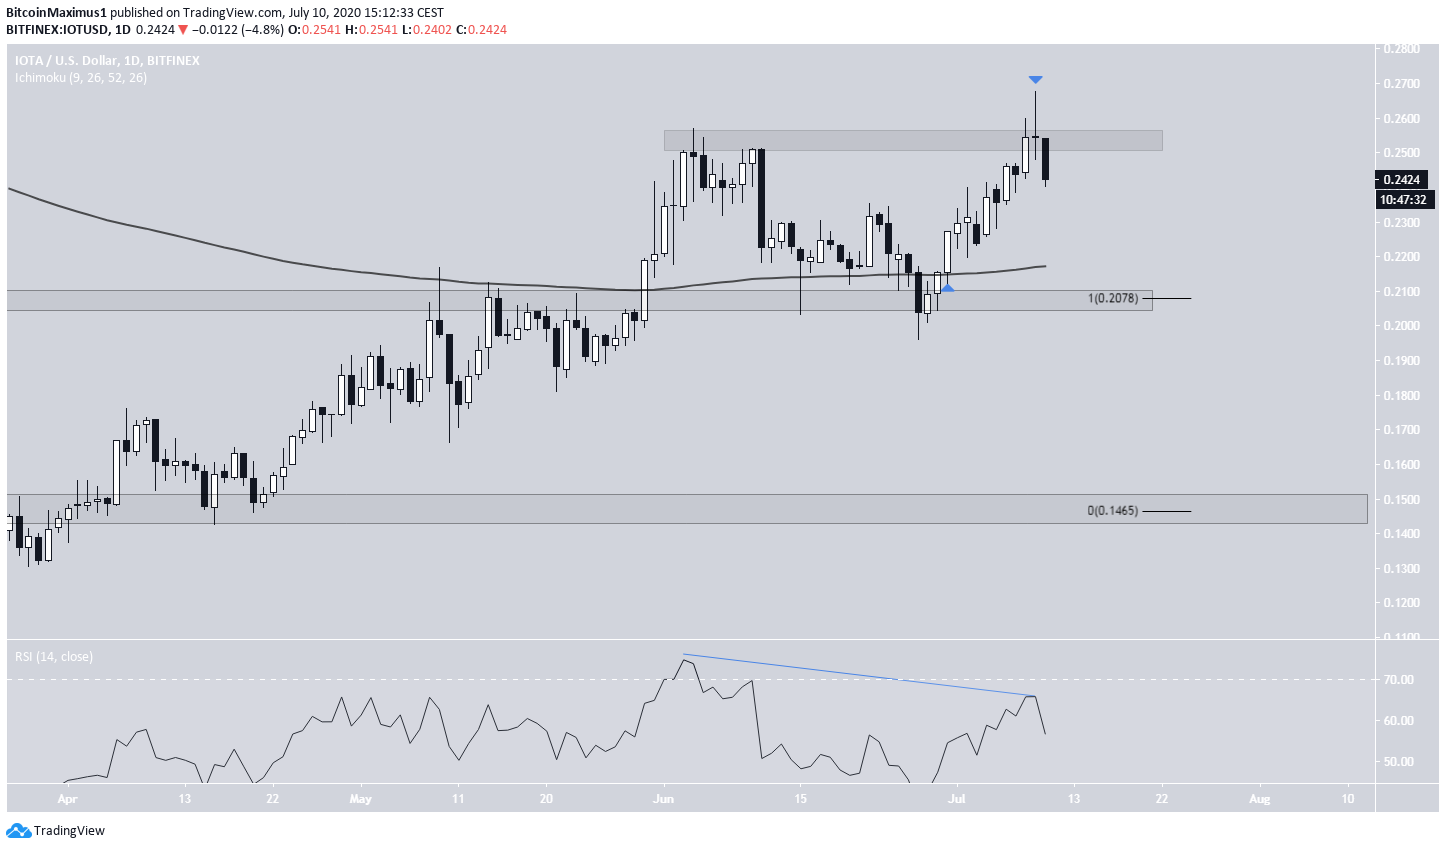
The daily chart looks even more bearish. The price has created a double-top pattern, which is combined with bearish divergence. Furthermore, the second bottom has taken the form of an evening star pattern, which is another bearish pattern in itself.
While the price is still trading above its 200-day moving average (MA), a decrease below it could trigger a rapid downward movement, with a possible bounce at $0.21. If the price decreases the entire height of the pattern, it could drop all the way to $0.145.
Finally, the hourly chart shows that an ascending support line that had been in place since May 28 has just been broken. This fits with the longer-term analysis, confirming that a downward move is most likely.
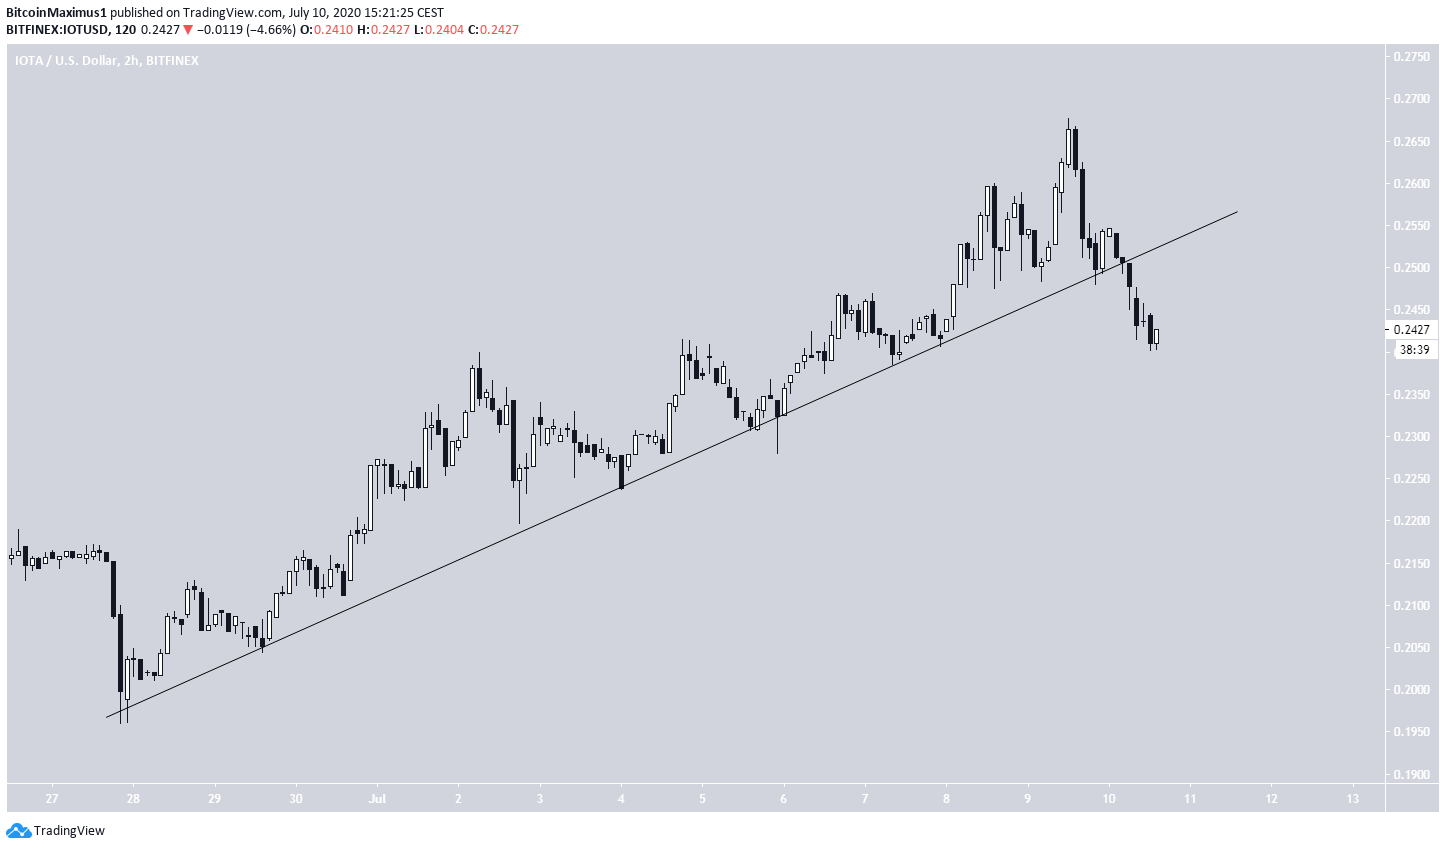
To conclude, unless the IOTA price manages to reach a weekly close above $0.25. then the chances are high that the bullish move has already ended and the price may see a significant correction.


