


While the Injective (INJ) price was rejected by a crucial resistance area last week, it has regained its footing and is gearing up for another breakout attempt.
There is a confluence of diagonal and horizontal resistance levels at $10.40. Therefore, the reaction of the price if it gets there will be crucial in determining the future trend.
Price Makes Another Attempt at Breaking Out
Since the start of the year, the INJ price has gone up. In January, the price broke through a long-term resistance line. In March, it tested and confirmed it as support, resulting in a long lower wick (green icon).
Lower wicks are usually interpreted as a bullish sign as they imply that buyers were able to prevent the price from falling, causing it to close higher than at the start of the week.
Since then, the price has risen and is now approaching the $10.40 resistance level. This resistance is created by a combination of a horizontal resistance area and the 0.382 Fib retracement resistance.
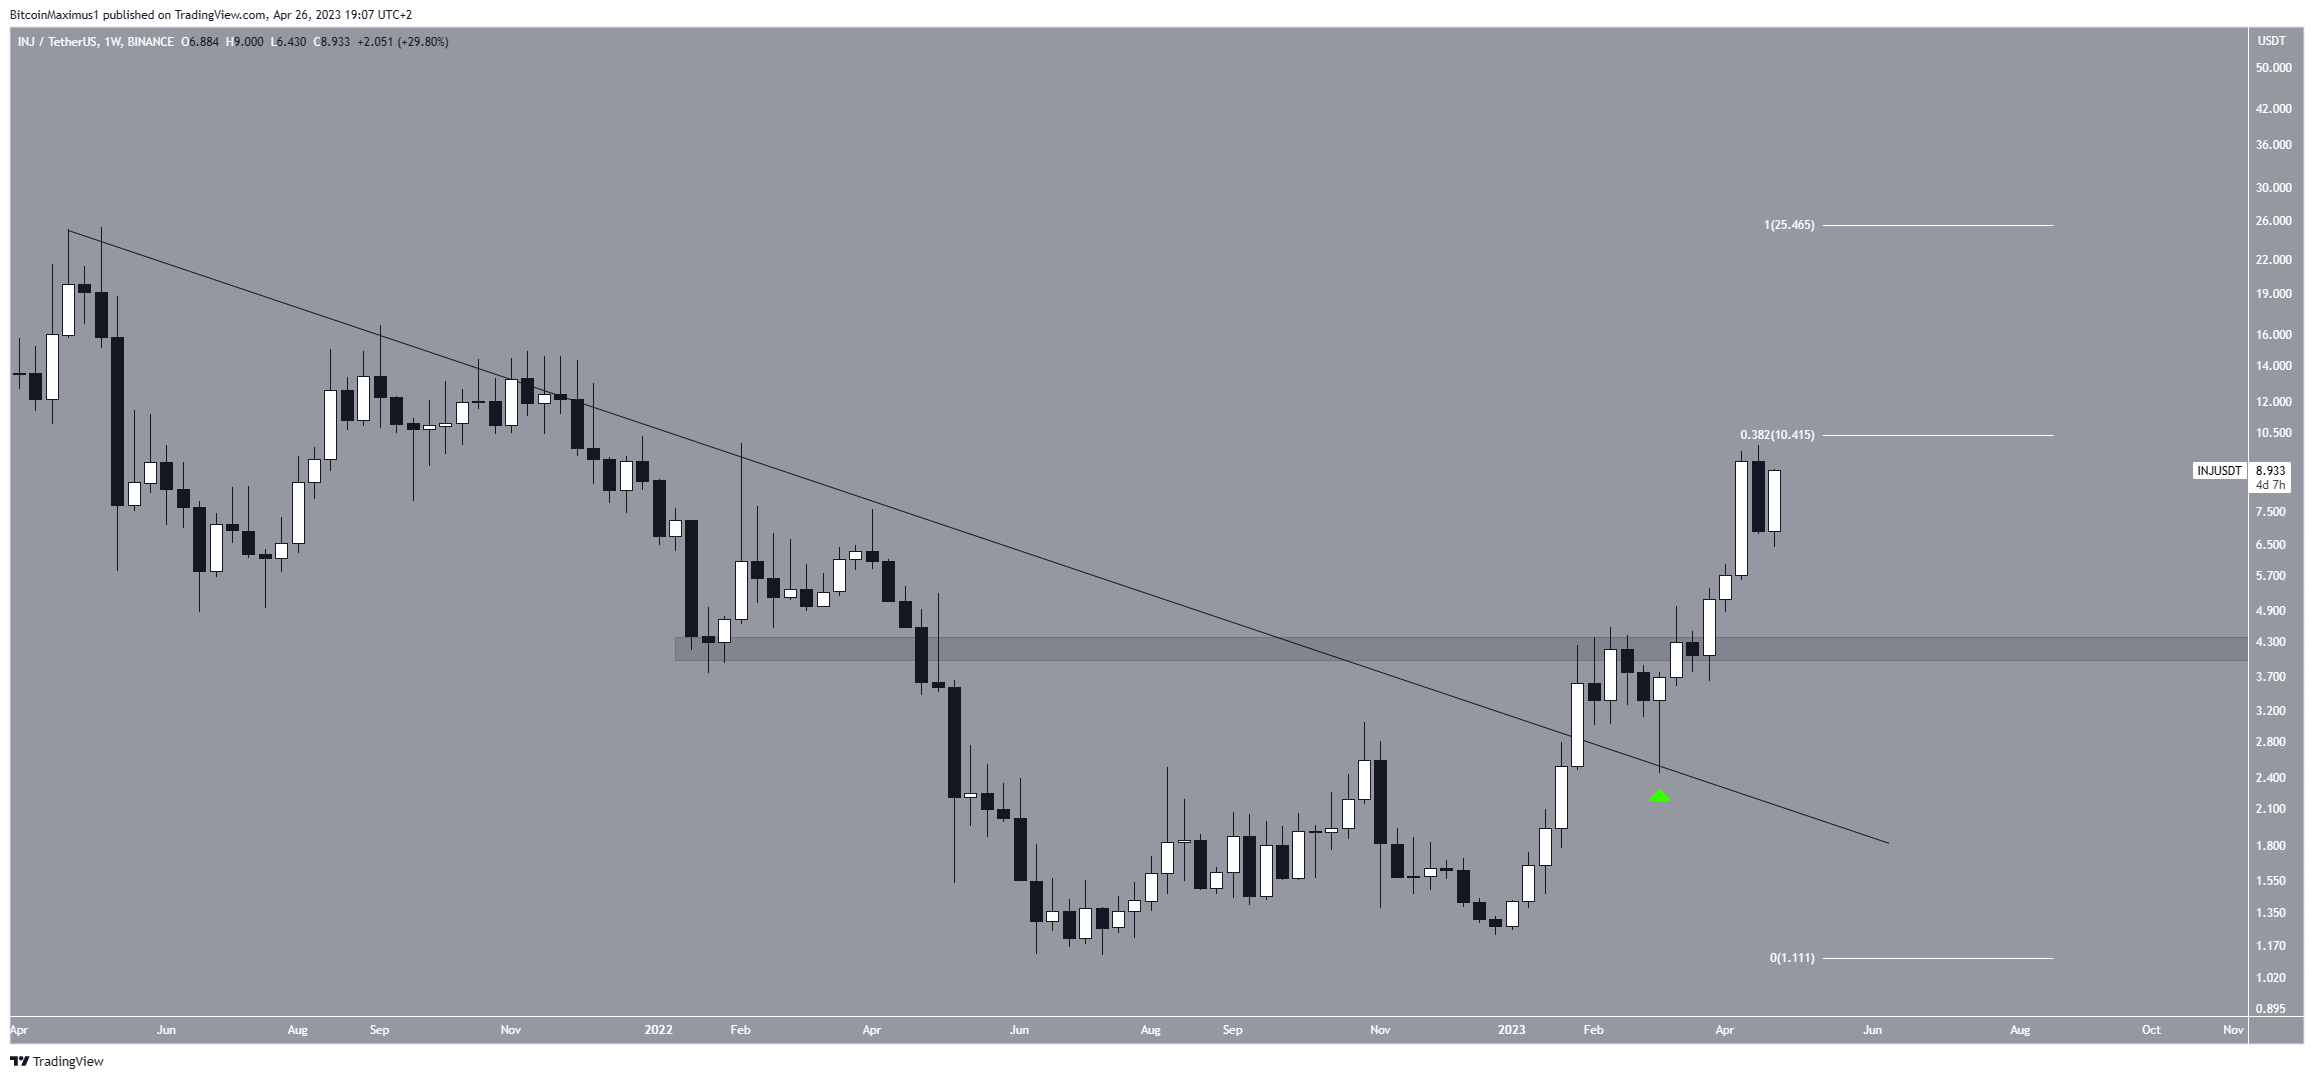
Fibonacci retracement levels help determine that after a price moves in one direction, it will retrace towards a prior price level before continuing in the original direction.
Whether INJ manages to break through or is rejected at this level could have an impact on the future trend.
Injective Price Prediction: Breakout or Collapse?
The INJ token’s price has been moving within an ascending parallel channel since the beginning of the year, according to technical analysis of the daily time frame. Such channels typically have well-established support and resistance lines that are frequently validated.
In this case, the resistance line of the channel corresponds with a previously identified resistance area of $10.40. Whether the price breaks through this level or gets turned away will be crucial in determining the future trend.
The fact that the price is trading in the upper portion of the channel and bounced at the channel’s midline (green icon) are both signs of a bullish trend.
Furthermore, the daily Relative Strength Index (RSI) is indicating a neutral outlook. The RSI is a momentum indicator that evaluates oversold or overbought conditions. A reading above 50 and an upward trend indicate strength on the part of the bulls. The indicator broke down below the 70 level (red icon), which is a bearish indication.
But, it then bounced at the 50 level and is now increasing, a sign of a bullish trend.
Based on the above indicators, it can be determined that the nearest support area is at $4.20, while the next resistance is at an average price of $24.
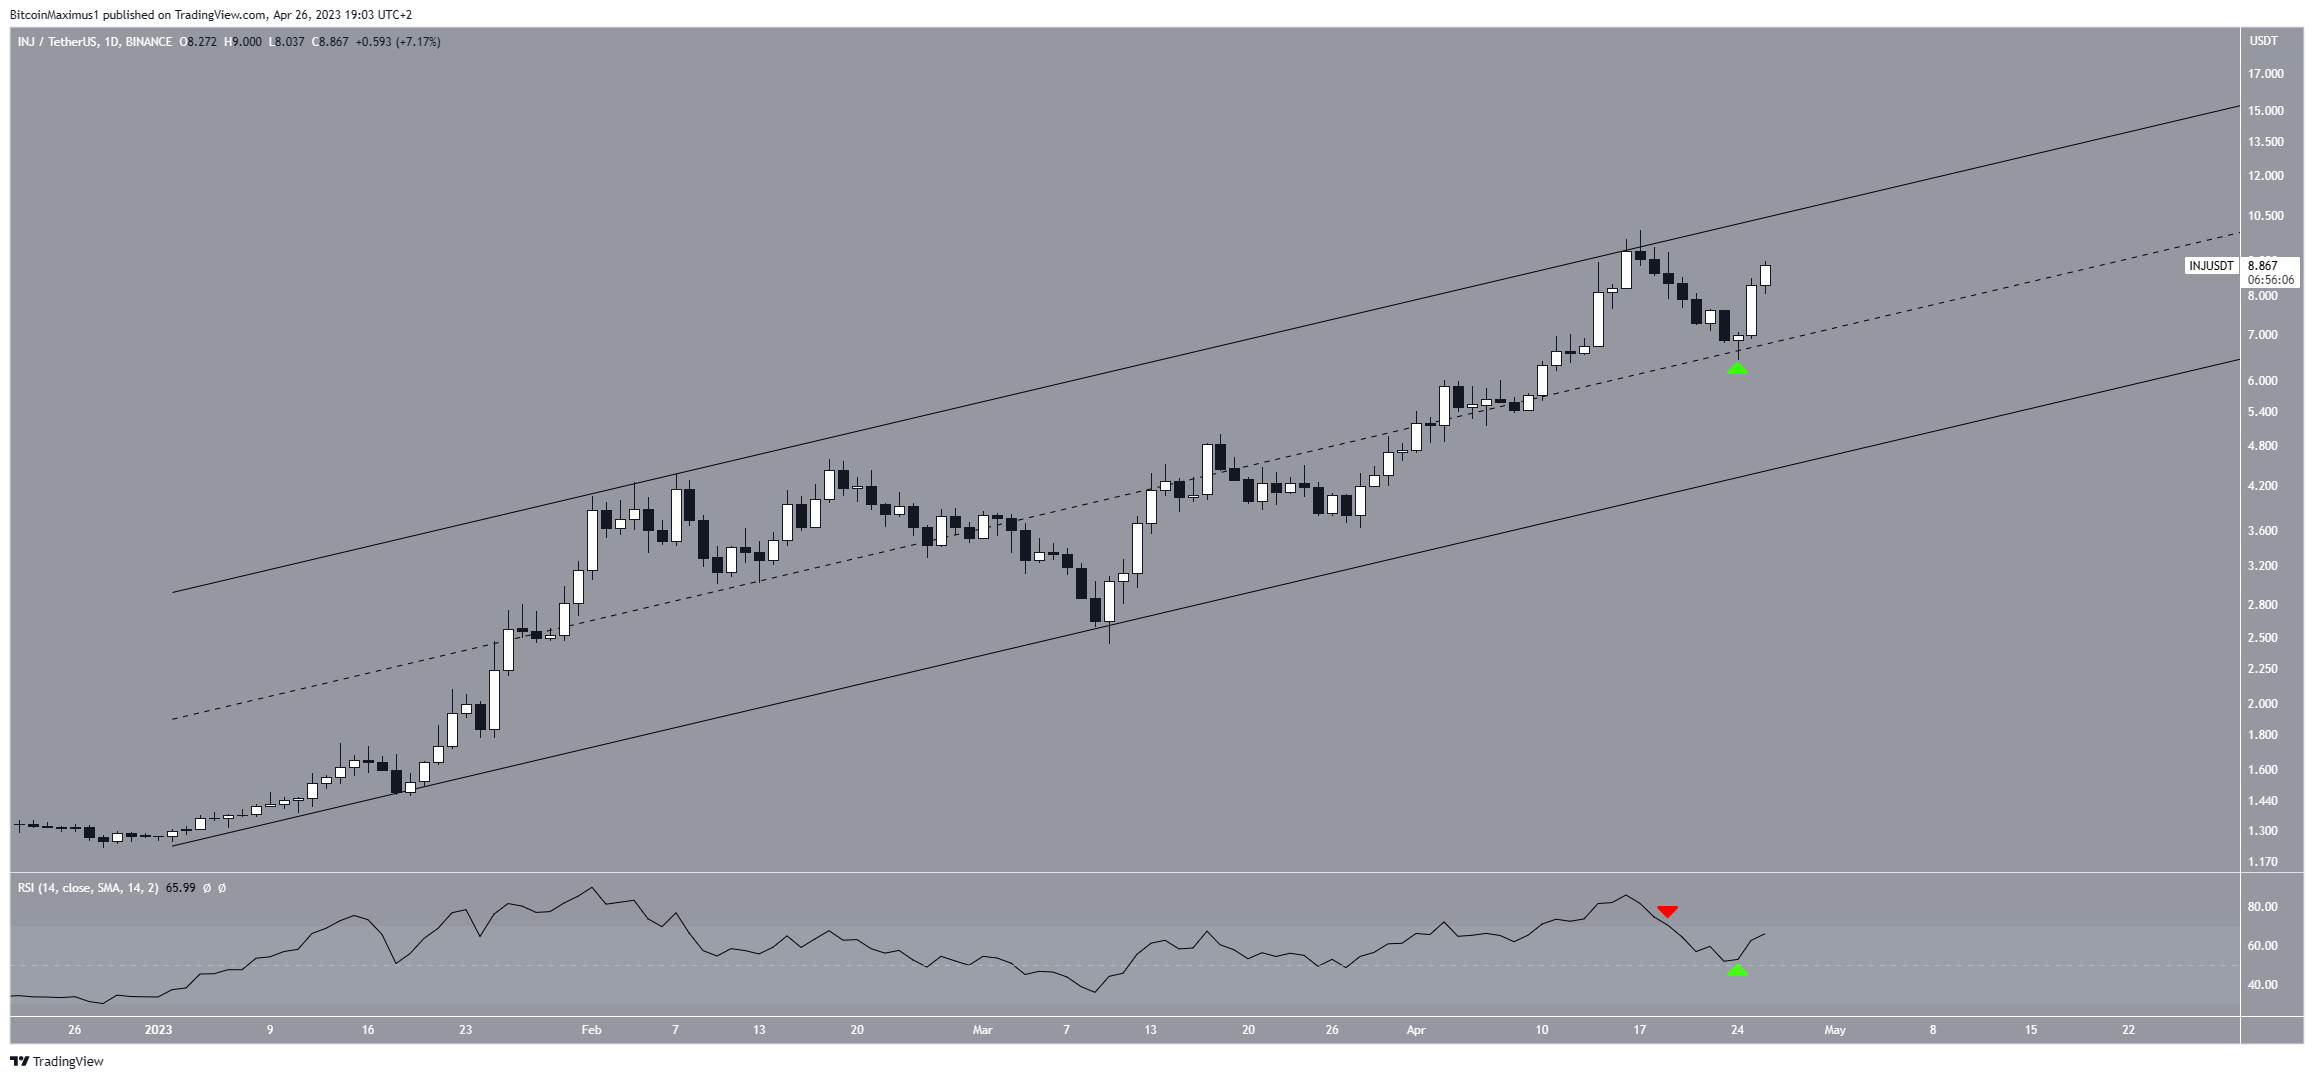
The future price prediction for INJ will depend on whether it breaks out from the channel and the $10.40 resistance area or goes below the midline of the channel.
If it breaks out, the most probable scenario would be a rise toward $24. On the other hand, if it falls below the midline, the price might break down from the channel and fall to $4.20.
For BeInCrypto’s latest crypto market analysis, click here.


