
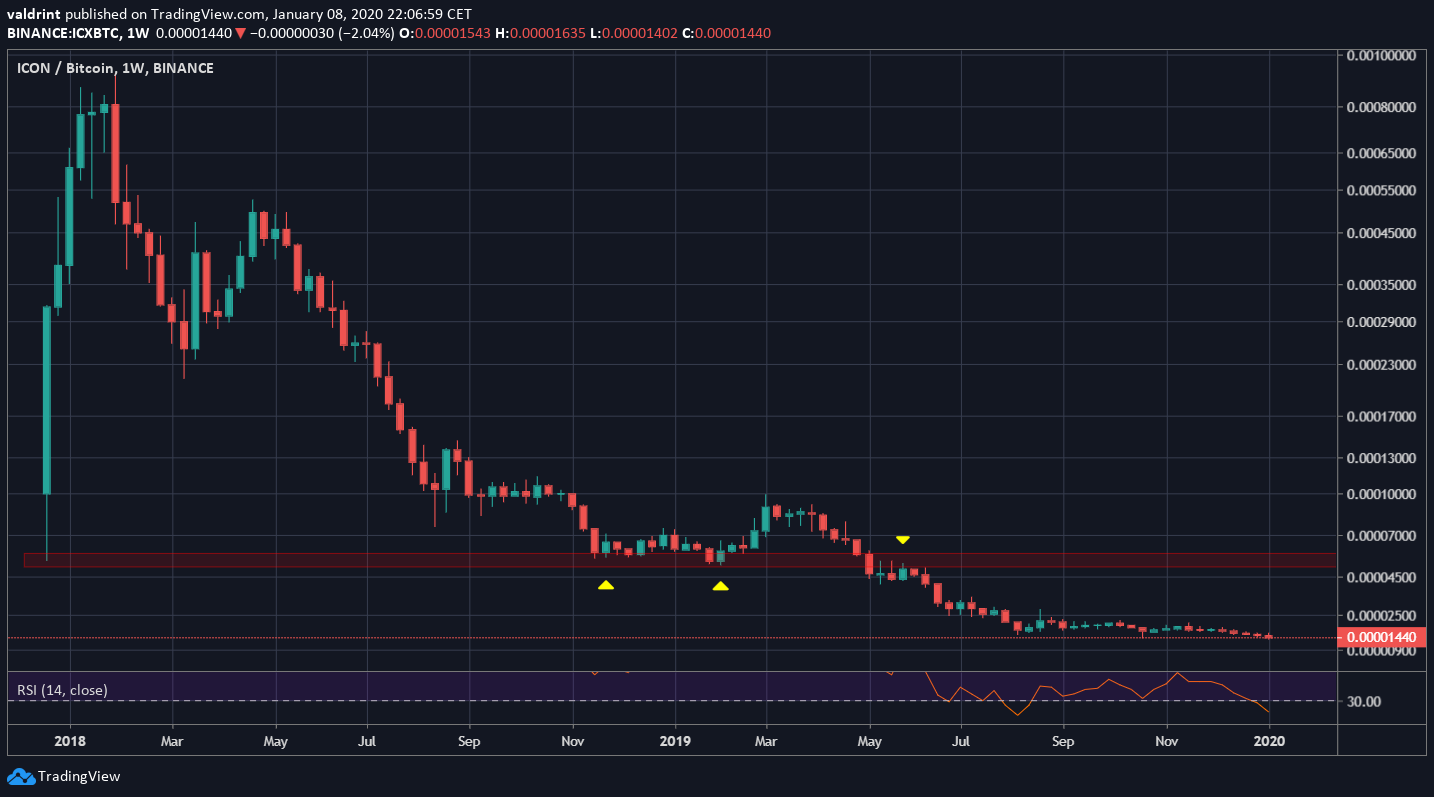
The ICX price has been creating new all-time lows since May of 2019. While it initially found support at 1,700 satoshis, the price broke down once again in December and has been decreasing rapidly since.
However, the price is may just be in the process of creating a bullish long-term pattern, the support line of which could halt the decrease and assist the price in creating a bottom.
Full-time trader @CryptoMichNL outlined the ICX price chart and highlighted the bearish engulfing candlestick that was created near the previous breakdown level. The failed retest of this level indicates that the price is heading lower.
Sad story here. Damn. Haha. pic.twitter.com/sKzJaDkPKA
— Michaël van de Poppe (@CryptoMichNL) January 7, 2020
ICX Sinks to New Lows
The ICX price broke down below the 5,500 satoshi support level in May 2019 and has been making successive all-time lows since. The price movement has become less volatile and the has been trending between 1,300 and 2,500 satoshis since August.
While the weekly RSI is oversold, there is no bullish divergence yet to suggest that a reversal might ensue.
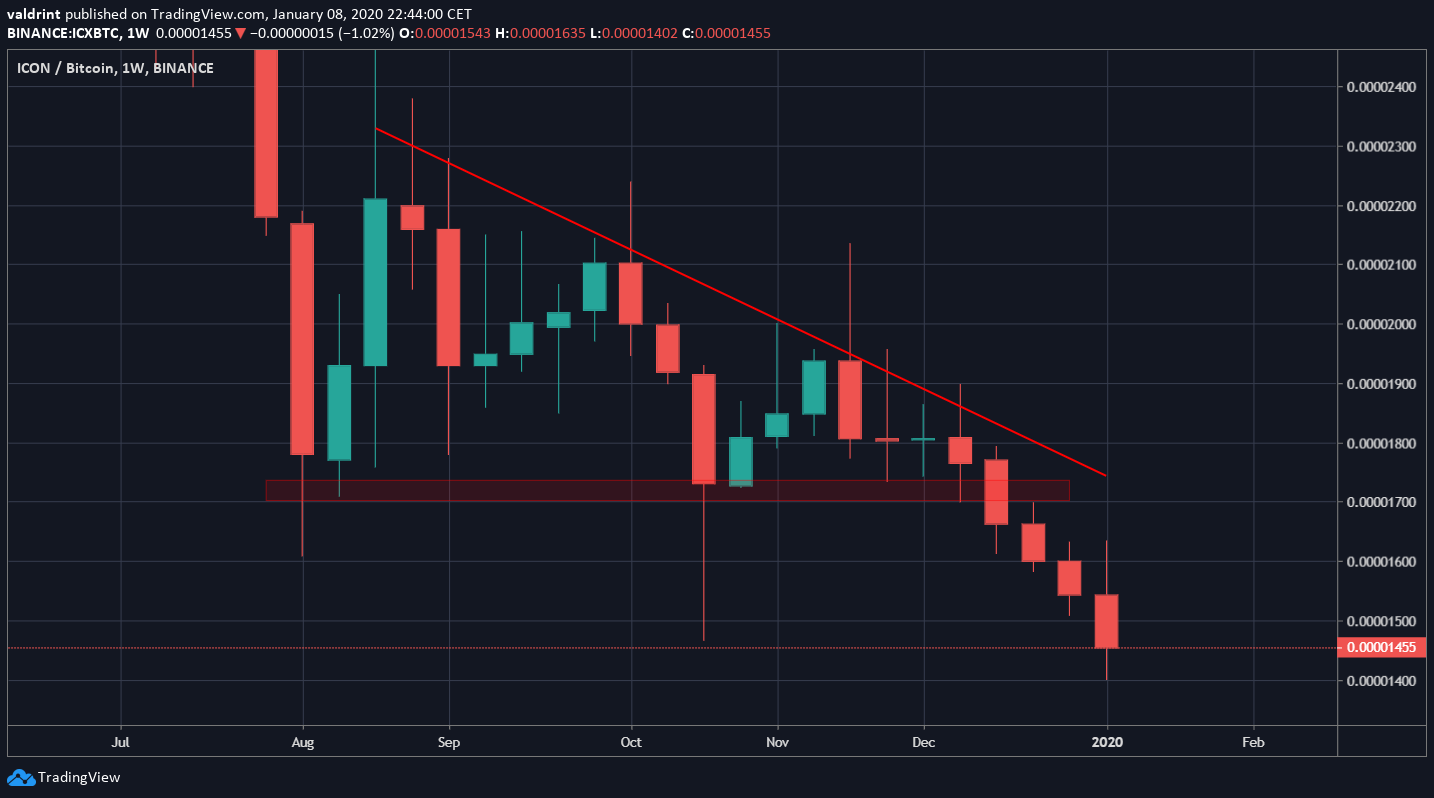
Discounting the lower wicks, we can see that the price broke down from what seems like a descending triangle with a support line at 17,000 satoshis in December 2019.
In addition, we can see that the current lower wick has created a new all-time low. In these cases, the price often enters the price discovery phase and could accelerate its rate of decrease.
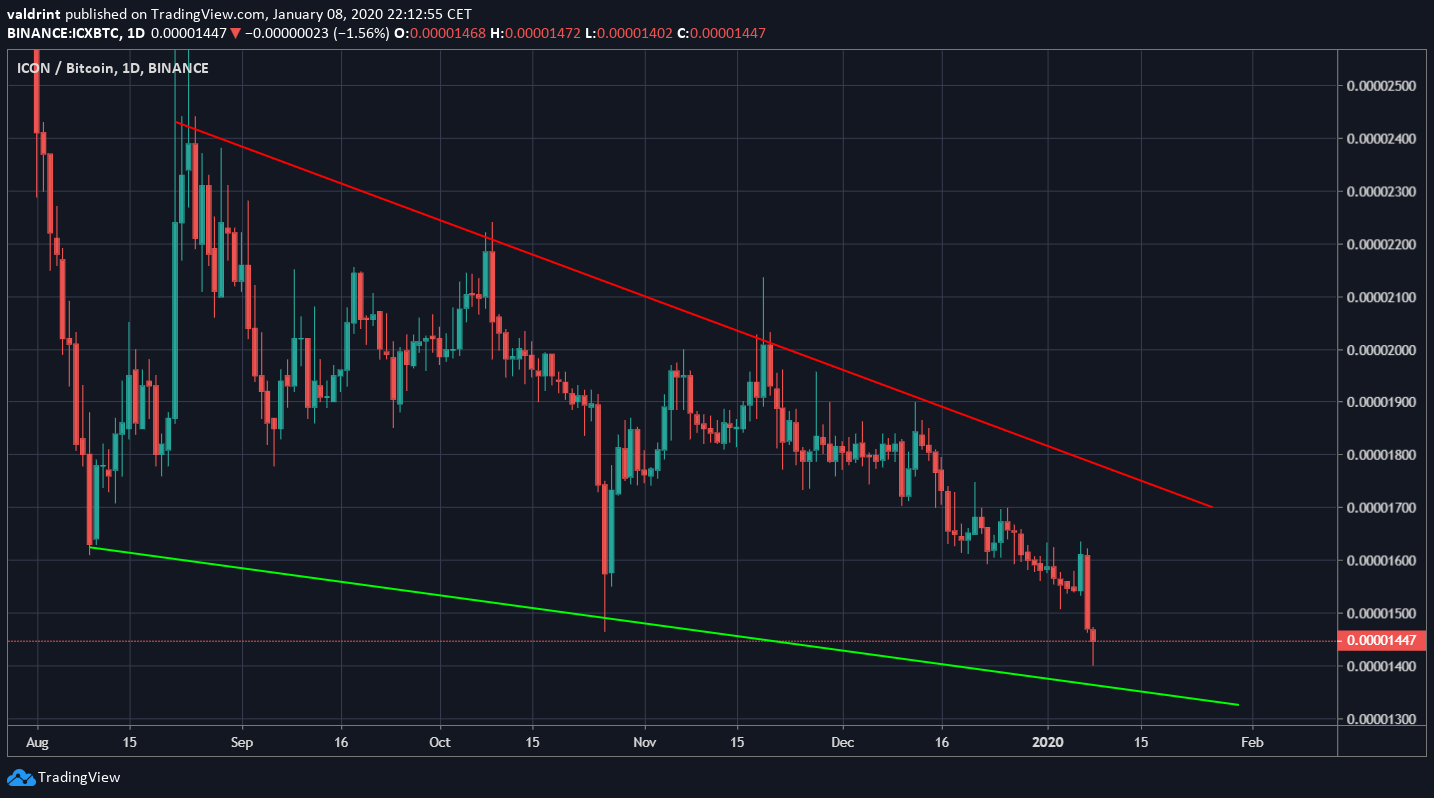
Descending Wedge
The ICX price has been trading inside a descending wedge since Aug 9. The wedge is a bullish pattern, usually ones that lead to a breakout.
While the resistance line is clear and validated several times, the support line is not and has only been validated twice. Due to the presence of long lower wicks, the slope of the descending support line could be different.
To conclude, the ICX price has been making successive all-time lows since May 2019. While the price has created a bullish pattern, the lack of precision on the pattern and the absence of reversal signs make it impossible to safely enter the trade. Until the price creates a clear trading structure, our recommendation is to not enter any trading positions.
