


![Will ICON (ICX) Break out From Its Long-Term Downward Trend? [Premium Analysis]](/_mfes/post/_next/image/?url=https%3A%2F%2Fassets.beincrypto.com%2Fimg%2F3lynknDVICVF0czMkP0ImgKlAwQ%3D%2Fsmart%2F0a47372325204722bc5ff0eb19cec59f&w=1920&q=75)
The ICON (ICX) price is nearing the end of its bullish pattern that has been in place since June 2019. A breakout could take it to a high of $0.31. The closest resistance area is found at $0.18.
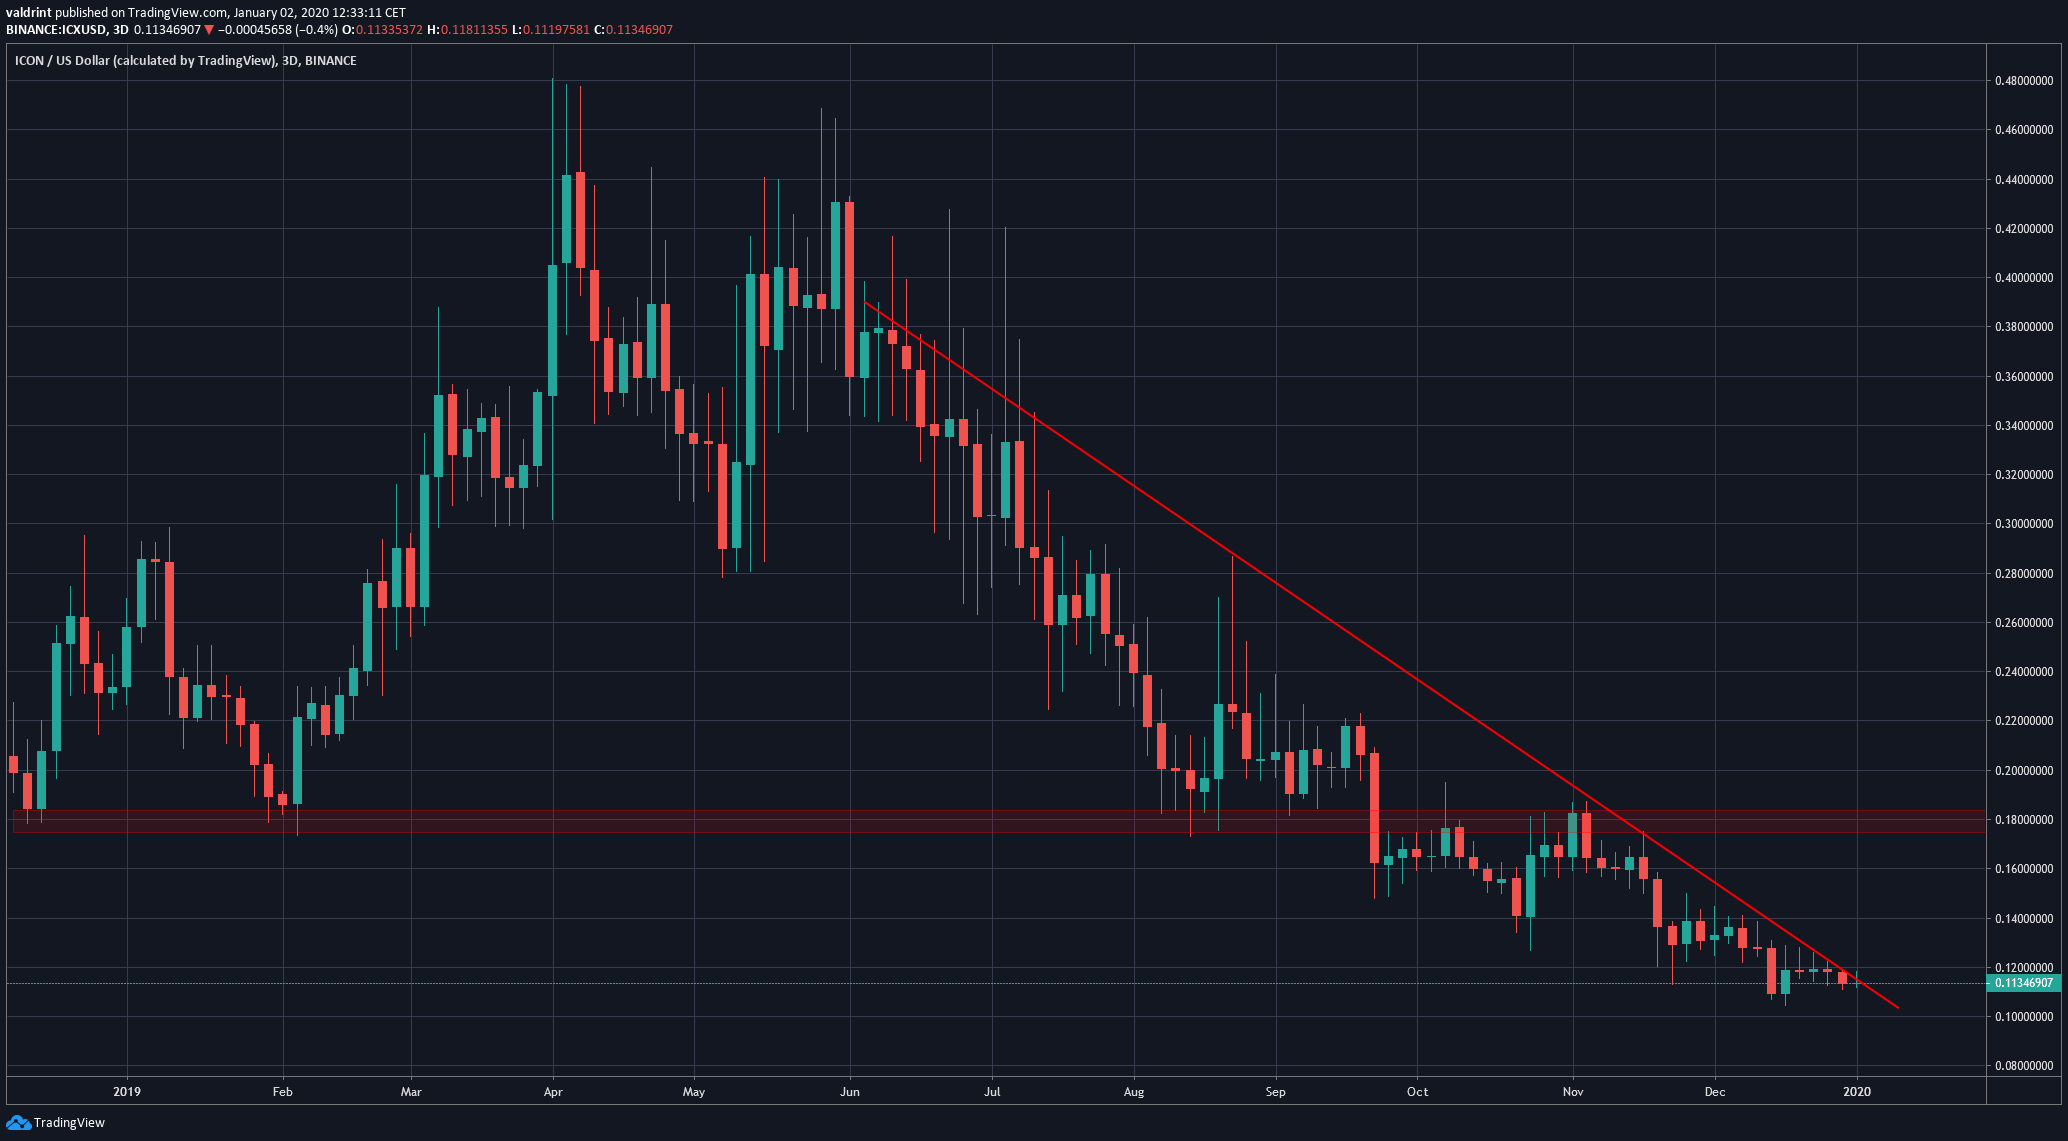
The ICX price has been decreasing since reaching a high of $0.48 on April 3. While it has been following a descending resistance line, the rate of decrease has diminished lately — making it possible that the price is gearing up for a breakout.
Trader @CryptoMichNL stated that the ICX price will likely begin an upward move once the two-year-long downtrend comes to an end. Additionally, he added that very similar patterns have been created in the XRP and ETH prices.
The fun starts when this downtrend breaks.
Similar to 2-year long downtrends on $XRP and $ETH. pic.twitter.com/OpFV0HfPD4
— Michaël van de Poppe (@CryptoMichNL) January 2, 2020
Will ICX break out above this long-term descending resistance line? If so, how long will it continue to increase? Keep reading below if you are interested in finding out.
Long-Term Downtrend
The most significant price level that has reacted to the ICX price numerous times is found at $0.18. The area acted as support throughout 2019 before the price broke down in late September and validated it afterward as resistance in November.
When using a non-logarithmic chart, the descending resistance line has been in place since June 2019. Currently, the price is in the process of breaking out above it. If so, the price will likely find resistance again at $0.18.
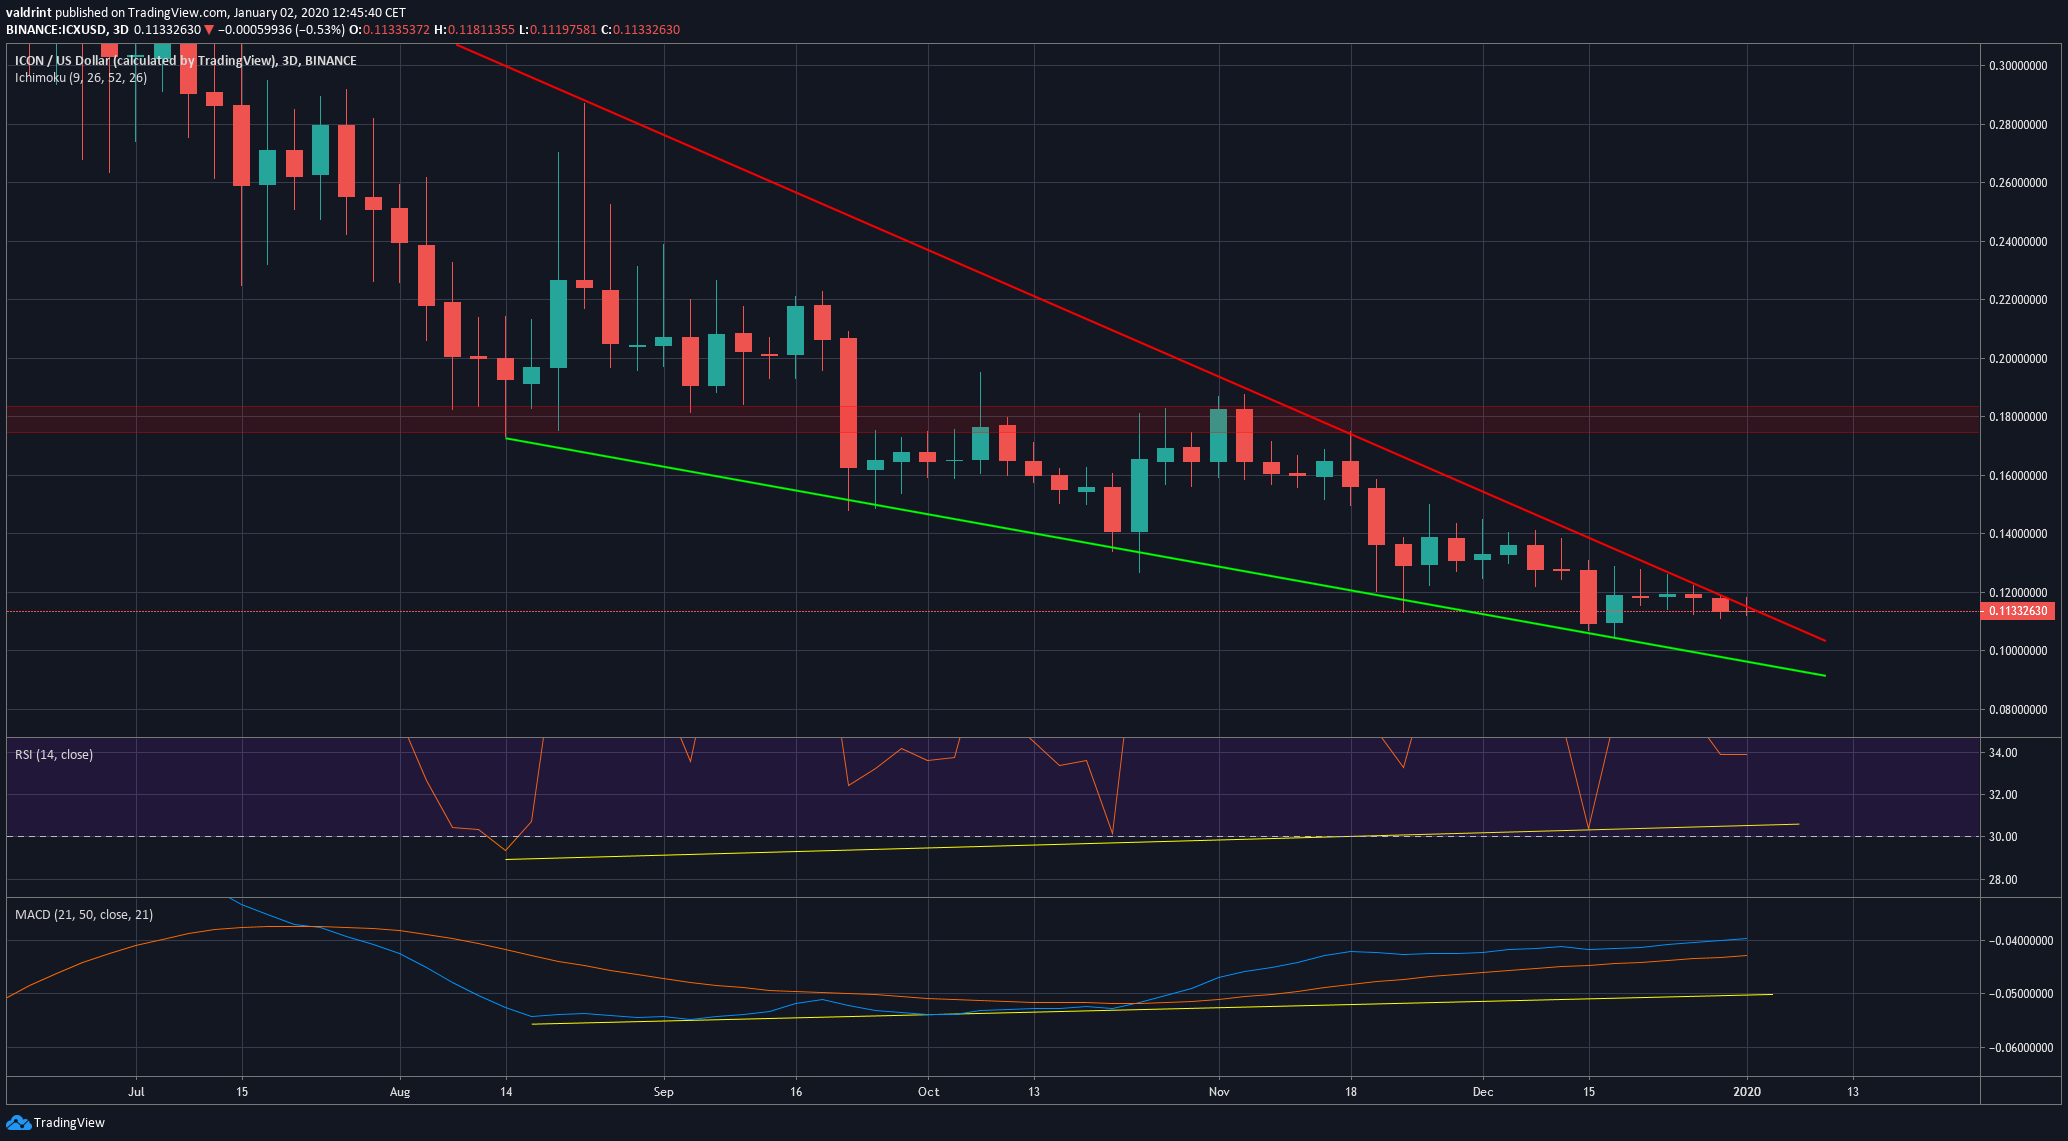
Long-term technical indicators support a breakout above this descending resistance line. First, the ICON price has been following a descending support line since August — which combined with the downtrend line creates a descending wedge, which is a bullish pattern.
Also, both the RSI and MACD have been generated a bullish divergence for the entire duration of the wedge, visible up to the weekly time-frame.
While the price is at an all-time low, making it hard to predict a bottom, the descending support line limits the scope of the possible decrease. Since a breakdown below it would greatly accelerate the rate of decrease, placing a stop loss below the trend-line would be recommended.
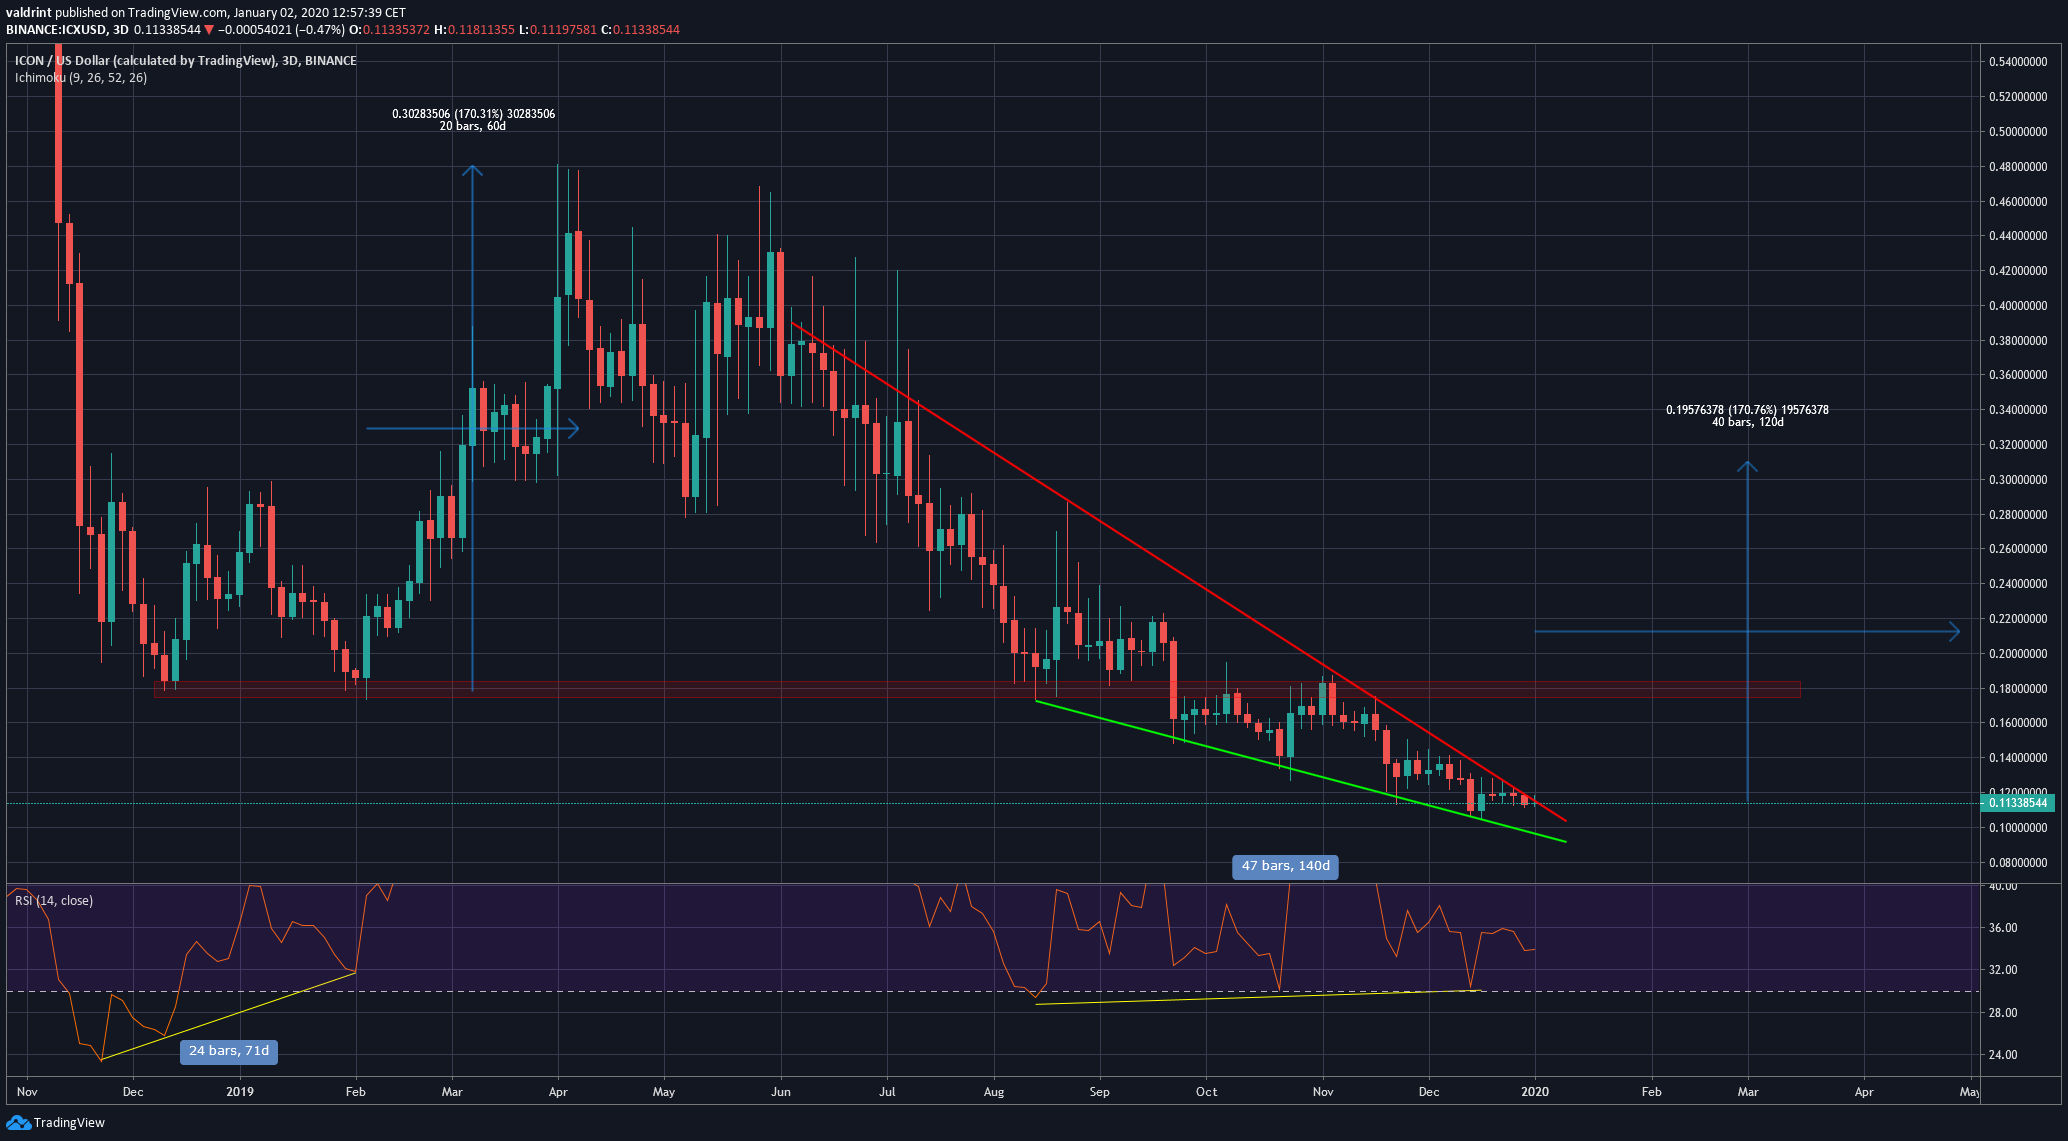
As for the possible target of this upward move, there is a previous RSI pattern that could be helpful in determining its magnitude.
The three-day RSI has only been oversold once before, which has also been the only time it has generated bullish divergence. What ensued afterward was an upward move with a 170 percent magnitude that transpired over 60 days. The second time around, the divergence has transpired over a period of time twice as long.
If the upward move takes twice as long to materialize, the price will reach a high at the end of April 2020. A 170 percent increase would take the price to $0.31. However, since the divergence has been generating for a longer period, we could see a stronger move that takes us to revisit the 2019 highs near $0.48.
Ethereum and XRP
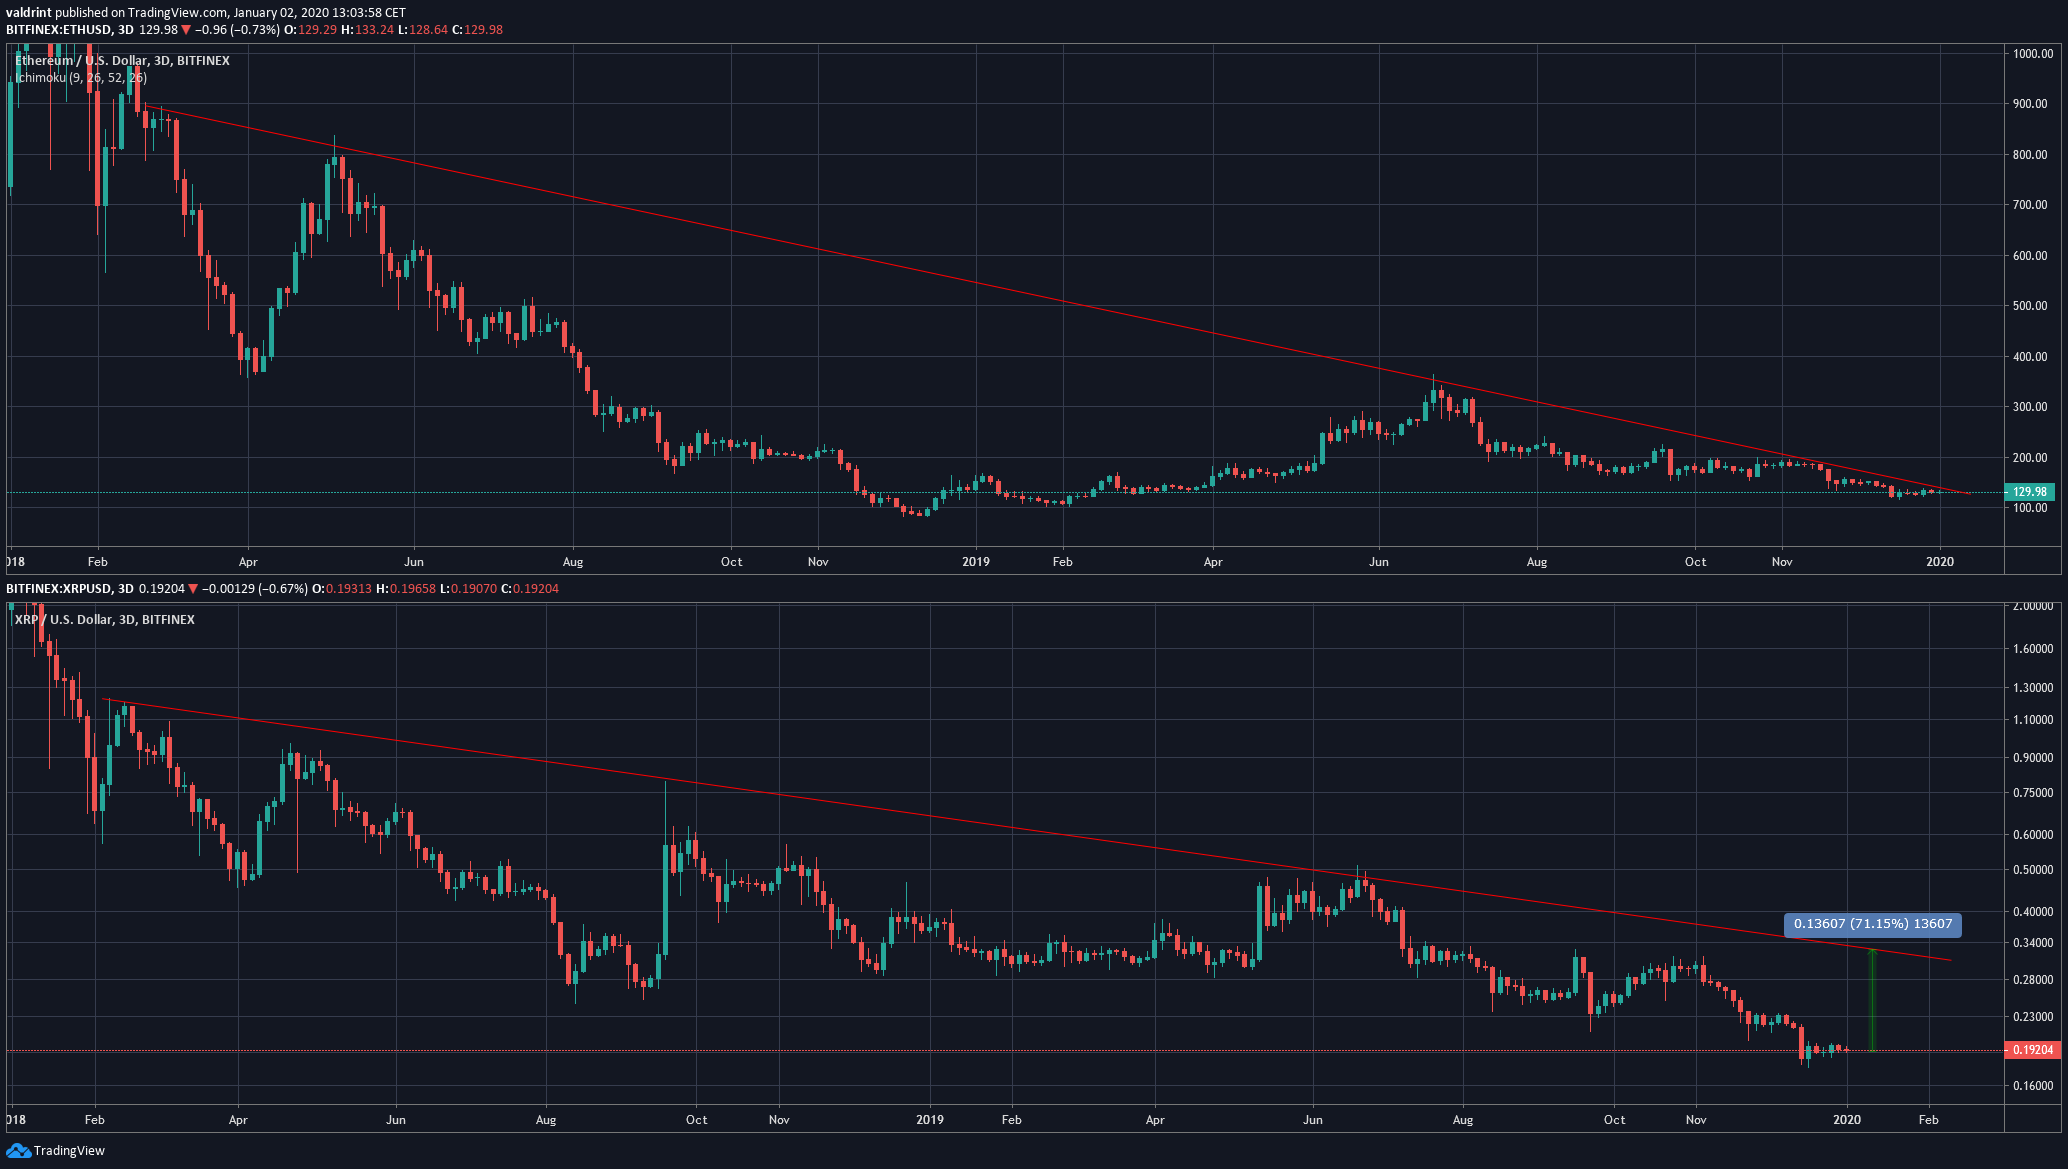
The tweet mentions long-term descending resistance lines for both XRP and Ethereum. Even without using logarithmic charts, they have been following descending resistance lines since February of 2018.
However, while Ethereum (upper) is very close to breaking out above its line, XRP would require an upward move with a magnitude of 70 percent just to reach it.
To conclude, the ICX price has created a bullish pattern while trading at an all-time low. Technical indicators support a breakout for this pattern, with a minimum target of $0.31 — which could be reached at the end of April 2020.


