The ICON (ICX) price has been rapidly increasing since May 15 but has reached an important resistance level and it is unclear if it will break out from it. WazirX (WRX) has been showing similar movement to ICX prior to the breakout but has yet to break out from its descending resistance line.
ICX
The ICX price has been trading inside a long-term descending channel since Feb. 14. The price has been increasing since May 15, when it bounced on the 200-day moving average (MA) and the support line of this channel.
While the increase has had considerable strength and there is no bearish divergence in the RSI yet, the price is approaching the resistance line of the channel and an important resistance area at 3,900 satoshis.

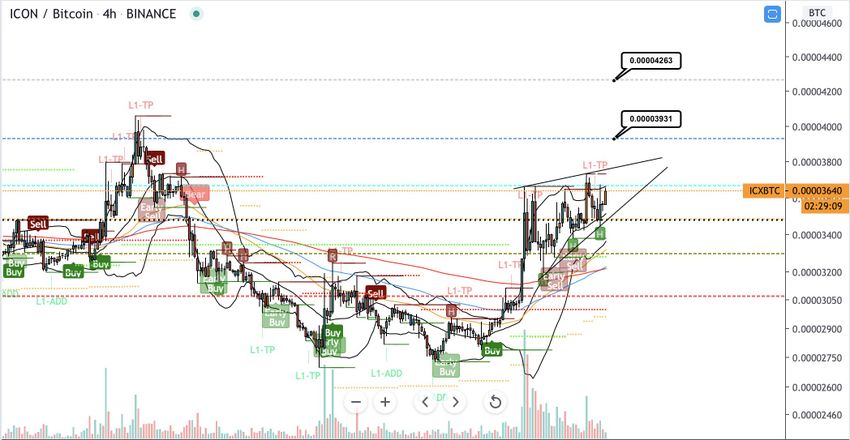
In the shorter-term, well-known trader @CryptoNewton outlined an ICX chart, stating that the price will break out from the current ascending wedge and head upwards.
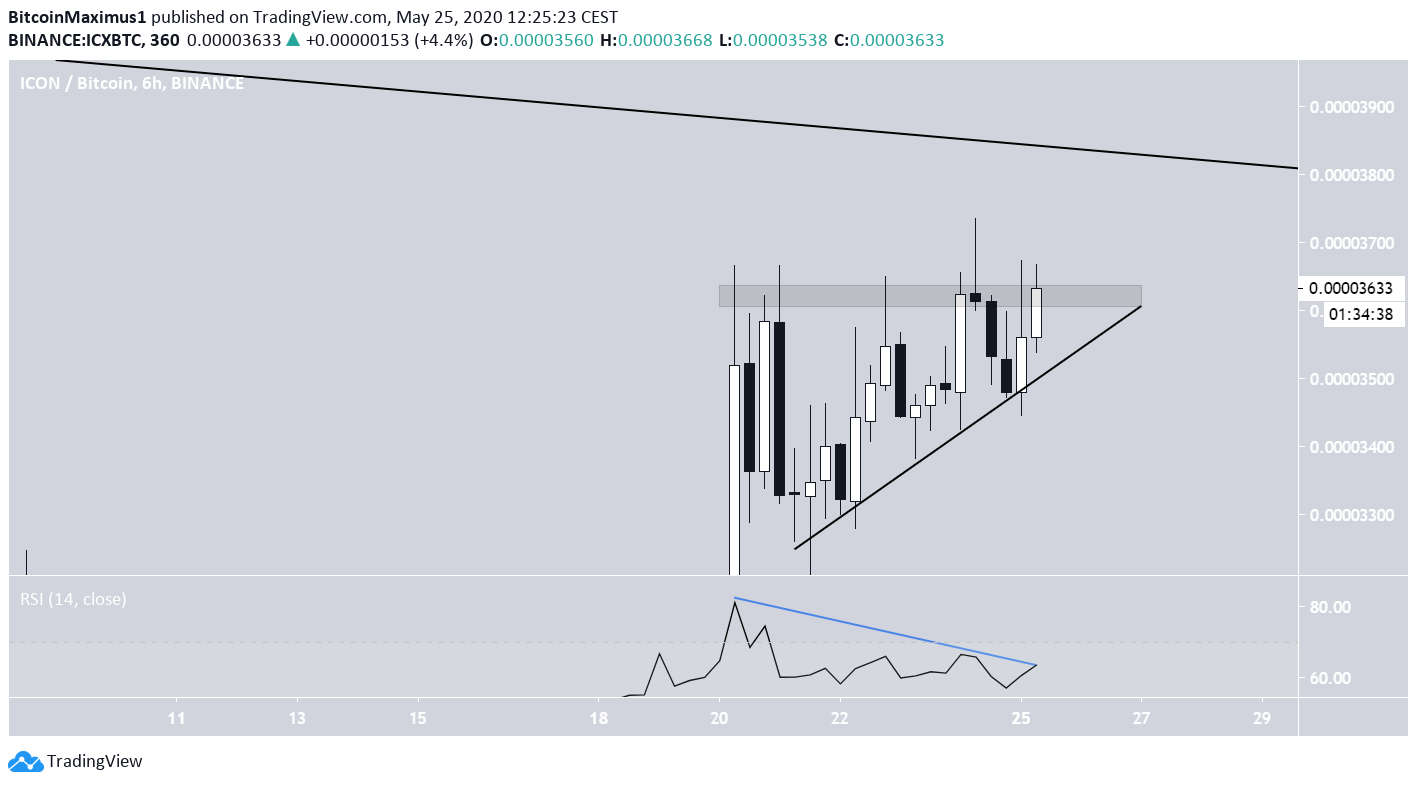
While the presence of wicks makes it difficult to draw the correct resistance line, the price is either trading inside an ascending wedge or an ascending triangle.
However, it has been showing weakness in the form of bearish divergence, and even if it breaks out, it is very close to the confluence of resistance levels mentioned in the previous section.
Therefore, the upside potential for ICX seems limited, even if it were to break out from the current pattern.
WazirX (WRX)
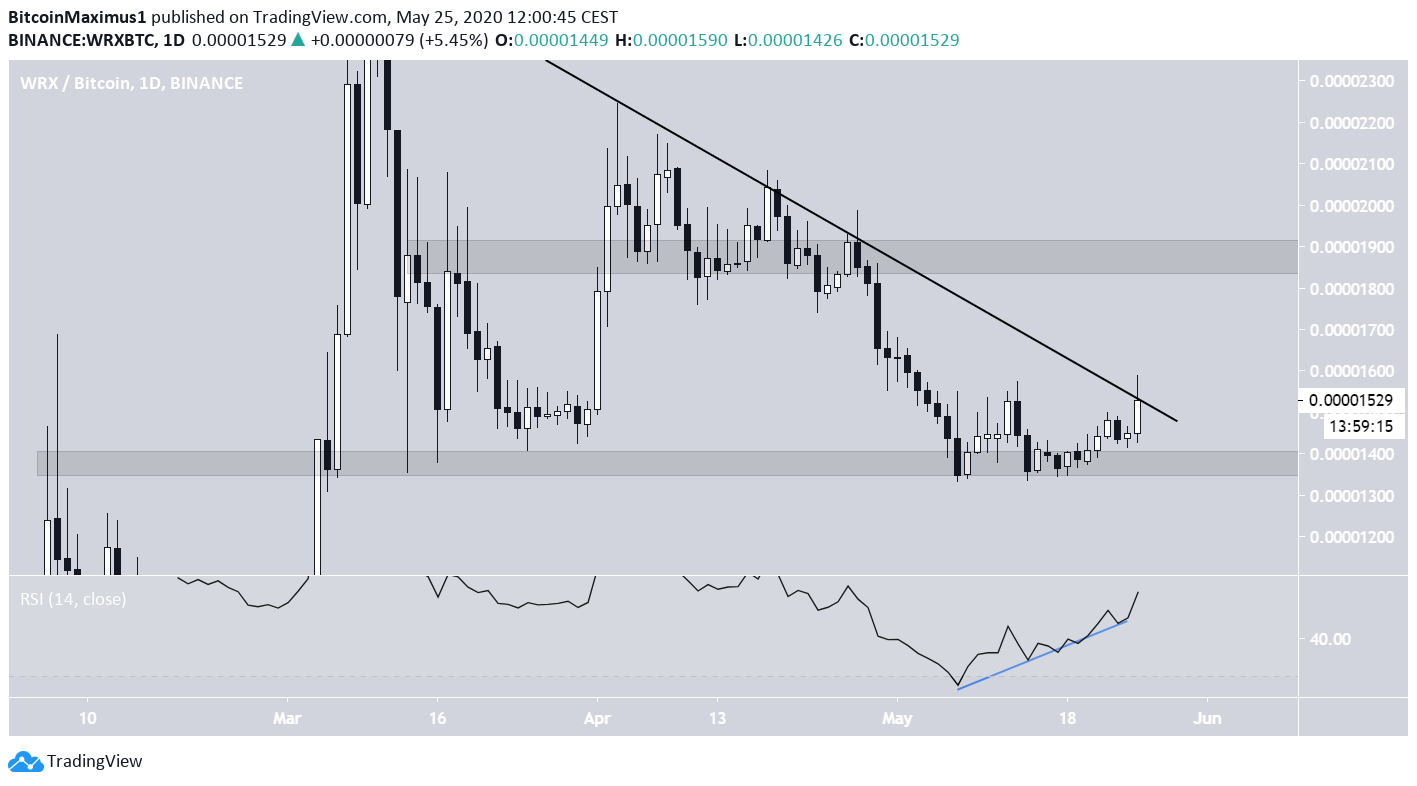
Another coin whose movement is similar to that of ICX before the breakout is WazirX (WRX). It has been following a descending resistance line since March.
At the time of writing, the price was in the process of breaking out from this line but was rejected on the first try. Prior to the attempt, the price created a double bottom inside the 1,400 satoshi support area, which was combined with bullish divergence in the RSI.
This is a sign that the price is likely to eventually break out and continue moving upwards. If it does, the closest resistance area is found at 1,900 satoshis.
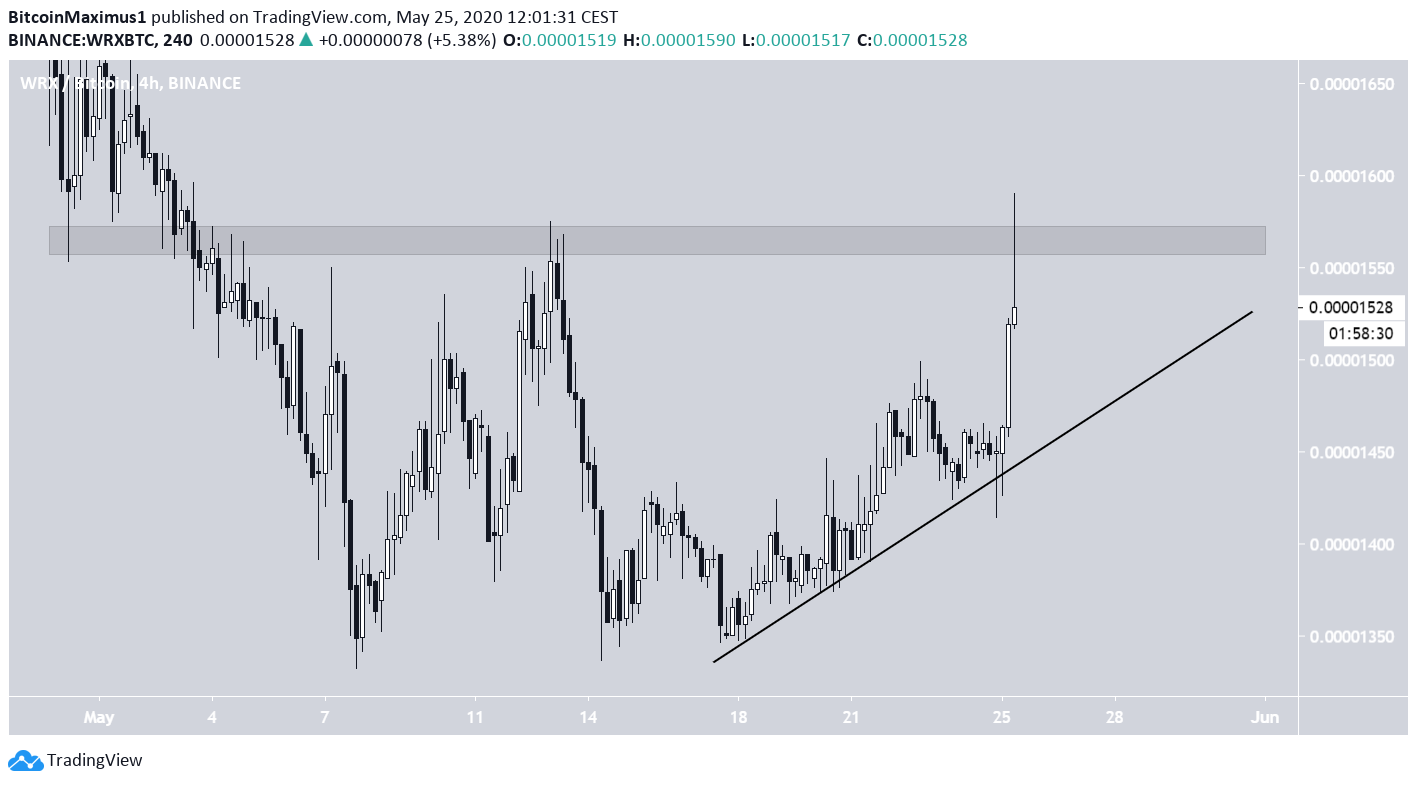
In the short-term, WRX is following an ascending support line and was just rejected by the 1,570 satoshi resistance area, creating a long upper wick.
Therefore, the price is expected to drop towards this support line once more, before eventually breaking out and likely initiating a rapid acceleration in the rate of increase.