


The Icon (ICX) price has made two unsuccessful attempts at moving above a long-term resistance level. Until it successfully breaks out above, the trend is bearish.
Failure to Break Through Resistance
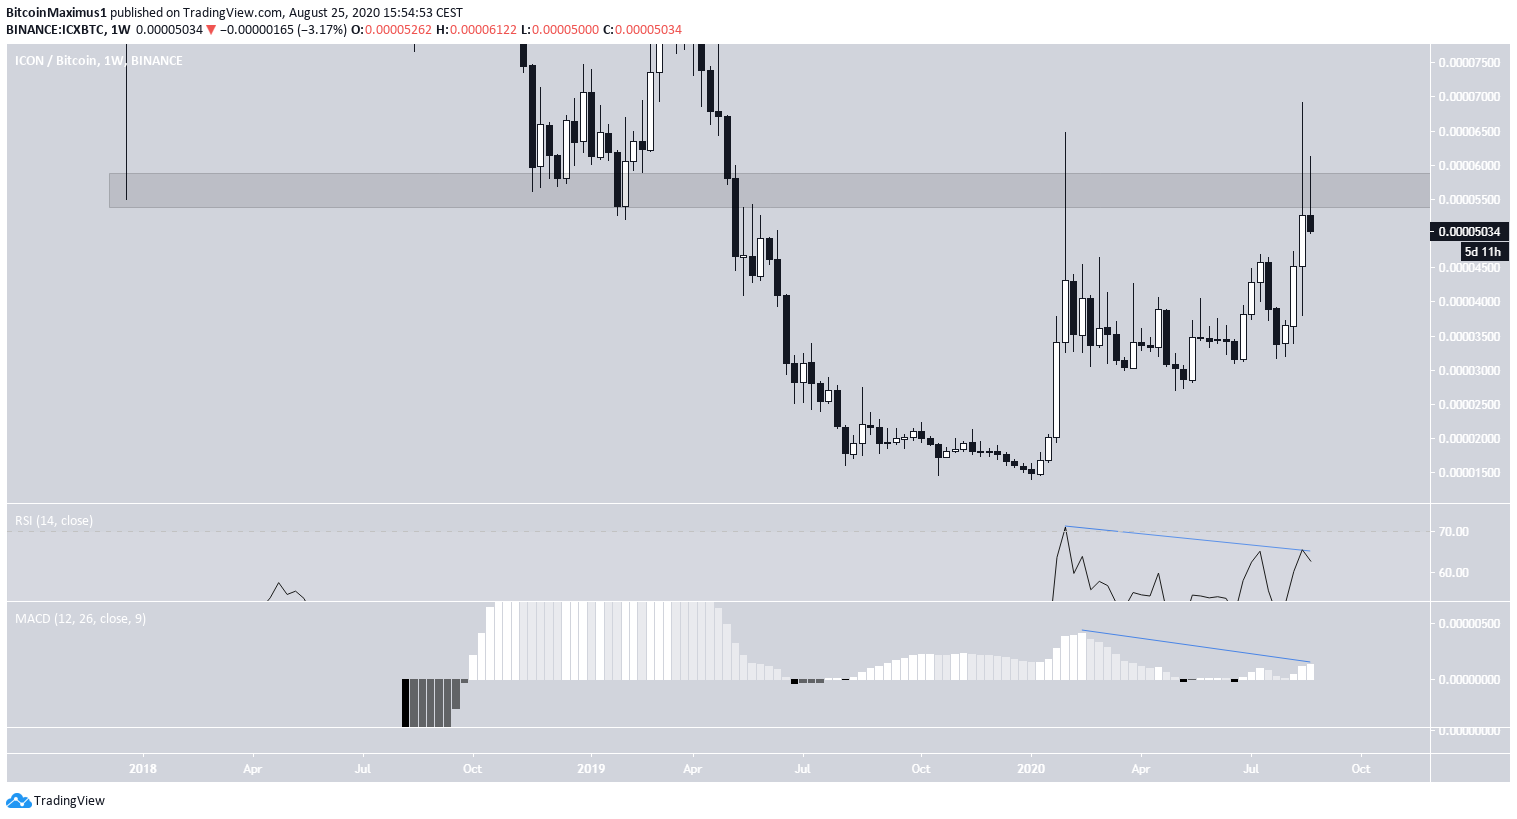
The ICX price began an upward move in January 2020, creating four successive weekly bullish candlesticks in a row. However, once the price reached the 5600 resistance area, which had previously acted as support throughout the entirety of 2018, it created a long upper wick and dropped sharply.
After several months of consolidation, the price made another attempt at breaking out in August, which ended with a similar long upper wick and subsequent decline.
There is bearish divergence on both the RSI and the MACD, a sign that the price is likely to move downwards. Until the price successfully flips the 5600 level, the price action is bearish.
Short-Term Breakdown
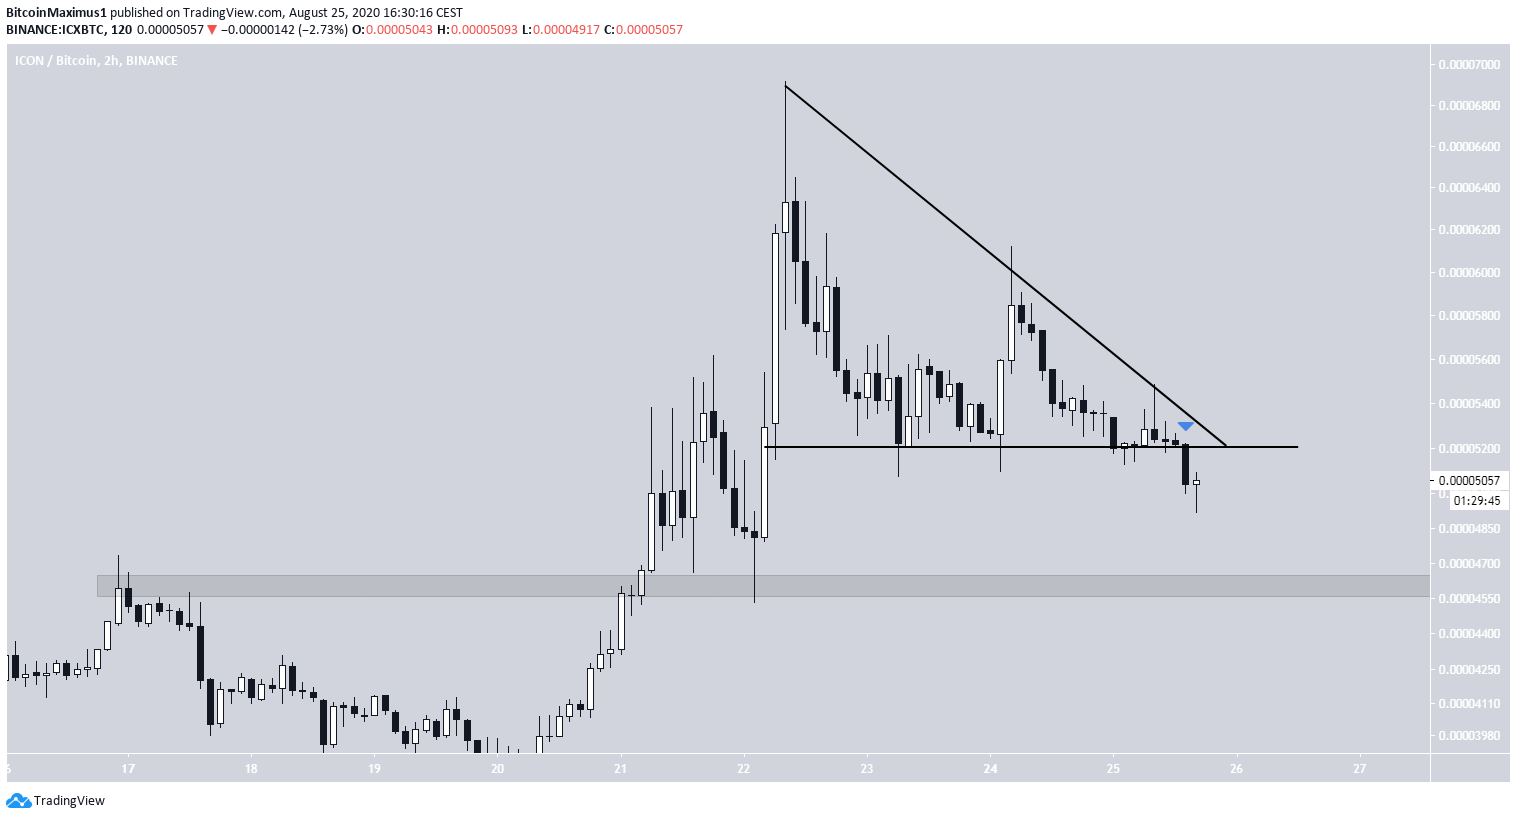
The short-term chart reveals that the price had been trading inside a descending triangle since August 22. The triangle is a bearish pattern, and the price broke down from it earlier today.
If the price continues falling, which is expected, the closest support area is found at 4600 satoshis.
Long-Term ICX Targets
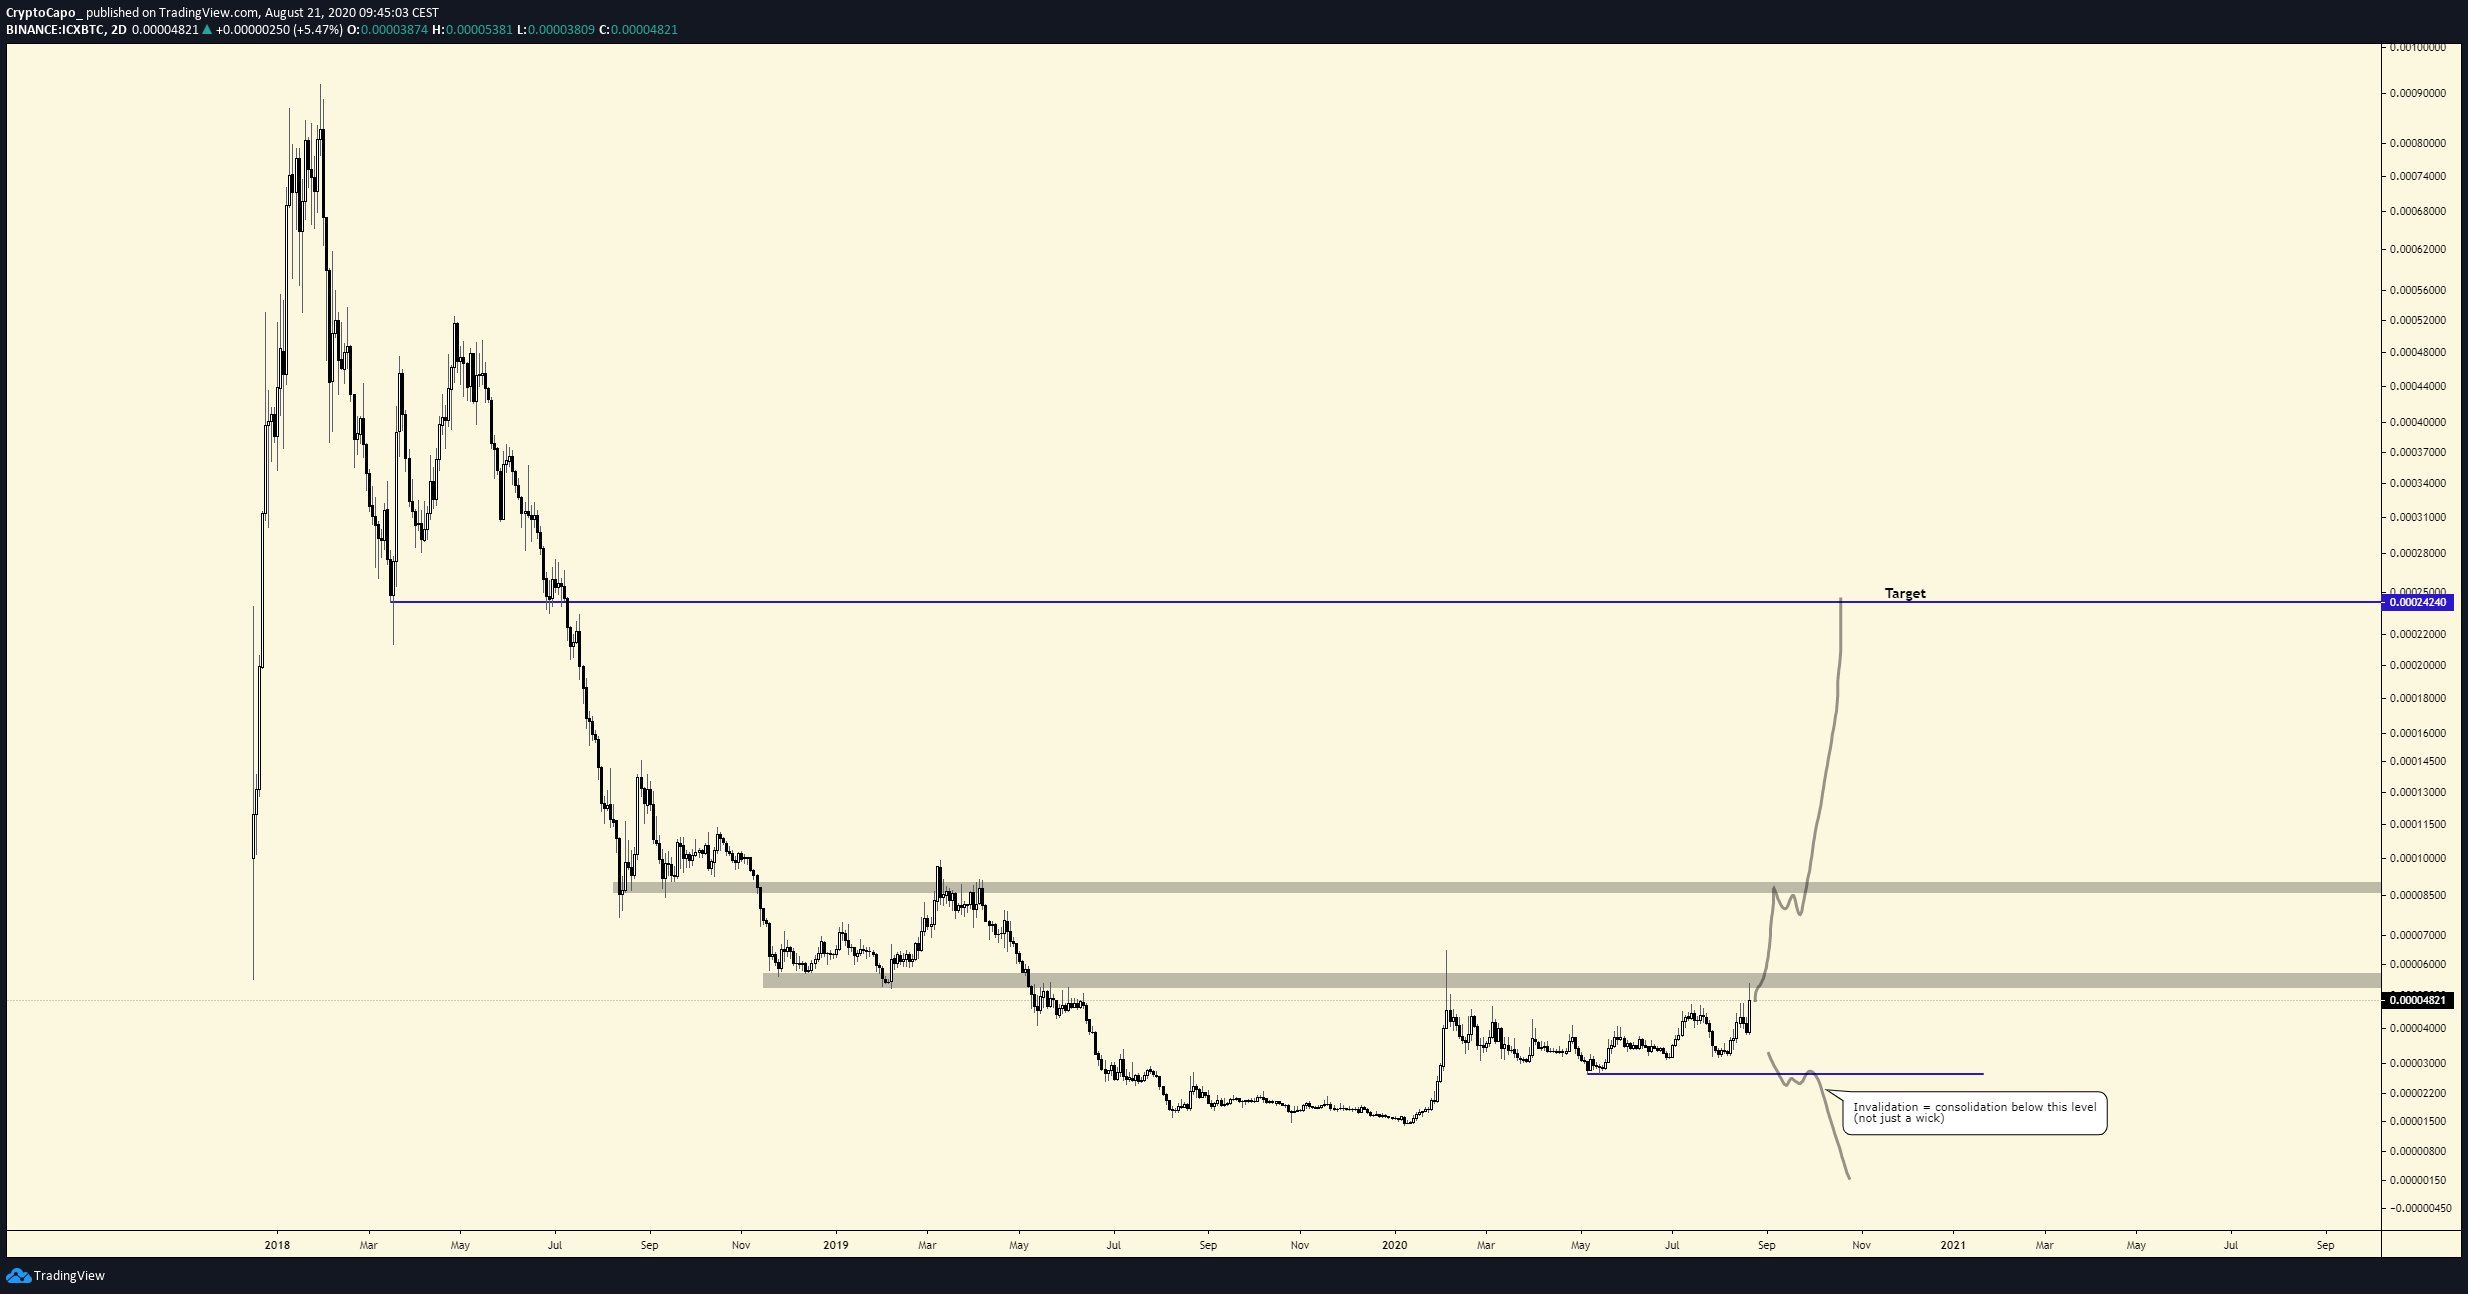
Cryptocurrency trader @CryptoCapo_ posted an ICX chart and stated that the price will increase, eventually moving towards 24,480 satoshis, nearly 5x from the current price.
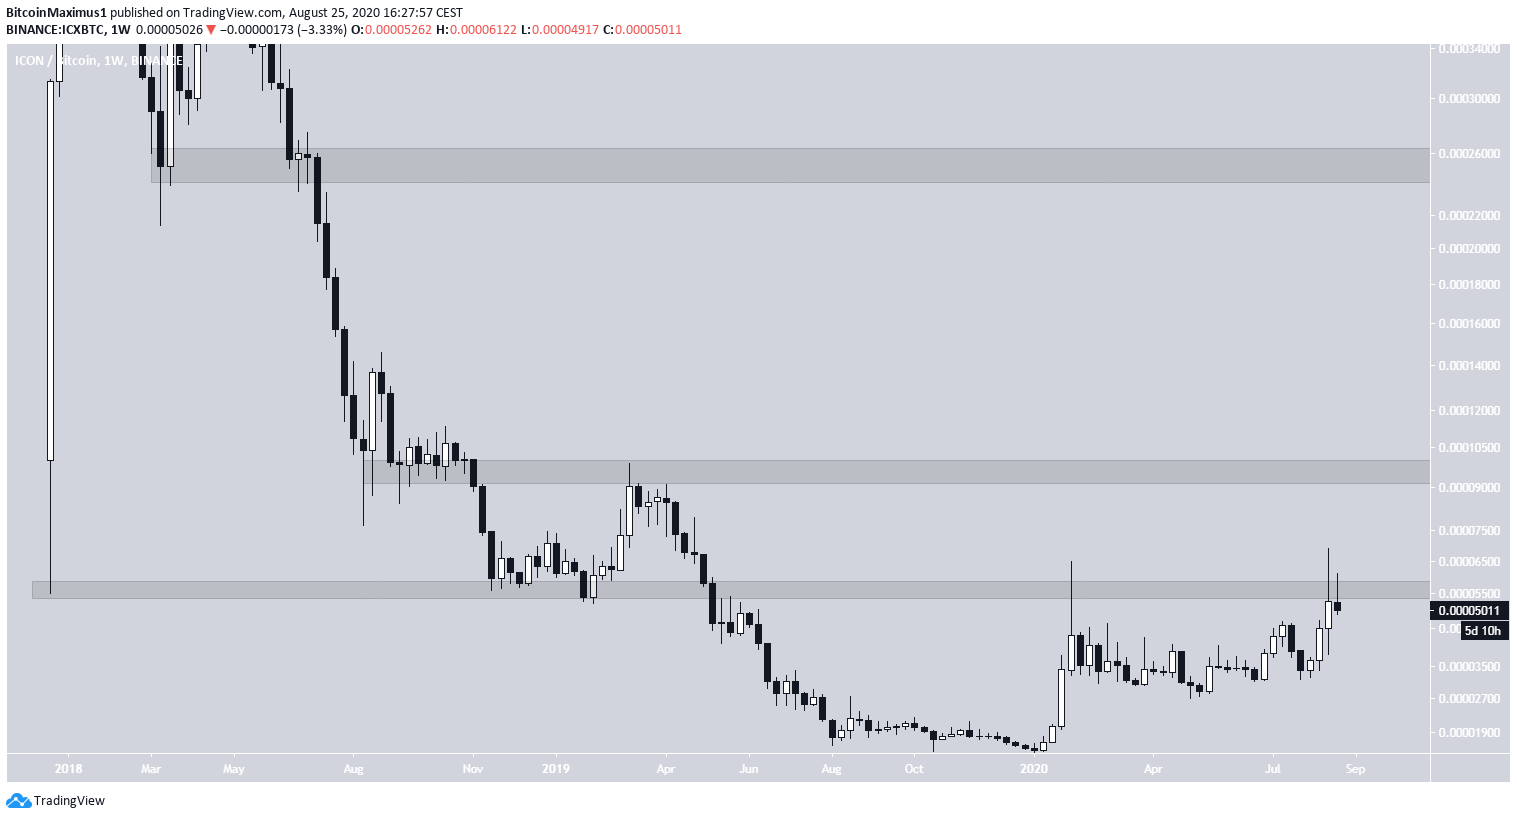
Indeed, when looking at the weekly chart, the first resistance area is found at 9500 satoshis, an increase of nearly 2x from the current price. The next one is found near 25,500 sats, coinciding with that given in the tweet.
If the price is successful in moving above the current resistance area, it should move towards these targets. However, we don’t believe that is likely in the short-term.
To conclude, the ICX trend is bearish until the price flips the 5500 support level. If it succeeds in doing so, the next targets are found at 9500 and 25,500 satoshis.


