


Be[In]Crypto takes a look at the five cryptocurrencies that decreased the most last week, more specifically, from July 22 to 29.
These cryptocurrencies are:
- Huobi Token (HT) : -6.96%
- Kusama (KSM) : -5.49%
- Algorand (ALGO) : -4.17%
- Helium (HNT) : -4.11%
- Compound (COMP) : -4.07%
HT
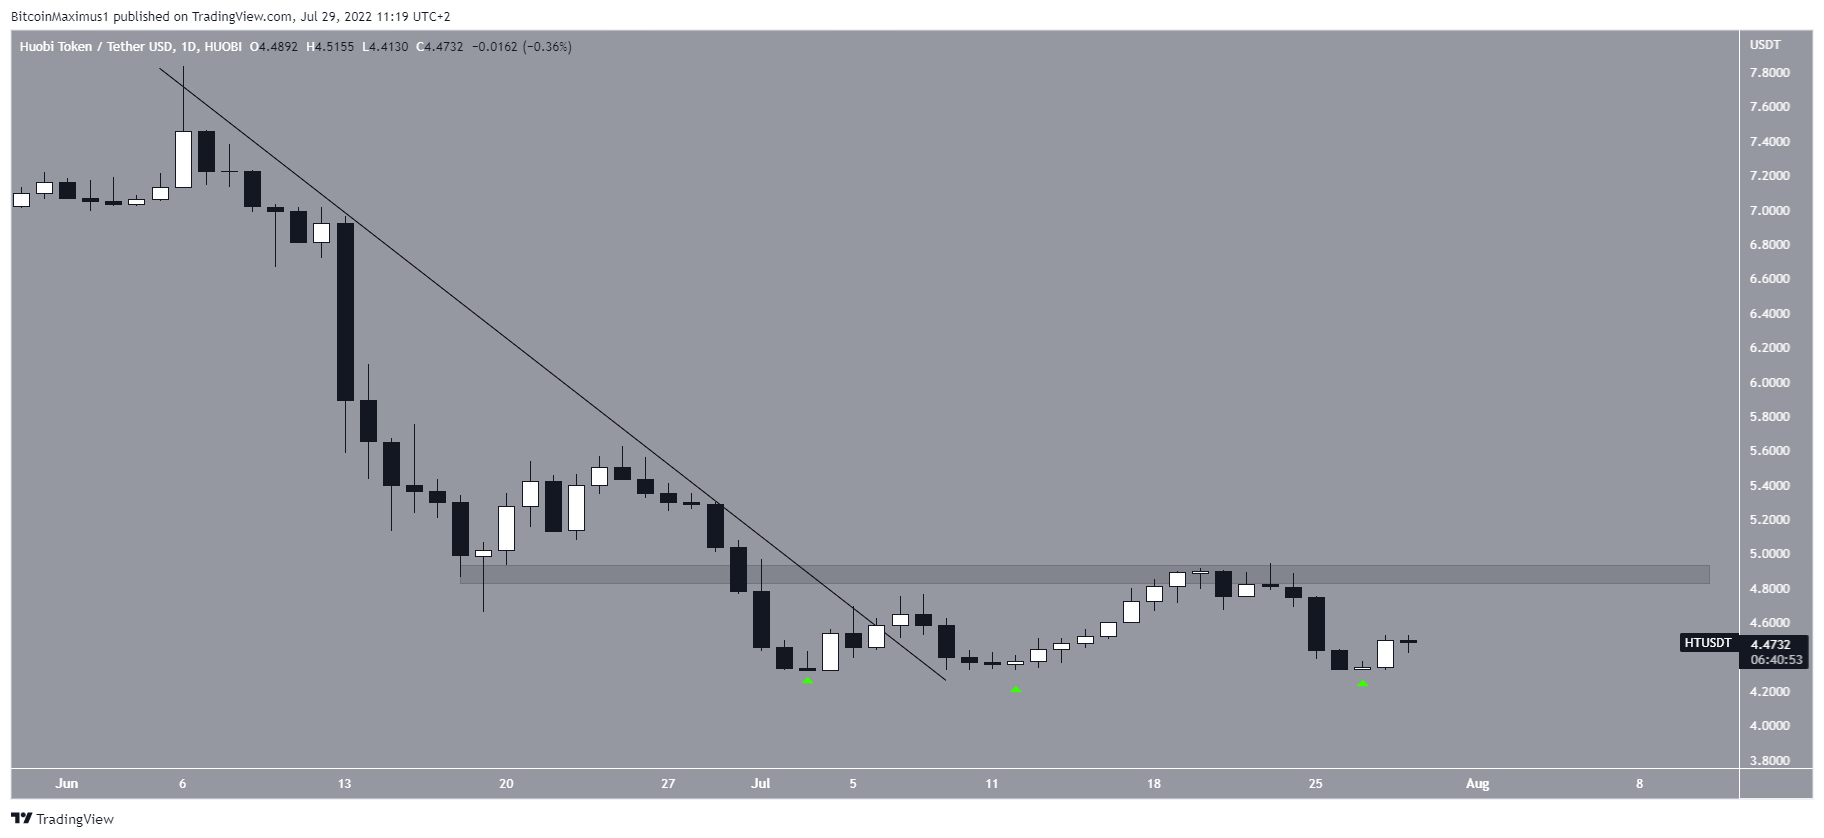
Since the beginning of July, HT has created a triple bottom pattern (green icons). The triple bottom is considered a bullish pattern, meaning that it leads to breakouts the majority of the time.
Additionally, HNT has broken out from a descending resistance line. The main resistance area is now at $4.90. A breakout above it would confirm the pattern and likely accelerate the rate of increase.
KSM
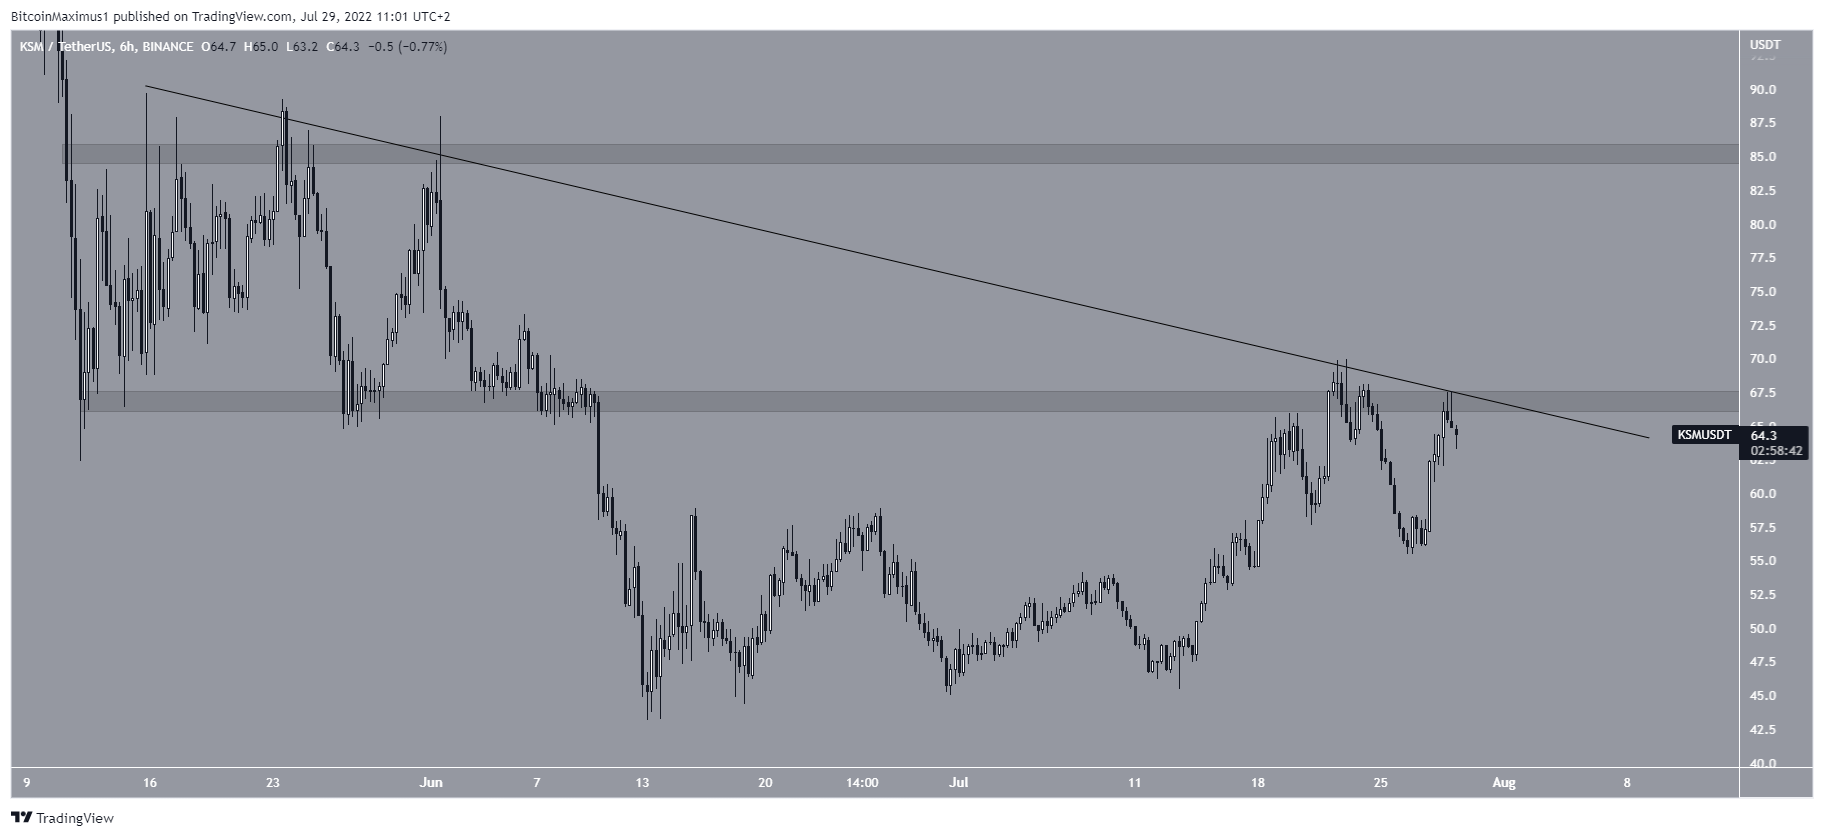
KSM has been decreasing underneath a descending resistance line since May 16. While doing so, it reached a bottom of $43 on June 13.
The price has been moving upwards since and reached the resistance line once more on June 17. The line now coincides with the $67 horizontal resistance area.
A breakout from this line and area could greatly accelerate the rate of increase and take the price towards $85.
ALGO
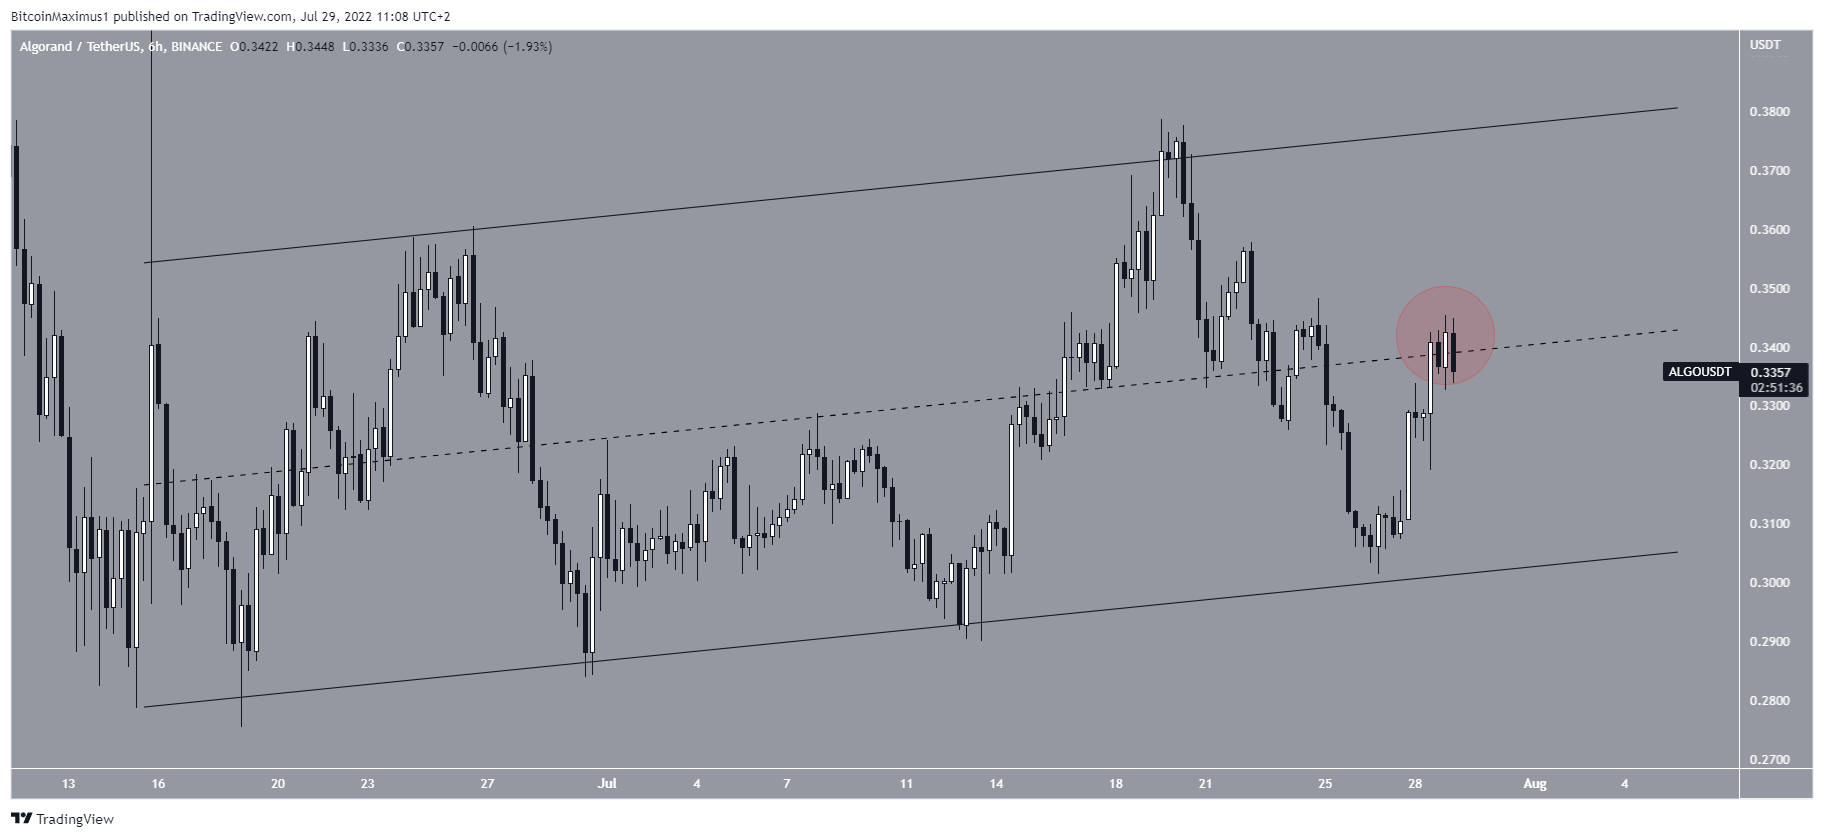
ALGO has been increasing inside an ascending parallel channel since June 13. Such channels usually contain corrective movements, meaning that a breakdown from them would be expected.
Currently, ALGO is facing resistance from the middle of the channel (red circle). Whether it gets rejected or reclaims it will likely determine the direction of the future trend.
HNT
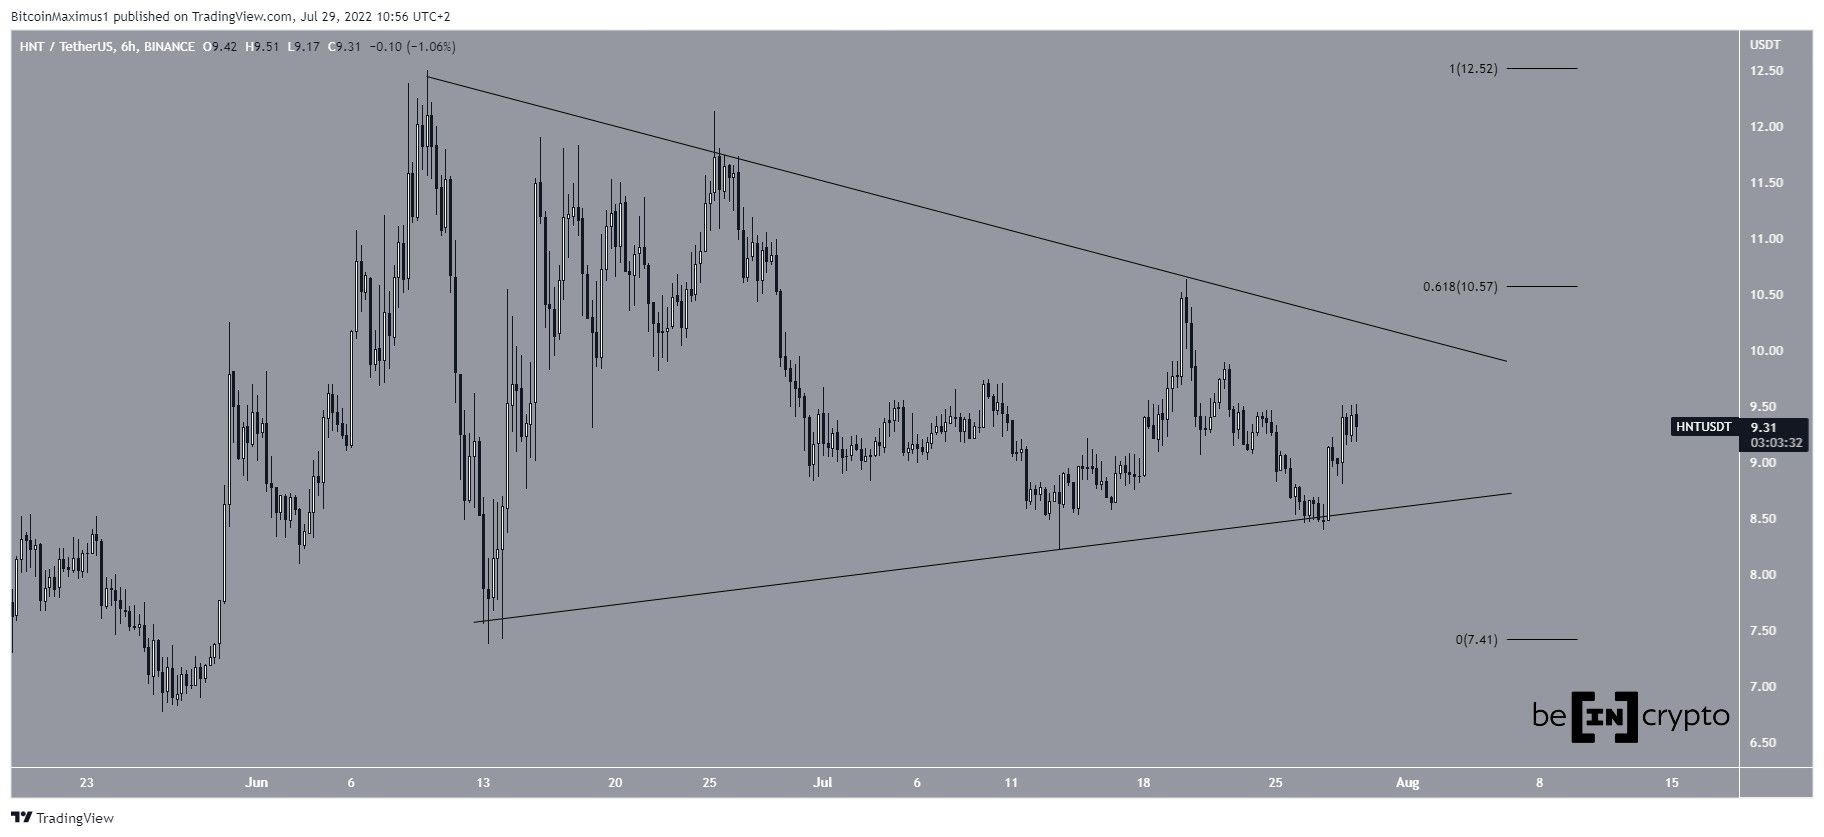
HNT has been decreasing inside a symmetrical triangle since June 10. So far, both the resistance and support lines have been validated three times, granting legitimacy to the pattern.
The symmetrical triangle is considered a neutral pattern, meaning that both a breakout and breakdown are possible. However, since it is occurring after an upward movement, a breakout from it would be more likely.
If that happens, the closest resistance area would be at $10.60.
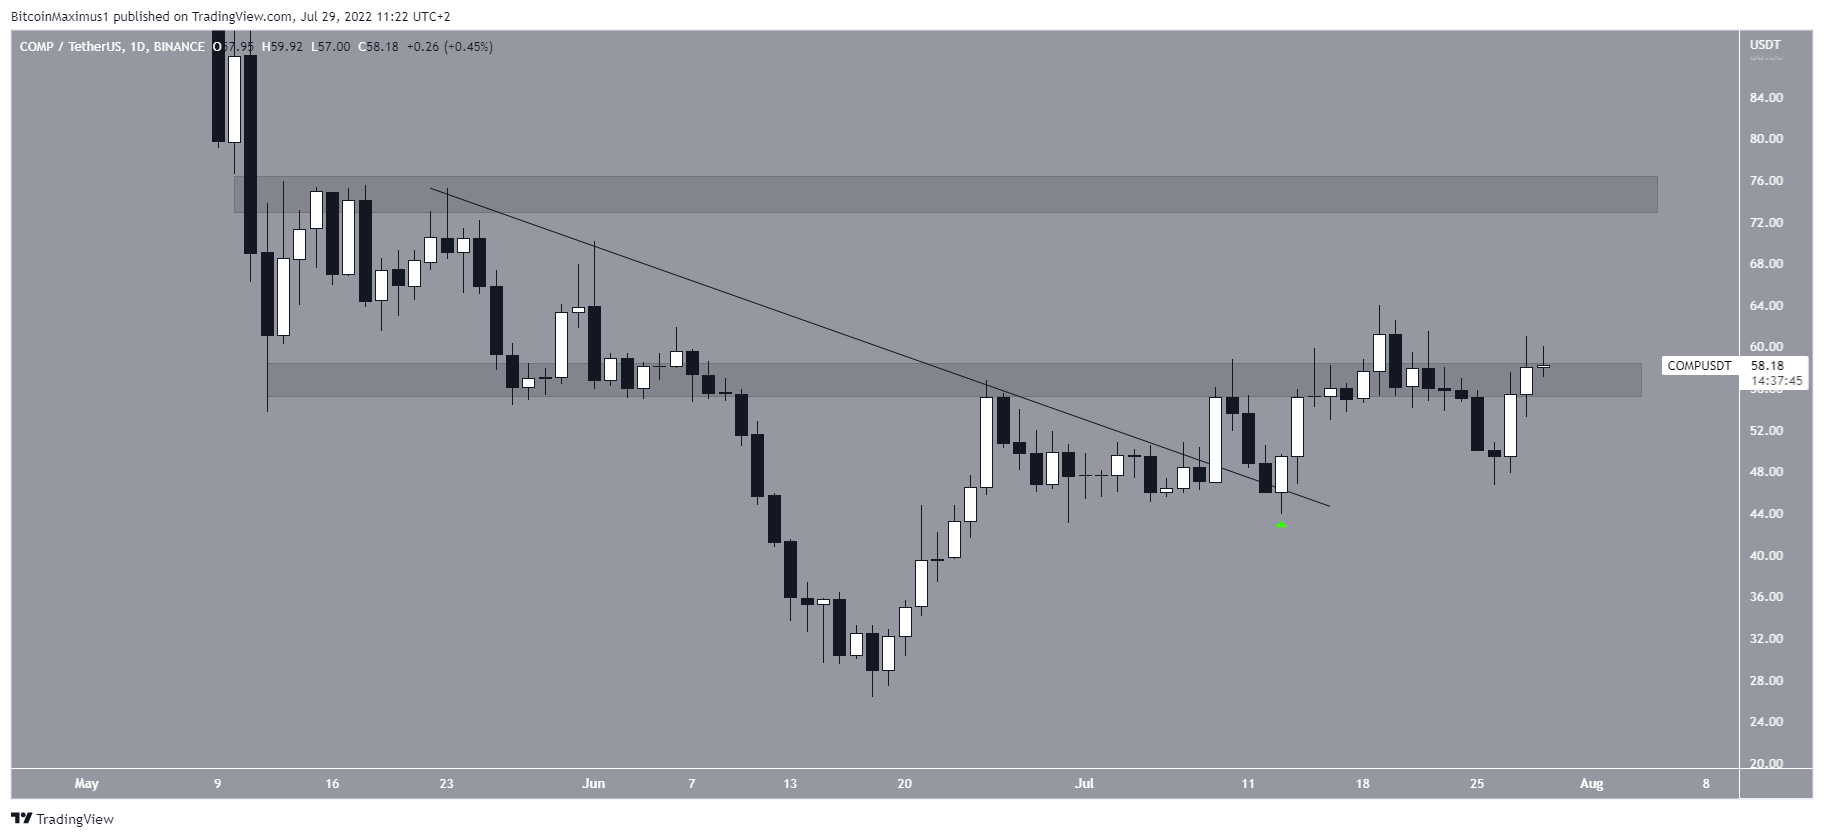
COMP
On July 13, COMP broke out from a descending resistance line that had been in place for 20 days. It returned to validate it as support the next day (green icon).
Currently, COMP is attempting to break out from the $58 resistance area. If successful, it would be expected to increase towards the next resistance at $75.
For Be[in]Crypto’s latest Bitcoin (BTC) analysis, click here



