
A fractal is a pattern that is self-similar in different scales. In trading, we call them recurring patterns. Recurring patterns can be very helpful in realizing profits since they provide a plan or a map of future price movement.
We will analyze three such recurring patterns in BTC below.
They occurred on September 9, 16 and 19.

The pattern consists of a rapid decrease, which causes a breakdown from the current trading pattern. Afterward, the price initiates a similarly rapid increase, which goes above the opening prices of the breakdown. This movement is characterized by a very long upper wick. Additionally, it occurs with less volume than the breakdown. Afterward, the price continues its downward movement.
September 9
The price opened at $10,433 on September 9. It gradually decreased throughout the day — before accelerating its rate of decrease at 09:00. The price went from $10,306 to $10,133 in a span of one hour.
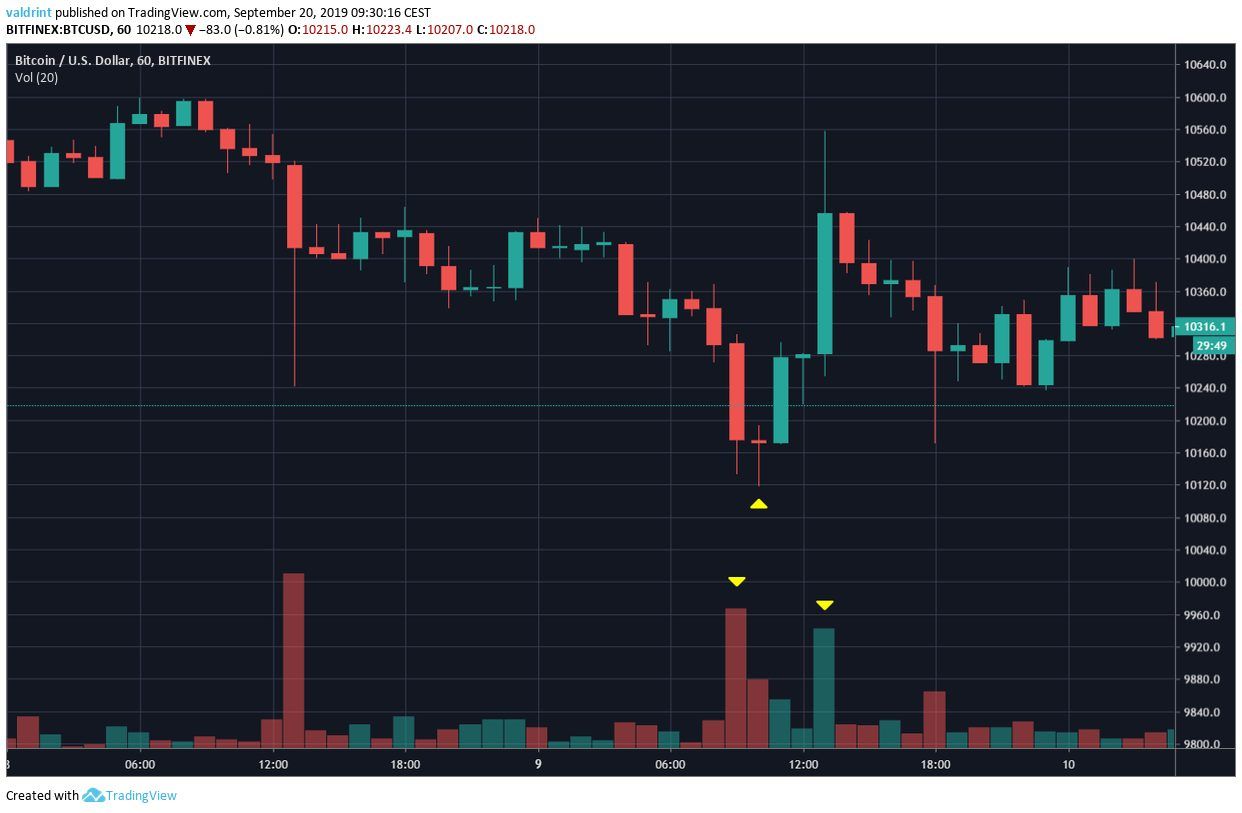
Afterward, it created a doji candle — which indicated that a reversal might occur.
The Bitcoin price followed this by creating three bullish candles in a row.
The third one was characterized by a long upper wick — reaching a high of $10,557.
Throughout this move, the volume was higher during the decrease than during the increase — even though the upward move had a larger magnitude.
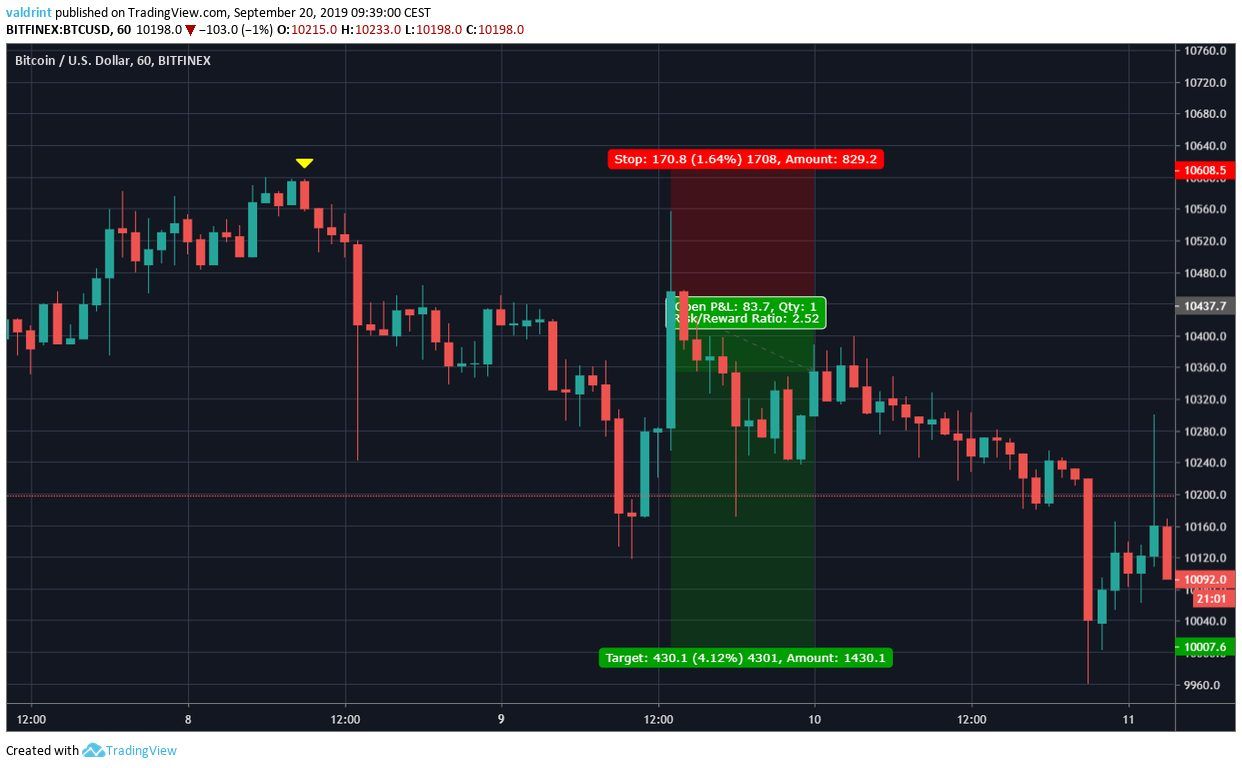
One way to trade this would be to sell once the Bitcoin price reached the day’s opening prices near $10,430. The stop loss would be placed above the previous high (at $10,600), while the target of $10,000 is found by identifying the closest support area.
September 16
The Bitcoin price opened at $10,317 on September 16. It traded around this level before accelerating its decrease at 14:00. It went from $10,310 to $10,120 in a span of one hour.
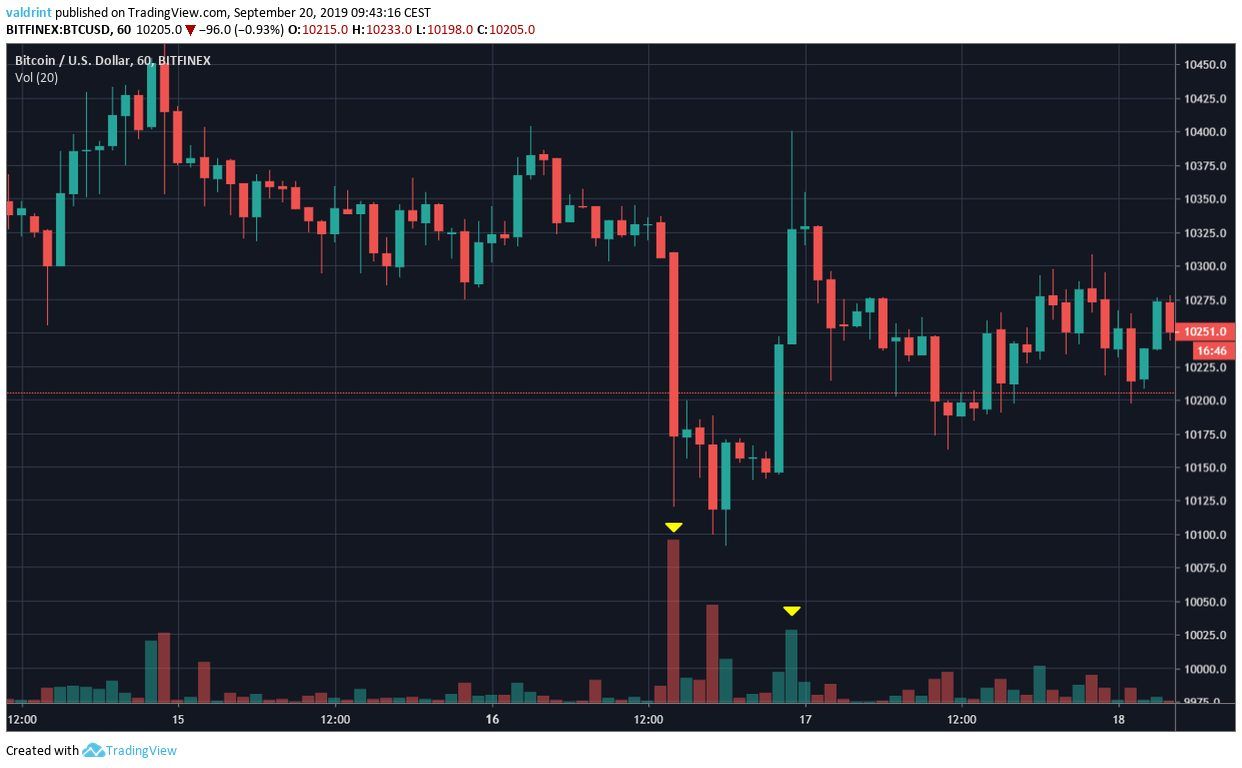
Afterward, the Bitcoin price created two bullish candlesticks in a row — the second of which was characterized by a long upper wick, reaching a high of $10,400.
Similar to September 9, the volume was much higher during the decrease than during the increase.
Since we now have a pattern, we would trade this the same way we did when this movement occurred on September 9.
We would do so by selling once the price reached the day’s opening price of $10,330 — with a stop loss above $10,450 and a target of the closest support area of $10,000.
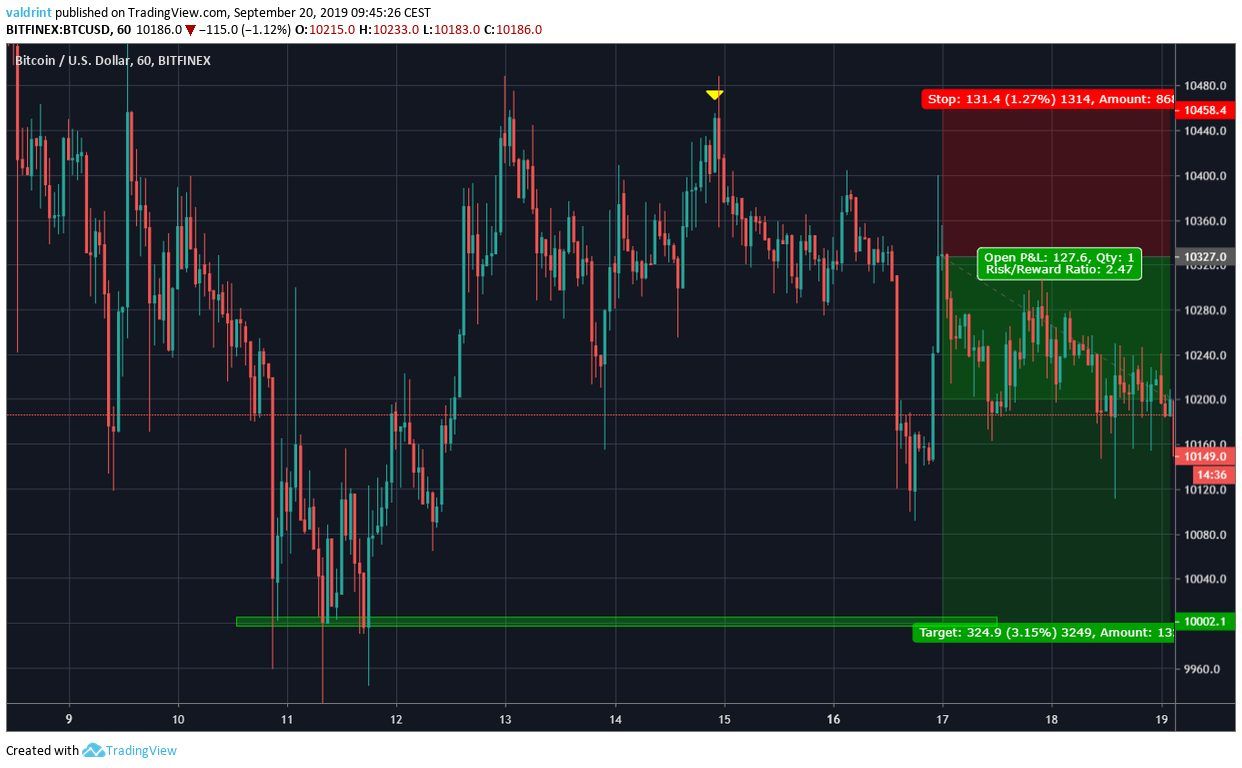
September 19
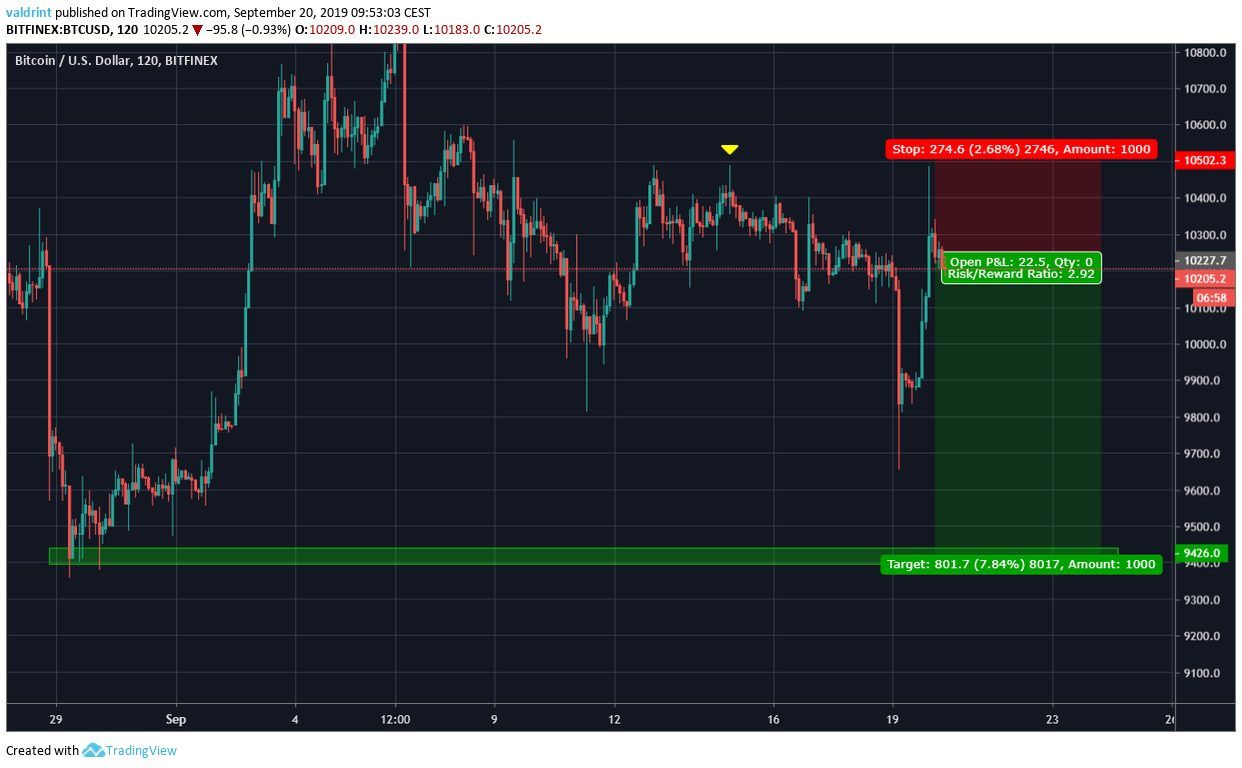
On September 19, the Bitcoin price opened at $10,221. A rapid decrease ensued shortly after and the price reached a low of $9655. Afterward, a similar rapid increase was initiated — characterized by a long upper wick which reached a high of $10,487.

Similar to the two previous times this happened, volume was higher during the decrease than during the increase.
Using the previous two moves as a guide, we would trade this by selling as soon as Bitcoin reached the day’s opening prices at $10,220. The stop loss would be placed above the previous high at $10,500 while the target is found by the previous support area near $9400.
What do you think? Let us know in the comments below!
Disclaimer: This article is not trading advice and should not be construed as such. Always consult a trained financial professional before investing in cryptocurrencies, as the market is particularly volatile.
Images are courtesy of Shutterstock, TradingView.
