


The Solana (SOL) price broke out from a short-term resistance line but is still trading inside a long-term resistance area.
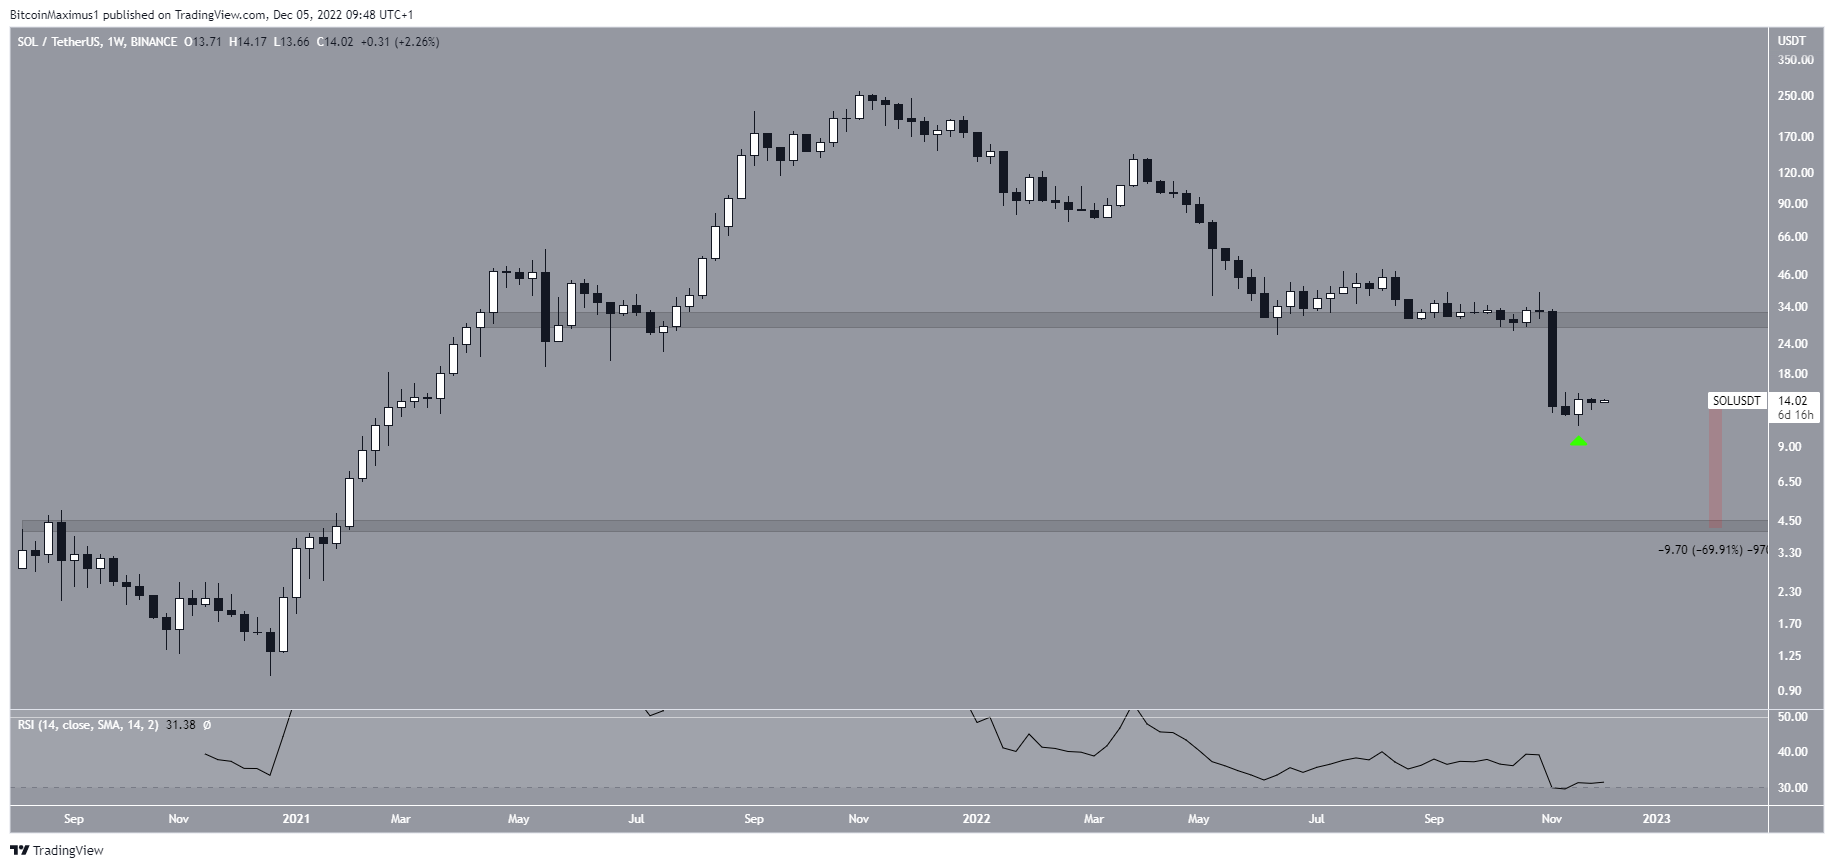
SOL is the native token of the Solana blockchain, created by Anatoly Yakovenko. The price history from the weekly chart shows that the Solana price has fallen since reaching an all-time high of $259.90 in Nov. 2021.
The downward movement led to a low of $10.94 in Nov. 2022. The decrease also caused a breakdown from the long-term support area with an average price of $29.
The weekly RSI is decisively bearish. It is decreasing, is below 50 and has yet to generate any bullish divergence.
The next closest support area is at $4, which would be a fall of 70% from the current price. Conversely, the $29 area is now expected to provide resistance.
Therefore, the weekly time frame is leaning on a bearish Solana (SOL) price prediction.
Solana Price Begins Relief Rally
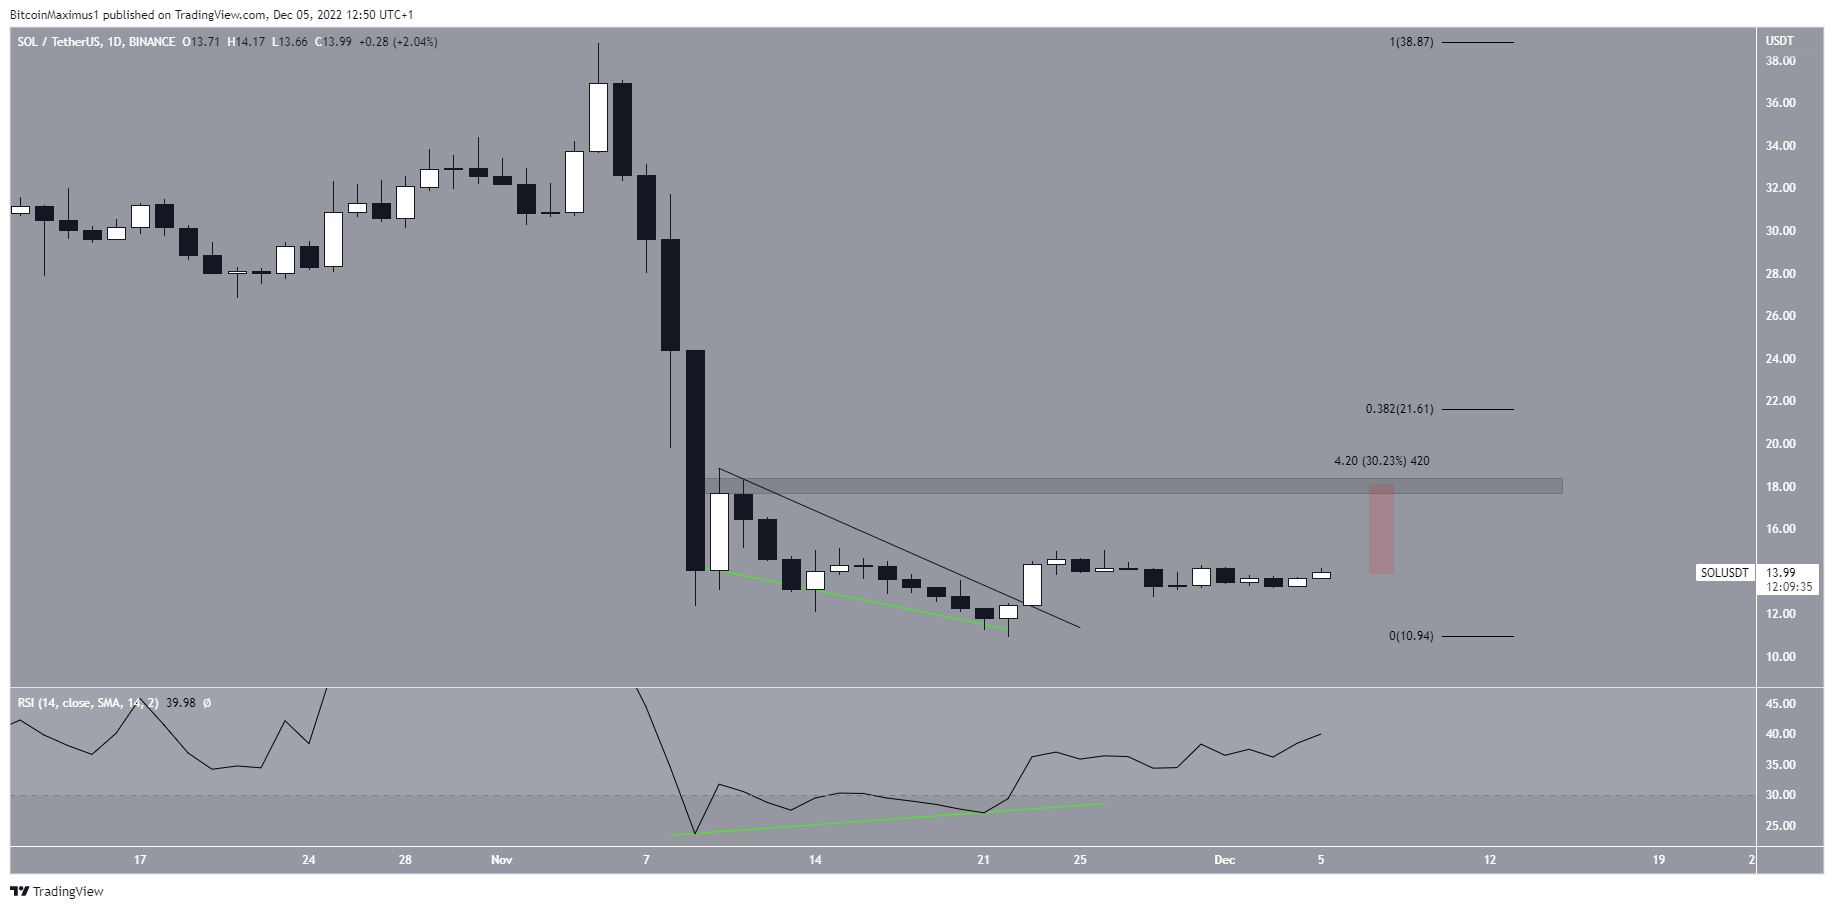
The price chart from the daily time frame is more bullish than that from the weekly one. Solana broke out from a descending resistance line on Nov. 23 and has increased since. While the upward movement initially stalled, the price increased significantly over the past 24 hours.
The upward movement was preceded by bullish divergence in the daily RSI. The indicator increased considerably after the divergence and is now approaching the 50 line. Moving above it would bode well for the future price.
The closest resistance area is at $18, 30% above the current price.
The most likely Solana price prediction suggests that the Solana price will reach it. However, due to the bearish readings from the weekly time frame, the long-term trend remains bearish.
Even if the SOL price were to break out from the $18 area, the trend can only be considered bullish once the long-term $29 area is reclaimed.
For BeInCrypto’s latest crypto market analysis, click here.
Disclaimer: BeInCrypto strives to provide accurate and up-to-date news and information, but it will not be responsible for any missing facts or inaccurate information. You comply and understand that you should use any of this information at your own risk. Cryptocurrencies are highly volatile financial assets, so research and make your own financial decisions.



