


The NEO price initiated a strong upward move in October 2019 but has been consolidating since reaching a high. The price has been trading inside a symmetrical triangle since.
NEO Highlights
- NEO is trading inside a symmetrical triangle.
- There is resistance at ₿0.0136, ₿0.0169, and ₿0.025.
- It is possibly beginning the third wave of a five-wave Elliott formation.
Well-known trader @Damskotrades posted a double image of the NEO price chart, showing both the weekly and daily time-frames. The daily time-frame shows the price breaking out from a symmetrical triangle, while the weekly one gives a target of ₿0.0169 for the ensuing breakout.
1) Weekly chart
2) Daily chart—— —— ——
Filled in the Blue with the @Altcointraders_ Discord pic.twitter.com/wdBWckxxkC— CryptoAmsterdam (@damskotrades) February 6, 2020
Symmetrical Triangle
The NEO price has been trading inside a symmetrical triangle since Oct 29, 2019. It is currently very near the resistance line of this pattern. Since the triangle is appearing after a strong upward move, it is expected that it will act as a continuation pattern causing a price breakout.
In addition, there are two resistance areas above at ₿0.0136 and ₿0.0169. The price has reached the first zone twice and created a long upper wick each time before decreasing.
If the price is able to travel the entire height of the pattern, it should reach the second resistance area target outlined in the tweet.
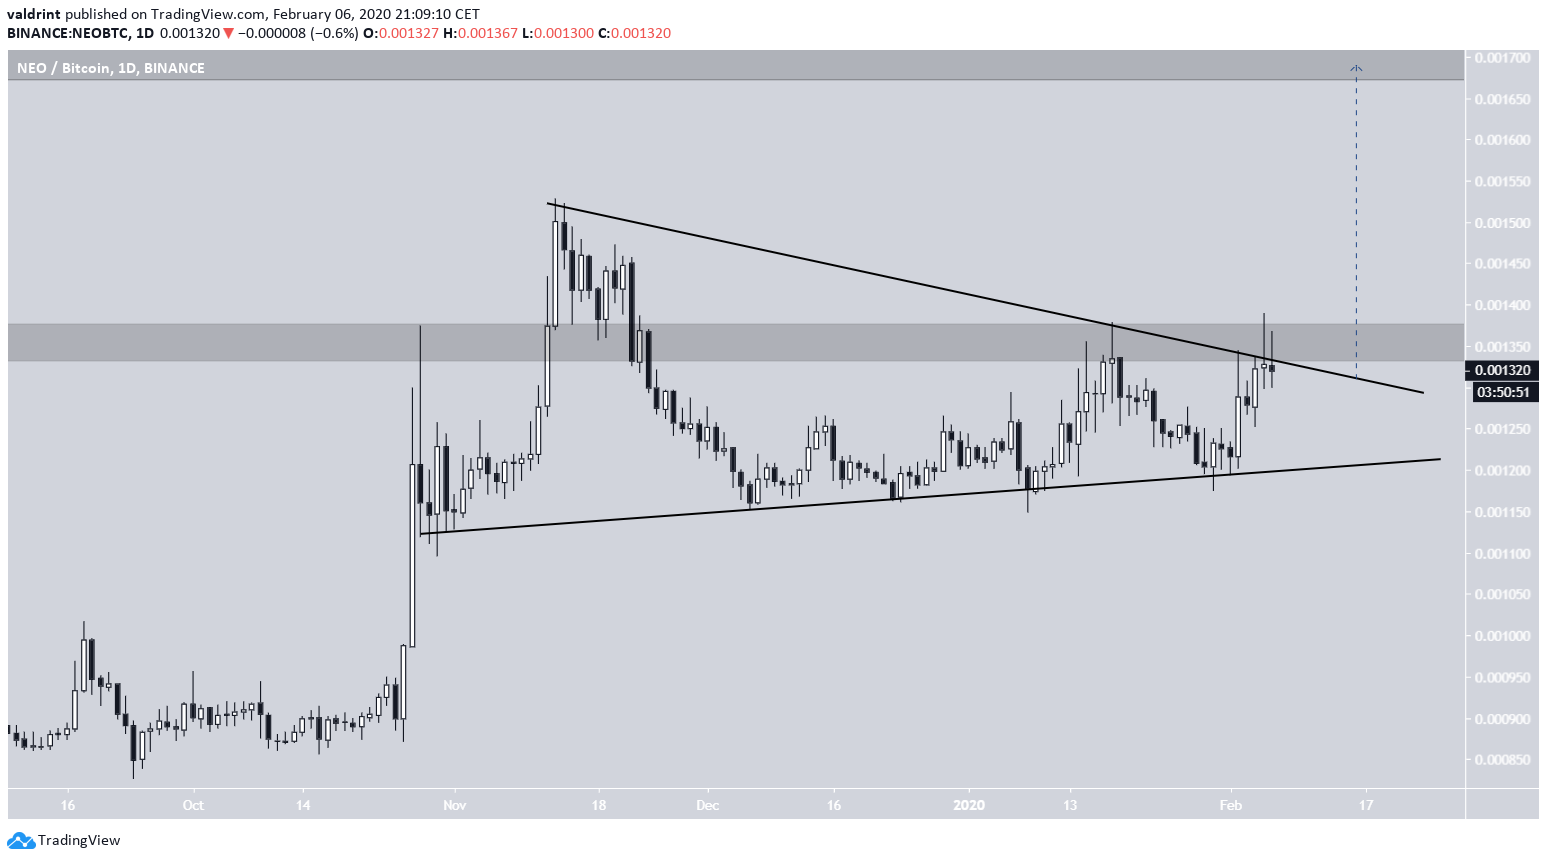
Looking closer at the movement inside the ₿0.0136 resistance area, we can see that the price has created long upper wicks several times, which were followed by a price decrease.

The daily candlesticks of Jan 18 and Feb 5 are strikingly similar and both have marked a top prior to the decrease. Therefore, it seems likely that the NEO price is not ready for a breakout at the current time and could see a move towards the support line, prior to another breakout attempt.
Elliott Formation
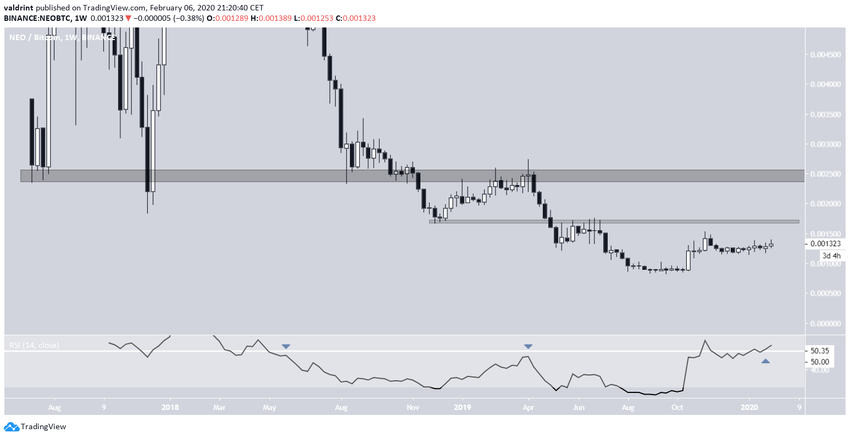
The weekly chart gives us interesting information about future price movements. The RSI fell below the 50-line in May 2018, around the same time the price broke down from the ₿0.0025 price level.
Afterward, the price made an attempt to move above this level but was rejected in April 2019, the same time the RSI was rejected by the 50-line.
However, the current upward movement which began in October caused the RSI to finally reclaim the 50-line, possibly indicating that the price has begun a bullish trend.
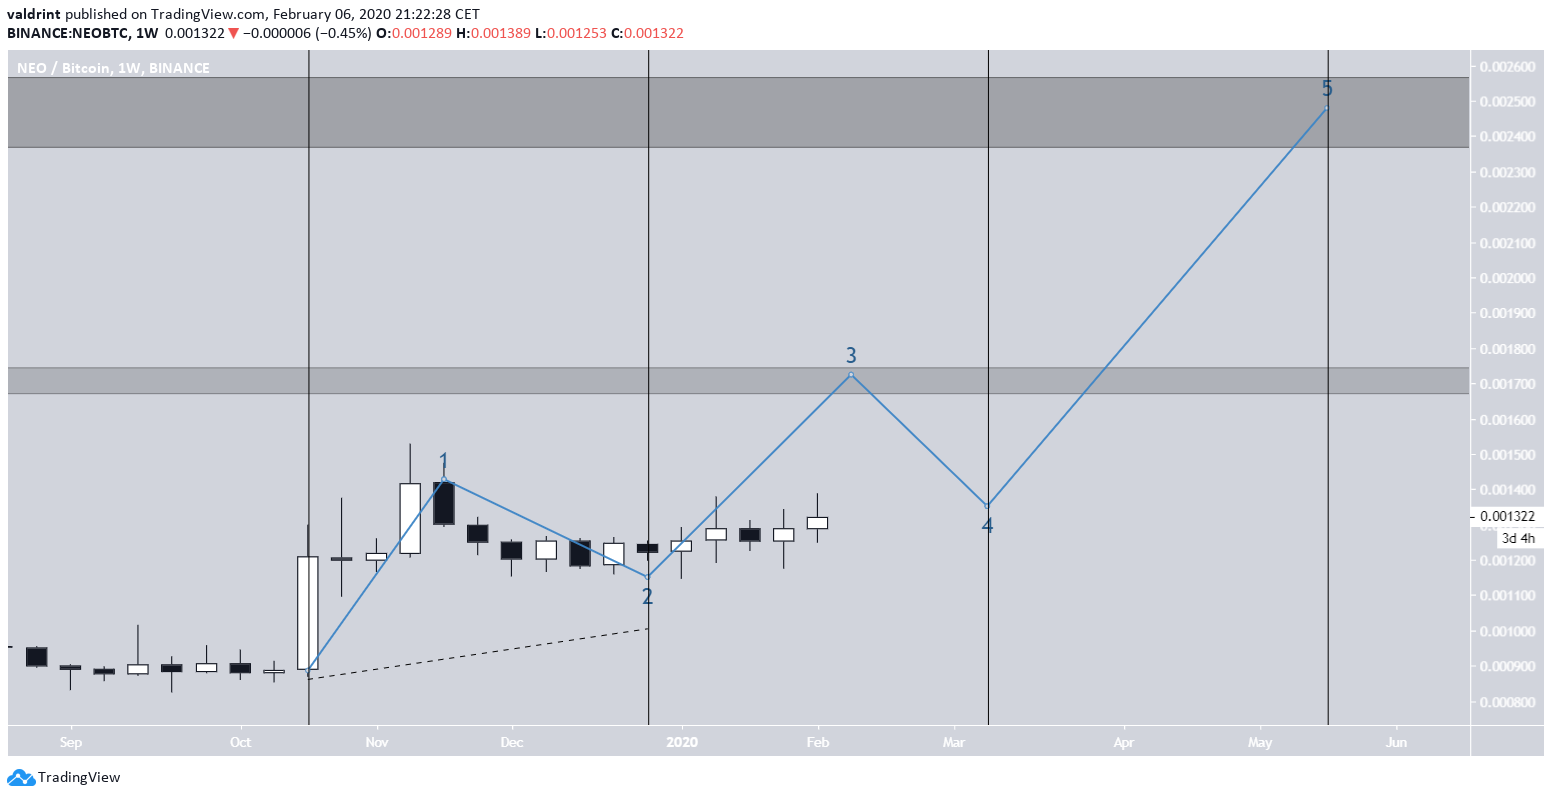
Therefore, it is possible that the upward move was the first wave of a five-wave Elliott formation, and the consolidation inside the triangle has marked the second wave.
The breakout would mark the beginning of the third wave, which has a target of ₿0.0169. Afterward, the fifth and final wave could take the price to the previous breakdown level at ₿0.025.
Using the length of the current movement as a predictor, one can make the assumption that the final target will be reached in May.
To conclude, the NEO price is trading inside a symmetrical triangle out of which it looks likely to break out. A long-term target for the price is given at ₿0.025, which could be reached in May.


