
An in-depth analysis of crucial on-chain data shows that whales are looking beyond Bitcoin (BTC) and Ethereum (ETH). Here are the leading altcoins with the highest whale activity in 2023 and how likely they will sustain the rally in Feb.
Altcoins had a slow start to 2023 as Bitcoin raced ahead to reach a six-month high of 45% dominance of the global cryptocurrency market capitalization. A frenetic turn of events has seen various altcoins make a strong whale-driven rally to cut BTC dominance by a massive 1.3% in the last 14 days.
Whales are cryptocurrency investors who hold large quantities of an asset – typically $100,000 worth of a token or more. An increase in whale transactions or an influx of large long positions in the futures markets of a token means that a massive rally might be on the horizon.
The intense whale activity across different altcoin categories has ensured that the 2023 rally has entered its second month. Here is an analysis of the top crypto altcoins receiving Whale attention in Feb. 2023.
Singularity Leads the 2023 Crypto Boom
Singularity (AGIX) is up 722% in the past 30 days. No cryptocurrency has delivered a better performance than AGIX this year.

SingularityNET is a blockchain-powered marketplace that allows users to “create, share, and monetize” Artificial Intelligence (AI) services. Thanks to the rise to prominence of the popular OpenAI chatbot, ChatGPT, AI projects have attracted the attention of whales and institutional investors globally.
On-chain price data shows that SingularityNET started the year outside the top 100 cryptocurrency rankings. But massive investment by AI-hunting whales has seen the market capitalization of the blockchain marketplace skyrocket into the top 80 list.
When AGIX reached the 200% YTD growth mark, it hit a major resistance point as a cluster of three thousand wallet addresses broke-even price at around $0.24.

In/Out of Money at Price data from IntoTheBlock shows that around January 14, AGIX price stalled at the $0.24 – $0.34 resistance point. There were concerns that the rally had hit the top.
But an increase in whale activity in the form of transactions exceeding $100,000 has seen the AGIX boom enter second gear.

How High Can Singularity Go This Month?
At the 722% performance level, many potential investors are seeking insights on how whales are positioned for the AGIX altcoin in Feb. Whales are set to push SingularityNET into another 30-day rally according to critical on-chain data provided by Coinglass.
Long/Short ratio — a metric that compares the volume of Long positions open to Shorts – shows that whales are gunning for even more bullish action in the coming month.

As of Feb. 5, the percentage ratio of bullish to bearish positions stood at 50.47 to 49:53 in favor of the bulls.

Open Interest data shows that the rise to prominence for the blockchain-based AI and Big Data platform may enter second gear in Feb. Within the last seven days, AGIX Futures Open Interest has increased from $3.6 million at the close of Jan. to a peak of $32.65 million on Feb. 5.
Rising values of Open Interest and volume of whale transaction count show that new demand is flowing into the AGIX markets at a considerable rate – a signal that whales are positioned for the SingularityNET price jump to continue in the coming weeks.
Aptos Heads to the Moon
APT has surged 296% in the past 30 days to become the highest performer in the top 50 ranked cryptocurrencies by market capitalization.
Aptos is a Layer 1 proof-of-stake (PoS) blockchain that is popular for its unique scalability of about 150,000 transactions per second (tps).

Like AGIX, APT is another altcoin with a triple-digit rally driven by increased whale activity.
There are a few reasons whales have been piling on the APT altcoin in the past weeks. Firstly, increasing interest in the blockchain non-fungible tokens (NFTs) and the recent Aptos World Tour Hackathon set off a chain of positive social sentiments, as shown in the data compiled by Santiment.

Social Dominance is a metric that measures the share of a token’s mentions in crypto-related digital media. Following the successful Aptos World Tour NFTs, the social dominance of the Layer 1 network rose to 0.4% in a 48-hour period that culminated in a mild price surge.
How High Can Aptos Go?
After delivering nearly 300% growth year-to-date, interest in Aptos is cooling off. Denoted by the Futures Open Interest reported by Coinglass, the rate of new demand for the APT token has declined considerably since Jan. 25.
However, on-chain data compiled by DefiLlama shows that DeFi lending and trading protocols on the proof-of-stake network have continued to attract a decent volume of locked liquidity, which could brace the volatility in the short term.

In less favorable terms, Aptos’ open interest has declined persistently over the past 14 days. While the price has only dipped from $18 to $15, open interest has dropped considerably higher, with a 24.7% net change since Jan. 26, according to Coinglass.

Likewise, the corresponding increase in APT/USD short positions opened means that whales might be bracing up to profit from an impending price correction.

The APT Long/Short Ratio has taken a bearing trend in the last 14 days. The ratio has persistently remained below 1 since the close of Jan. This shows that whales are primed for a massive APT correction in the coming weeks.
Fantom Has Been on a March Since Dec
Fantom (FTM) is another high-performing altcoin that has delivered more than a 100% return in 2023.
FTM’s strong start to the year did not surprise many, as on-chain data revealed that Whale transaction volumes on Fantom began to trend upward back in Dec. Weeks before the global crypto market entered the Jan. rally.
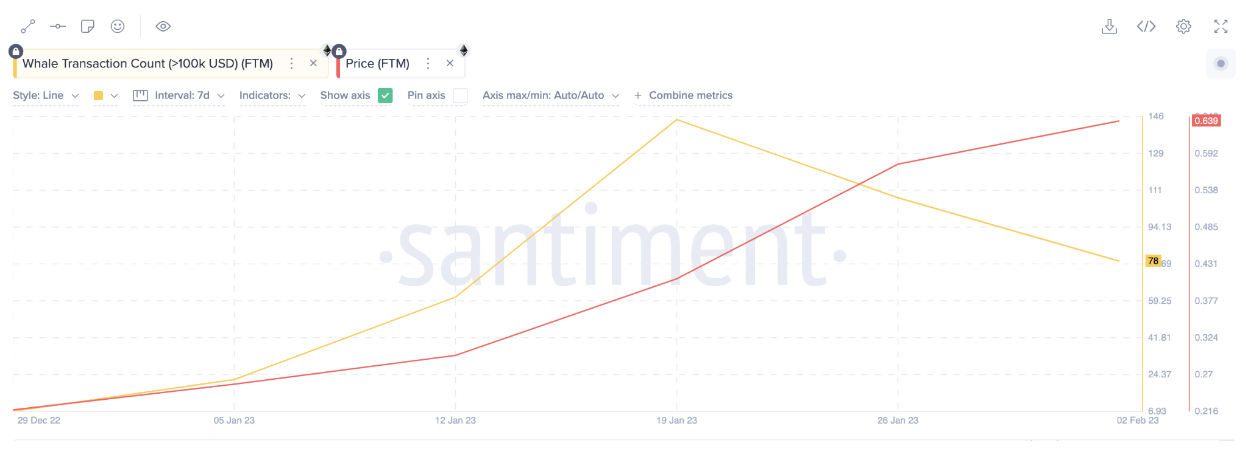
Although FTM prices stayed flat until the second week of Jan., the on-chain data provided by Santiment showed a Dec. surge in FTM Whale Transaction Count. This intense whale activity set the pace for the Jan. rally that has now entered its second month. But how far can Fantom sustain this bullish trend?
How High Can Fantom (FTM) Go?
FTM remained under the radar for the first week of Jan. But since mid-Jan., the price resurgence has grown steadily to reach a 2023 peak of $1.8 billion in market capitalization. An analysis of current on-chain sentiment shows that there might be room for another mild Fantom surge in Feb.

In bullish terms, the net flow of FTM deposits and withdrawals across top exchanges has declined considerably over the past 14 days, according to recent data published by IntoTheBlock.
A negative exchange net flow is a bullish signal. It indicates that more FTM holders are moving the tokens off exchanges in a bid to hold for longer than those looking to pile on sell-pressure on exchanges. The increased scarcity of FTM on exchanges could power a mild rally in the short term.

Similarly, the In/Out of the Money (IOMAP) cluster strength ratio shows that FTM is more likely to conquer the $0.67 resistance than slip below the $0.35 support.
Historically, most crypto holders usually make large sell transactions once current prices approach the break-even point. IntoTheBlock’s IOMAP data uses on-chain information about purchase prices of FTM tokens currently held in wallets to predict potential short-term movement in prices.

Also, social sentiment is showing green signals for a potential FTM surge in Feb. Santiment data reveal that FTM has persistently dominated discourse in the crypto space since mid-Jan., and the trend has gone up a notch in the first week of Feb. And importantly, the weighted sentiment analysis is considerably skewed towards a positive outlook.
The Decline in Bitcoin Dominance May Trigger a Bearish Turn
While altcoin on-chain activity by whales may paint an optimistic picture for the coming weeks, a persistent decline in BTC dominance may trigger a bearish turn.

The strong BTC resistance, around $23,000 to $24,000, has seen whales focus on alternative crypto investing opportunities, resulting in a 1.3% decline in BTC Dominance, indicating that whales are increasingly paying attention to the altcoin markets.
This is a major concern for investors because, historically, BTC.D dominance has been positively correlated with global cryptocurrency market capitalization.
Rounding up, in the first week of Feb., whales have shown renewed interest in altcoins, with increasingly large transaction volumes. But on-chain data shows they are opening more BTC short positions to front-run a potentially flat Feb.
