


BeInCrypto takes a look at Bitcoin (BTC) on-chain indicators, more specifically the HODL wave, in order to determine the age of coins that are currently moving.
BTC HODL wave
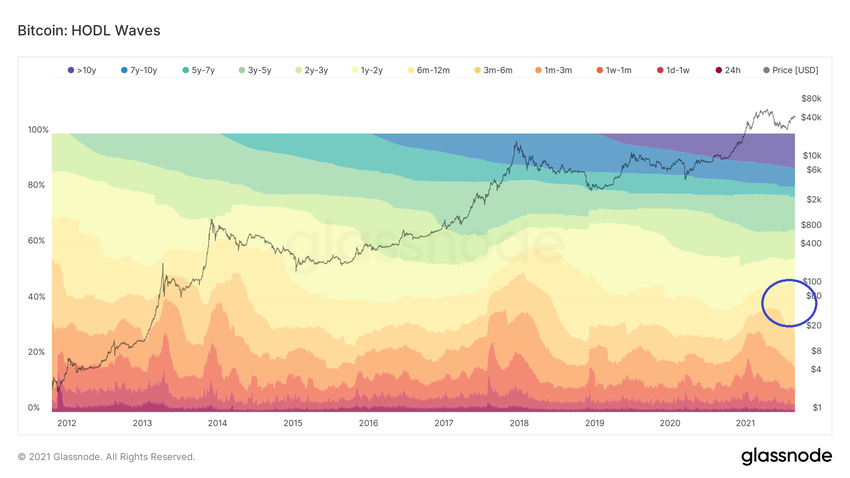
The HODL wave shows what percentage of the total supply of BTC has moved in a specified period of time. For example, if the HODL wave bands of three – six months encompass a range of 20%, this means that 20% of the total BTC in existence previously moved between three and six months ago.
When looking at the indicator, the first thing that is initially noticeable is the increase of the six month – 12 month bands (blue circle). This has occurred as a result of the decrease of bands smaller than 6m, while those larger than 12m have stayed the same.
Bands smaller than 6 months have been decreasing since June. This means that the BTC bought up to six months before June has not moved, rather it has matured into bands larger than six months, in turn providing the increase in the 6m-12 band.
Short-term readings
As stated above, the 3m – 6m band has been decreasing since June. At the time, it was showing a high of 15%, while it is currently at 7%.
In June, the band comprised of those that had bought BTC between Dec 2020 and Feb 2021 (vertical black lines). Since those BTC are now maturing into the 6m-12m bands, it means that people that bought during that time are not selling, rather they are continuing to hold.
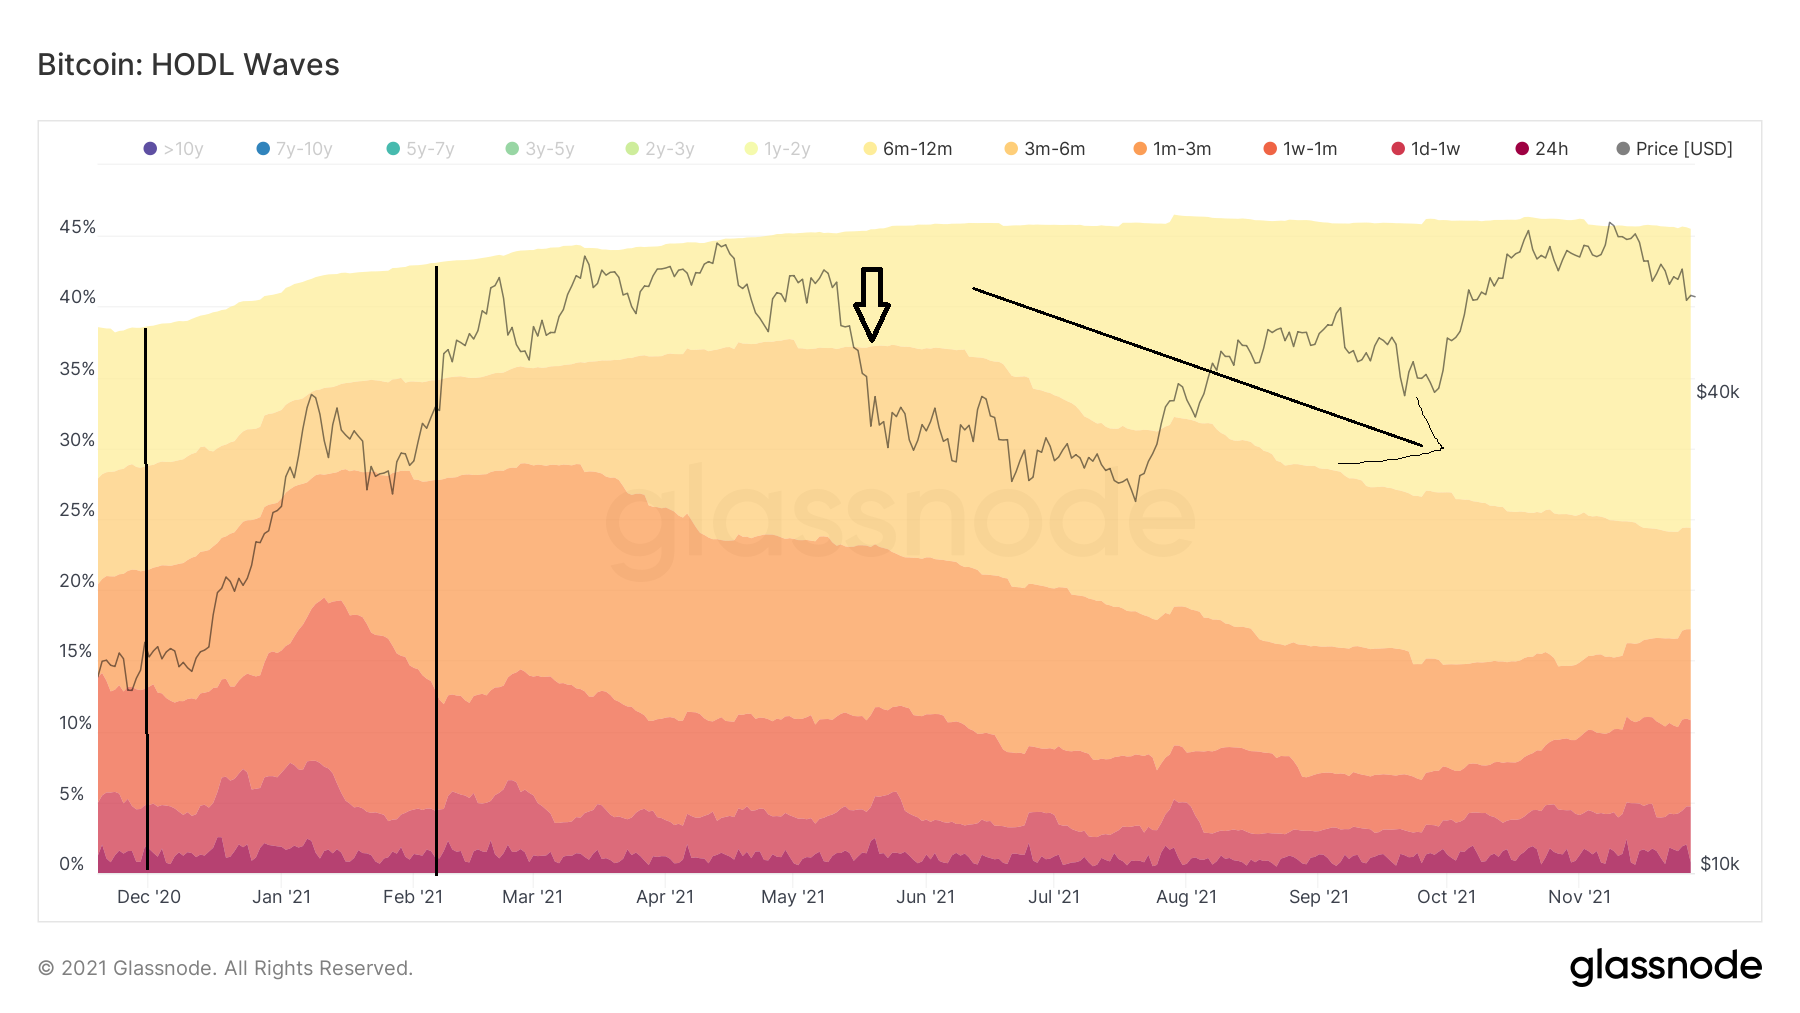
Interestingly, there has been an increase in the one week – three month bands going on since Oct. This has also likely occurred as a result of the decrease in 3m-6m bands.
This means that people who bought between April – July 2021, are now selling. Since the 3m-6m band is also decrease in Oct, it is likely that the sellers are close to July than April.
Therefore, those who bought the local bottom in July have started to take some profit.

For BeInCrypto’s latest Bitcoin (BTC) analysis, click here.


