


Be[in]Crypto takes a look at bitcoin (BTC) on-chain indicators that have historically been used to determine market cycle bottoms.
There are several indicators that can be used in order to determine market cycle bottoms, the majority of which have been reached only several times throughout the entirety of BTC’s price history.
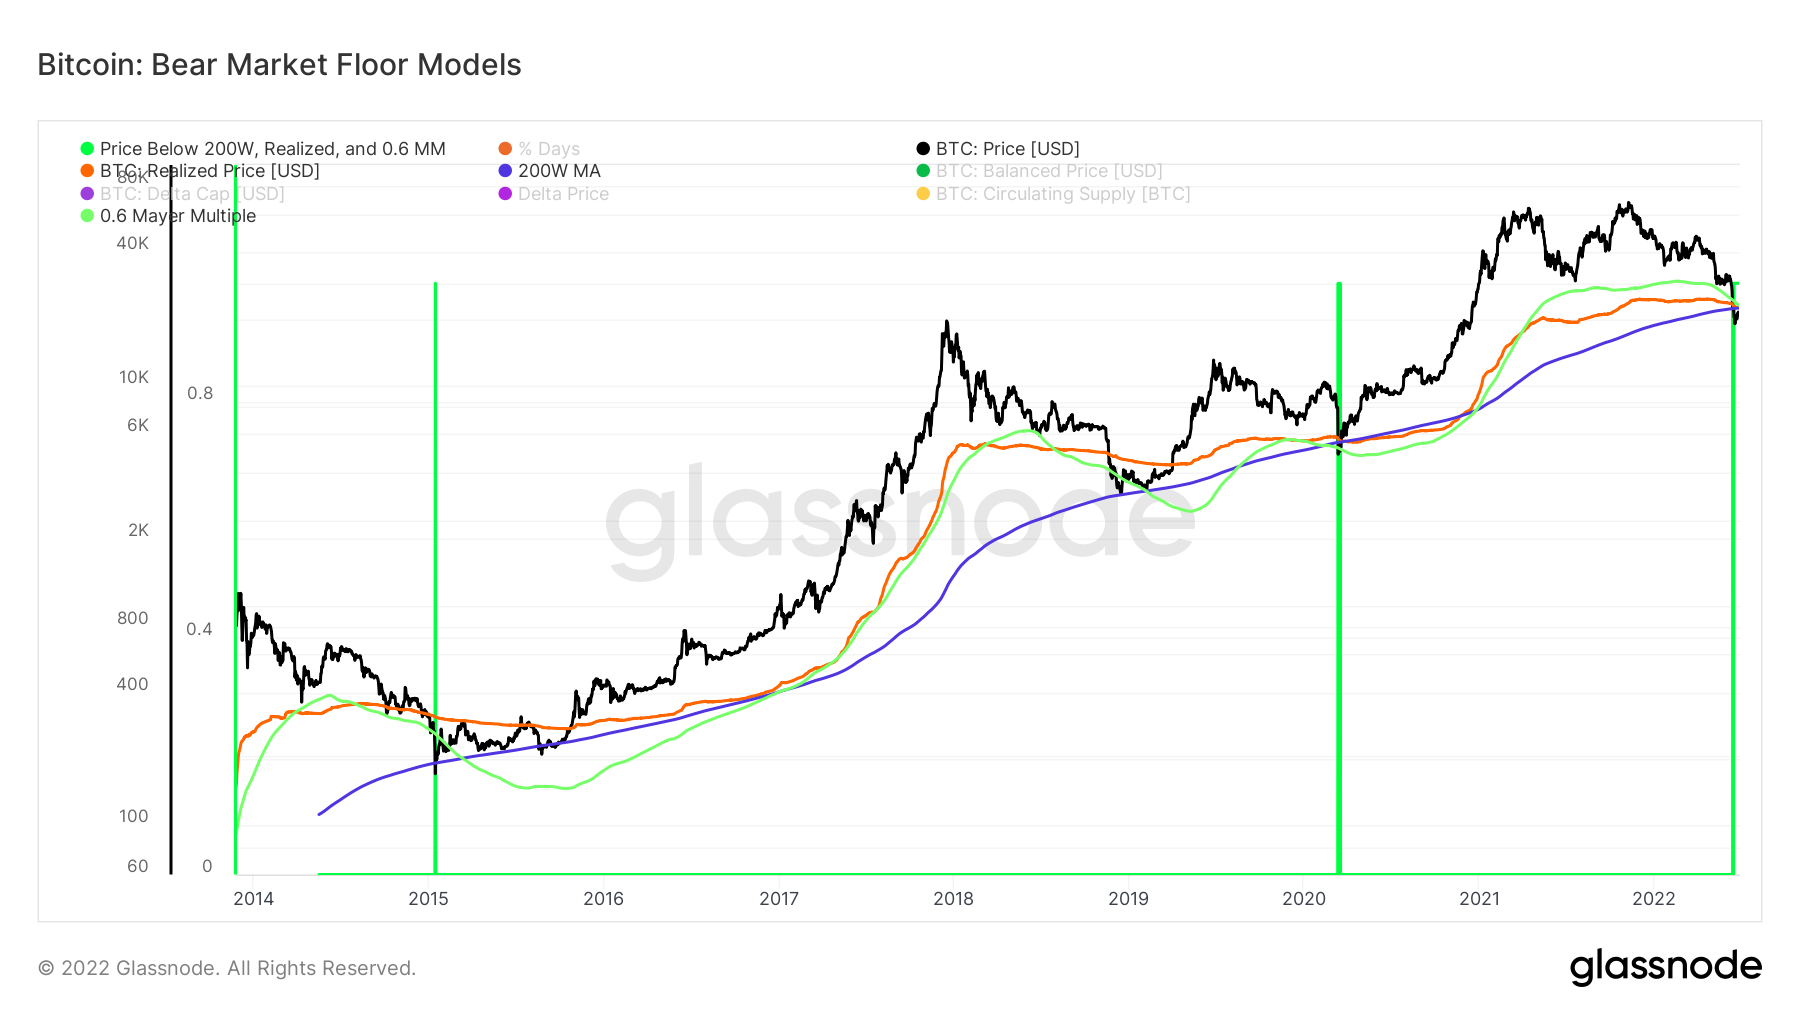
The indicators analyzed (along with the colors in which they are presented in the charts) will be :
- Mayer Multiple of 0.6 (green) – An oscillator created by the ratio between the BTC price and its 200-week MA.
- Realized price (orange) – The cost basis of BTC’s supply, measuring the price at the time it last moved.
- 200-week moving average (blue) – A 200-week simple moving average (MA).
- Balanced price (green) – The difference between realized and transfer price
- Delta price (purple) – The difference between the realized and all-time average price
Historical BTC reading
Even though BTC has been decreasing since Nov. 2021, it approached its bear market floor models in the beginning of May 2022. The ensuing sharp fall caused it to break down below levels not seen since March 2020.
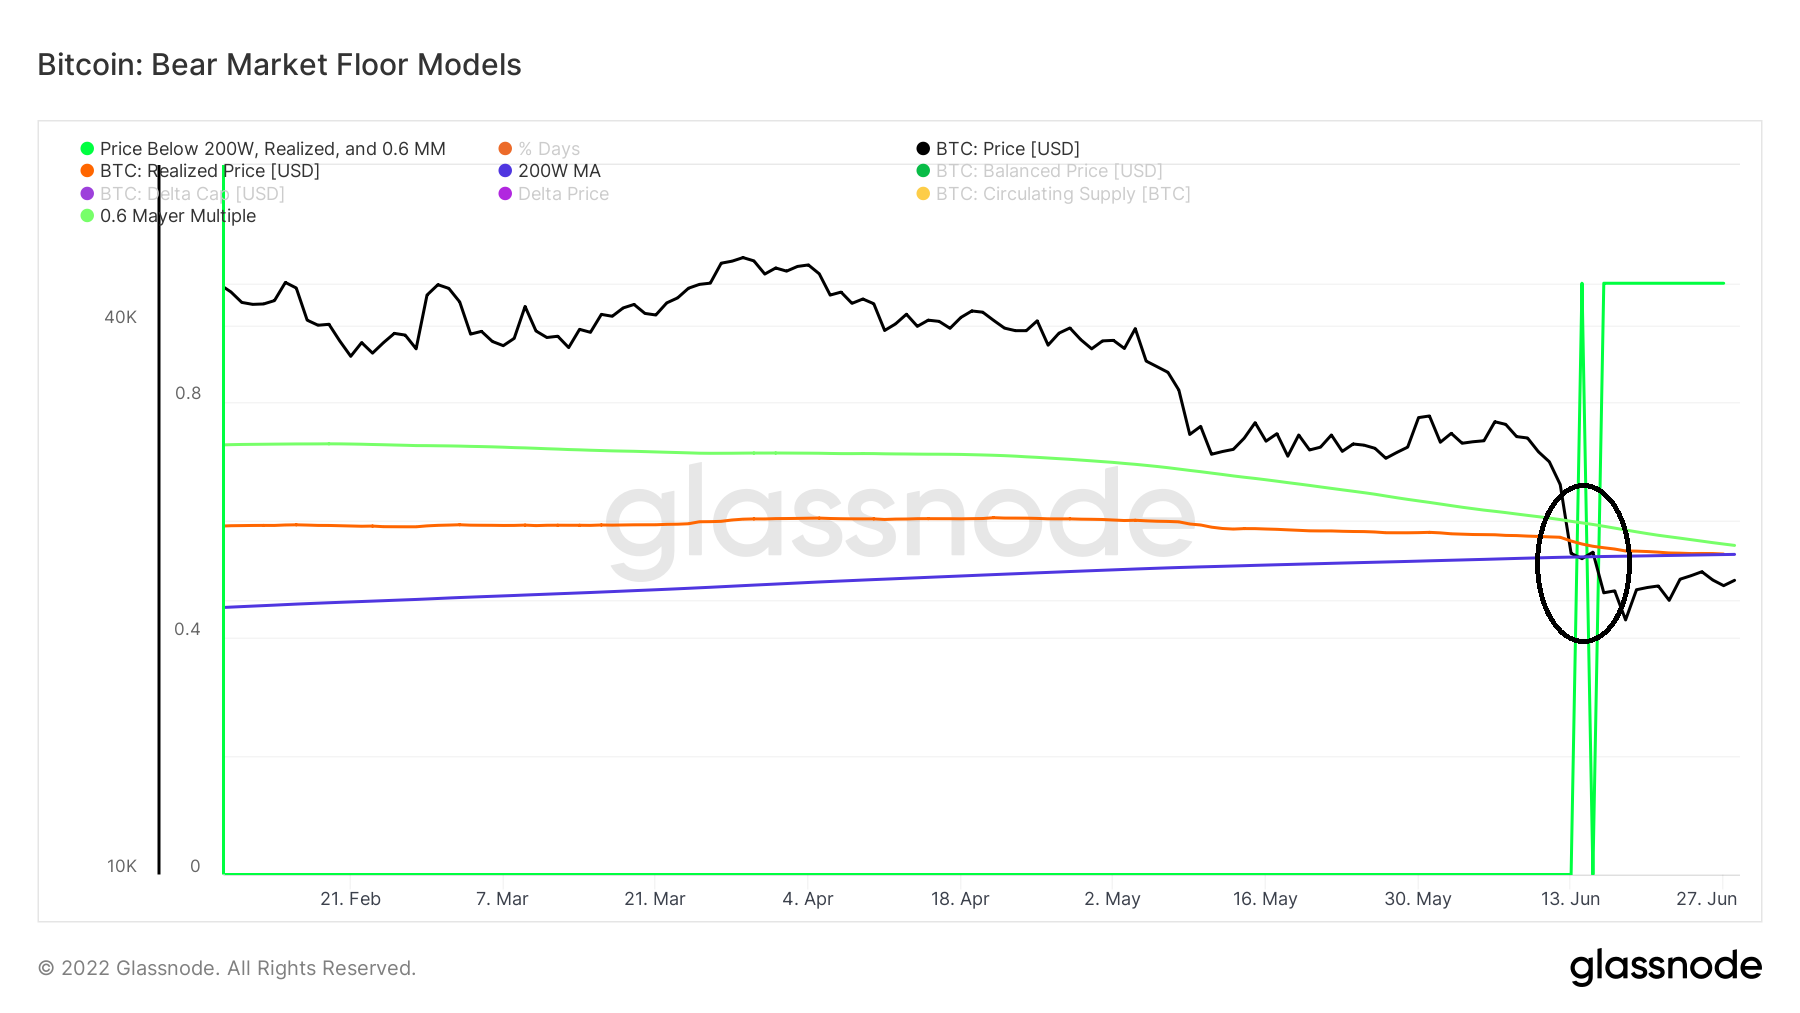
Currently, the BTC price is trading below its Realized price, the 0.6 Mayer multiple, and the 200-week MA, which are close to $23,000. This has only occurred twice before in history (green vertical lines).
Since BTC fell below these levels on June 16 (black circle), this is the longest period of time in which it has done so.
As a result, it is safe to say that according to these indicators the BTC price has never been this oversold throughout its entire history.
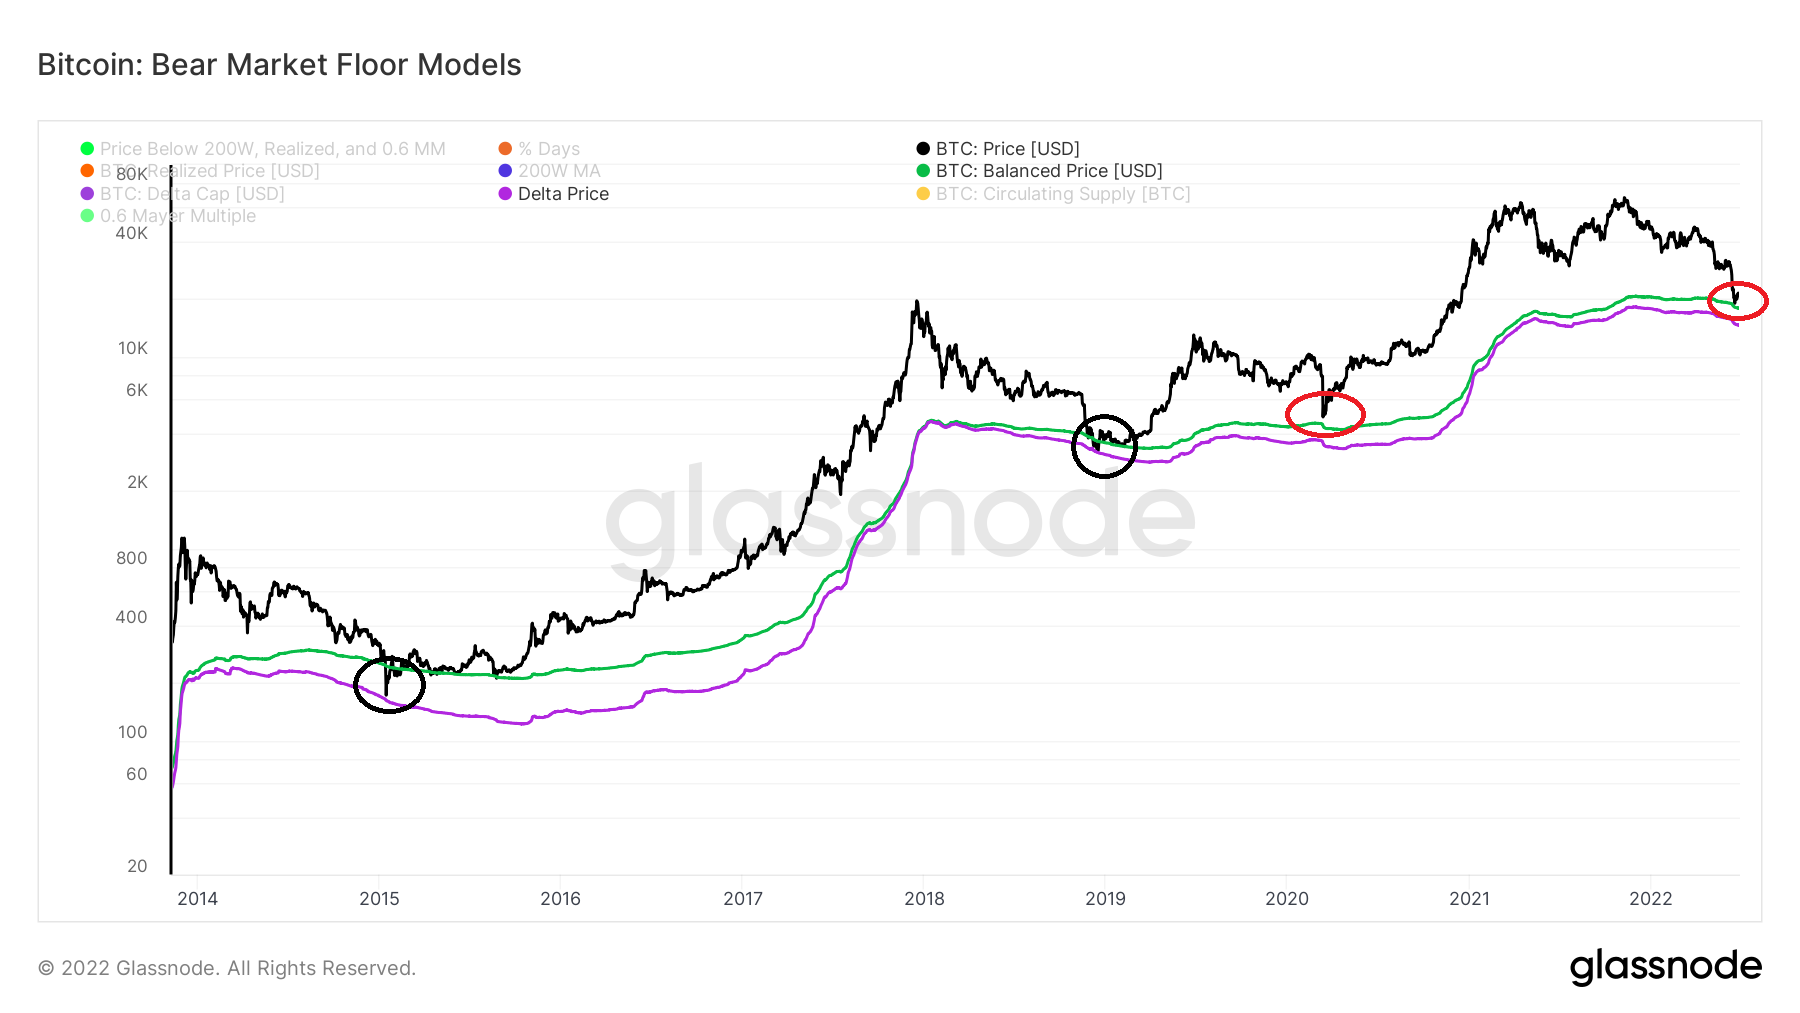
Balanced and delta price
Next, the balanced (green) and delta (purple) prices have often acted as absolute or relative bottoms during sharp downward movements. Most recently, BTC bounced at the balanced price (red circle) in March 2020, initiating the upward movement that led to the all-time high. Another similar bounce (red circle) could now be in motion.
Unlike the balanced price, which was also reached in March 2020, the delta price has only been reached in Jan. 2015 and 2019 (black circles).
Its line is currently at $14,700 and would be expected to provide strong support if the price were to drop to it.
For Be[in]Crypto’s latest bitcoin (BTC) analysis, click here


