
Hedera (HBAR) has dropped 20% in the last seven days, extending its decline below $0.24, a level it has failed to reclaim for almost a week. The technical outlook remains bearish, with key indicators like EMA lines and the Ichimoku Cloud showing continued downward momentum.
However, signs of exhaustion in selling pressure are emerging. Whether HBAR stabilizes or continues its decline toward $0.17 will depend on its ability to reclaim critical resistance levels and attract renewed buying interest.
HBAR BBTrend Is Still Very Negative, Although It’s Steadily Recovering
Hedera’s BBTrend indicator currently sits at -15.92, marking its sixth consecutive day in negative territory.
While this suggests ongoing bearish momentum, the indicator has begun to cool, having reached a deeper negative peak of -22.99 just two days ago.
This shift implies that selling pressure may be weakening, even though the market remains in a downtrend. A gradual recovery in BBTrend could indicate a potential stabilization or even an upcoming reversal if buying activity starts to increase.
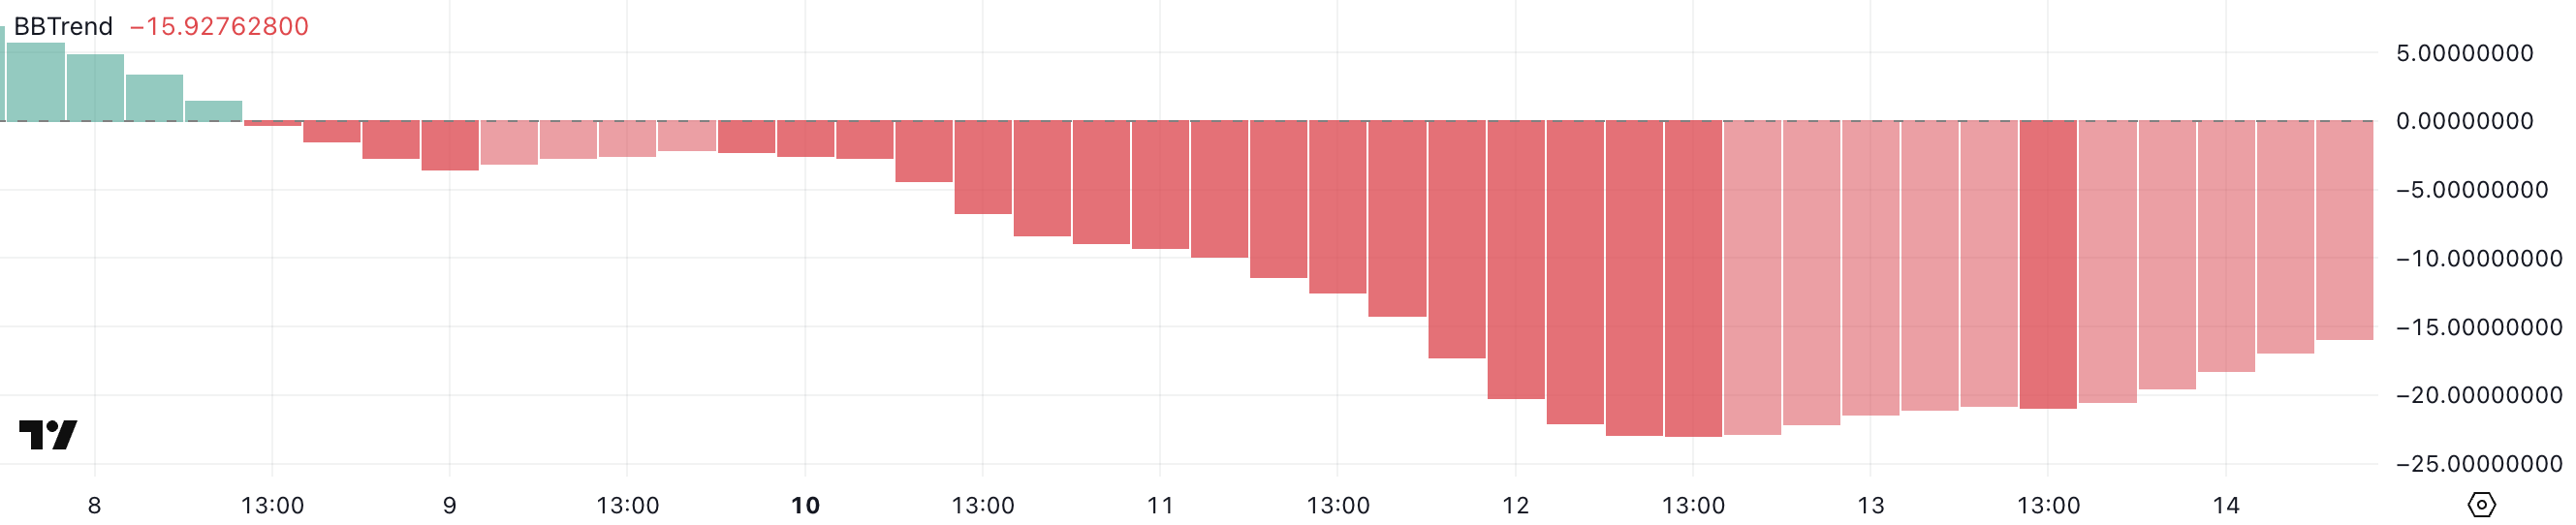
BBTrend, or Bollinger Band Trend, is a technical indicator that gauges market momentum by measuring price movement relative to Bollinger Bands.
When the BBTrend value is deeply negative, it signals strong bearish pressure, while a rising BBTrend – especially from extreme lows – often suggests that selling momentum is fading.
In HBAR’s case, the current reading of -15.92 still reflects weakness, but its recent move away from extreme lows could hint at a shift in sentiment. If this trend continues, it could pave the way for a relief rally or at least a temporary pause in the downtrend.
Hedera Ichimoku Cloud Shows a Bearish Setup
The Ichimoku Cloud analysis for Hedera shows a prevailing bearish trend, with the price trading below the cloud and the cloud itself turning red in the upcoming sessions.
This suggests that the market remains under selling pressure, with resistance levels above acting as strong barriers to any potential recovery.
The Tenkan-sen (blue line) and Kijun-sen (red line) are both positioned above the price, reinforcing the current downward momentum. Additionally, the price has struggled to break above these short-term resistance levels, indicating weak bullish attempts.
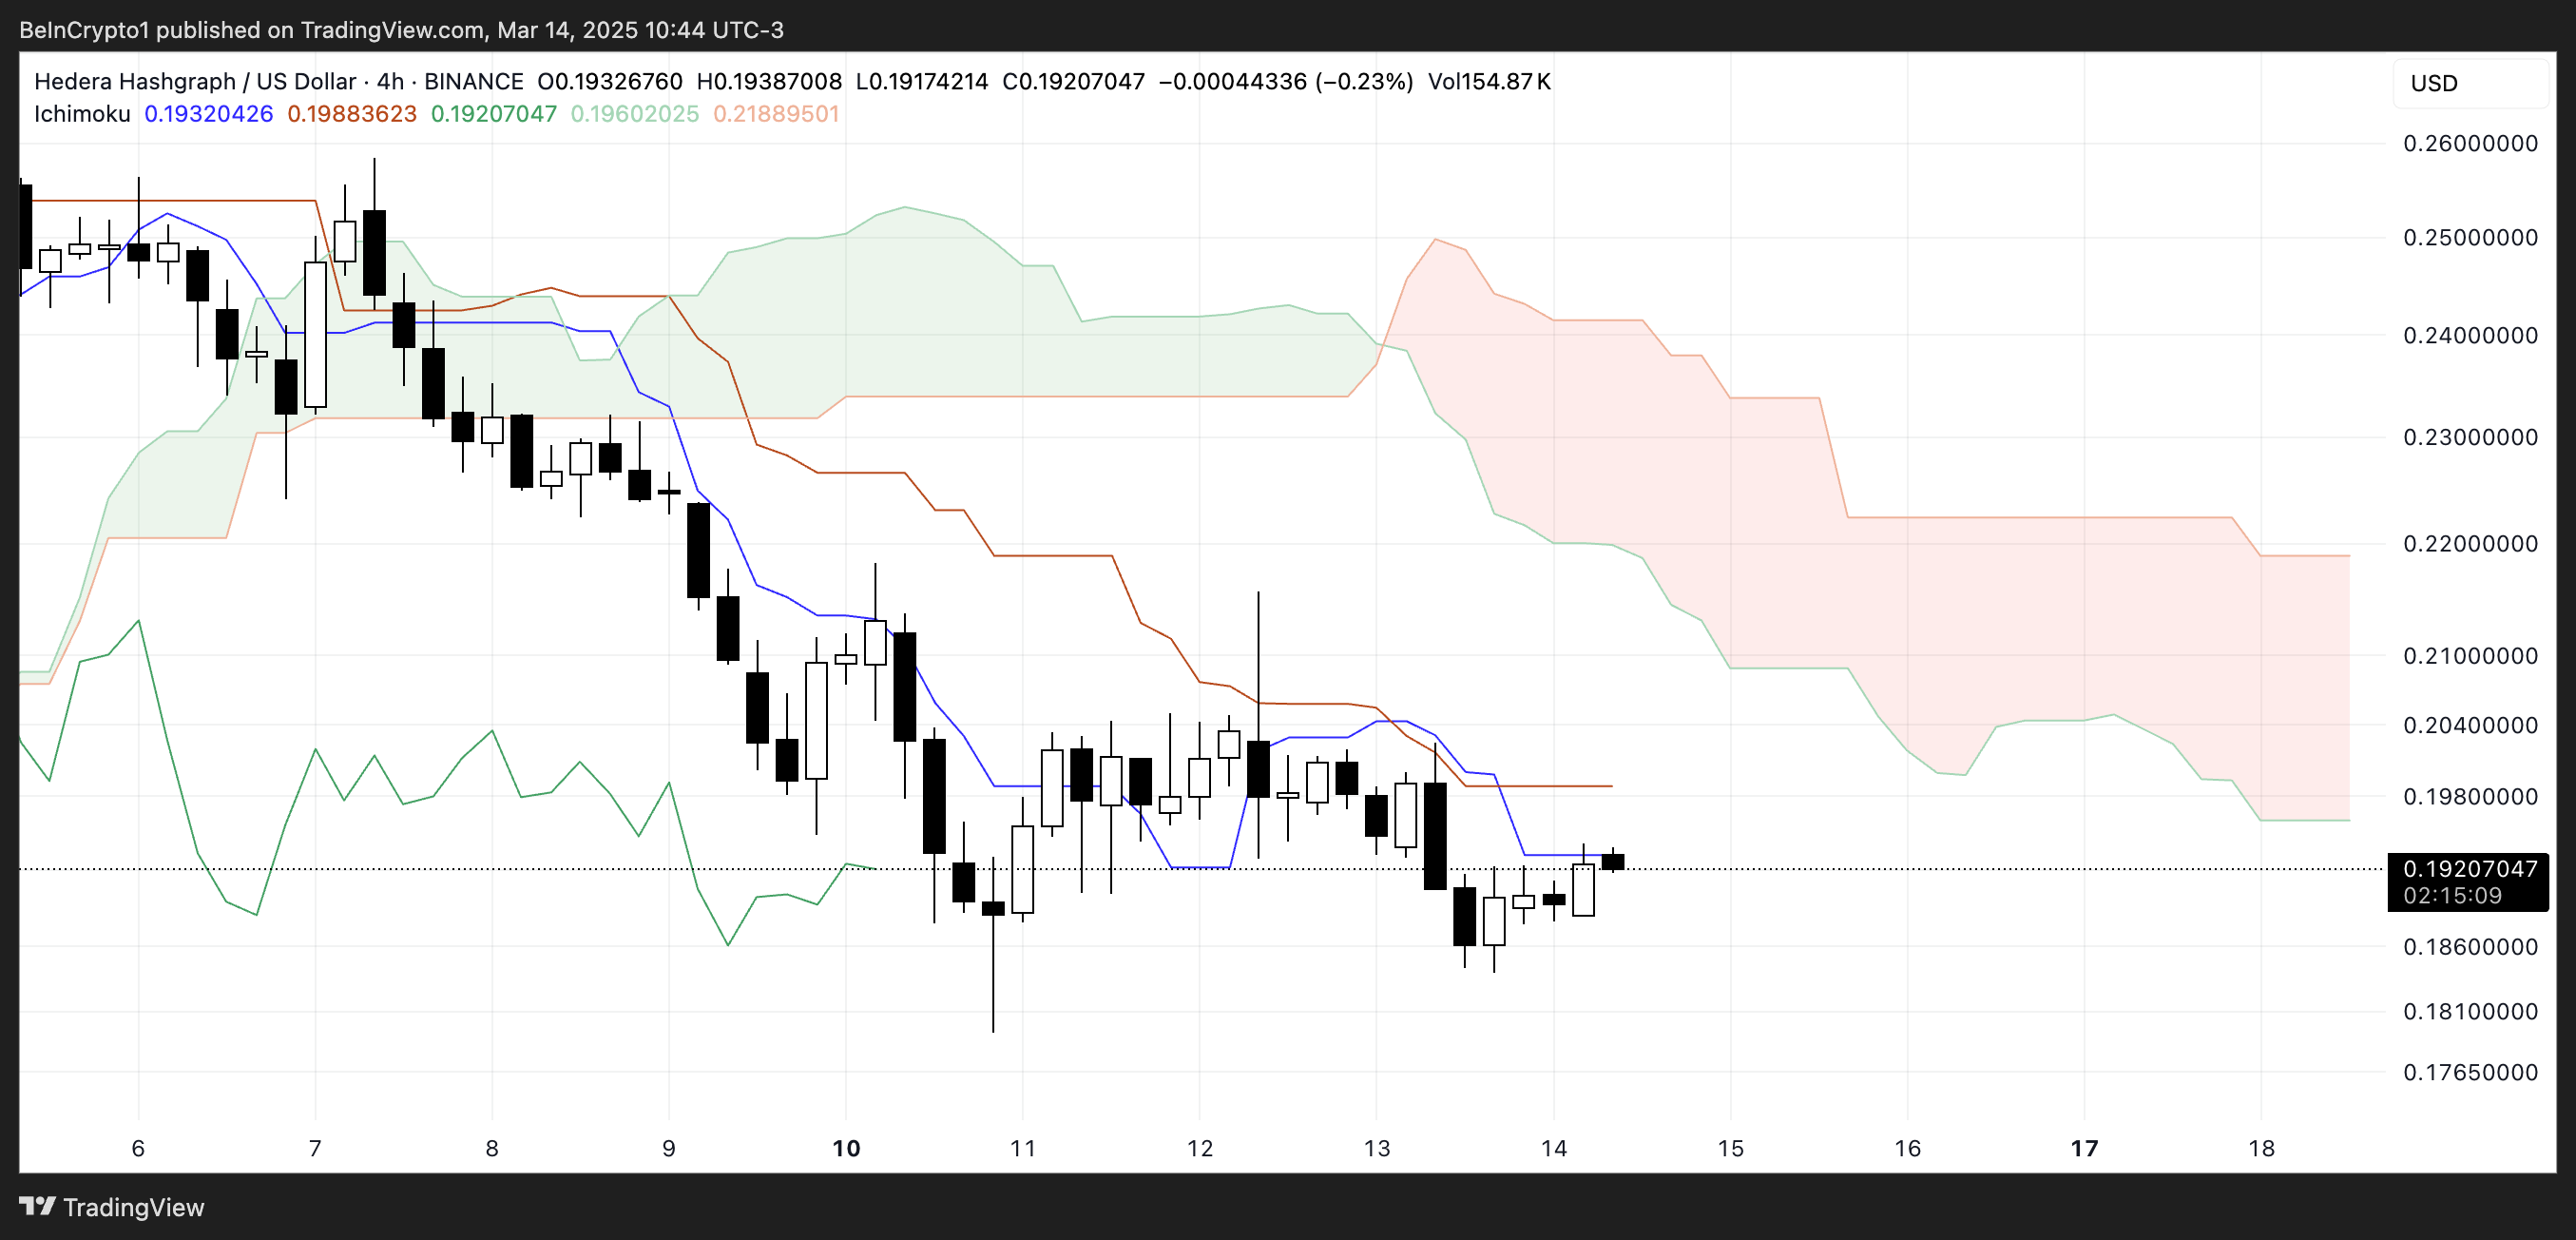
Looking ahead, for a potential trend reversal, HBAR would need to break above both the Kijun-sen and the lower boundary of the Ichimoku Cloud.
However, with the Senkou Span A (leading green line) and Senkou Span B (leading red line) widening downward, the bearish trend remains intact for now.
The presence of a red cloud in the future suggests that sellers still have control, and without a strong push above $0.20, price action is likely to remain constrained.
Until key resistance levels are reclaimed, further consolidation or a continuation of the downtrend remains the most probable scenario.
Will Hedera (HBAR) Fall Below $0.17 In March?
Hedera’s EMA lines indicate a clear bearish trend, with short-term moving averages positioned below long-term ones. This alignment suggests that downward momentum remains dominant, reinforcing the possibility of further declines.
If the current trend persists, Hedera’s price could test the $0.179 support level, which has previously acted as a critical price floor.
A break below this level could trigger additional selling pressure, potentially sending the price below $0.17 for the first time since November 2024, further extending the bearish outlook.
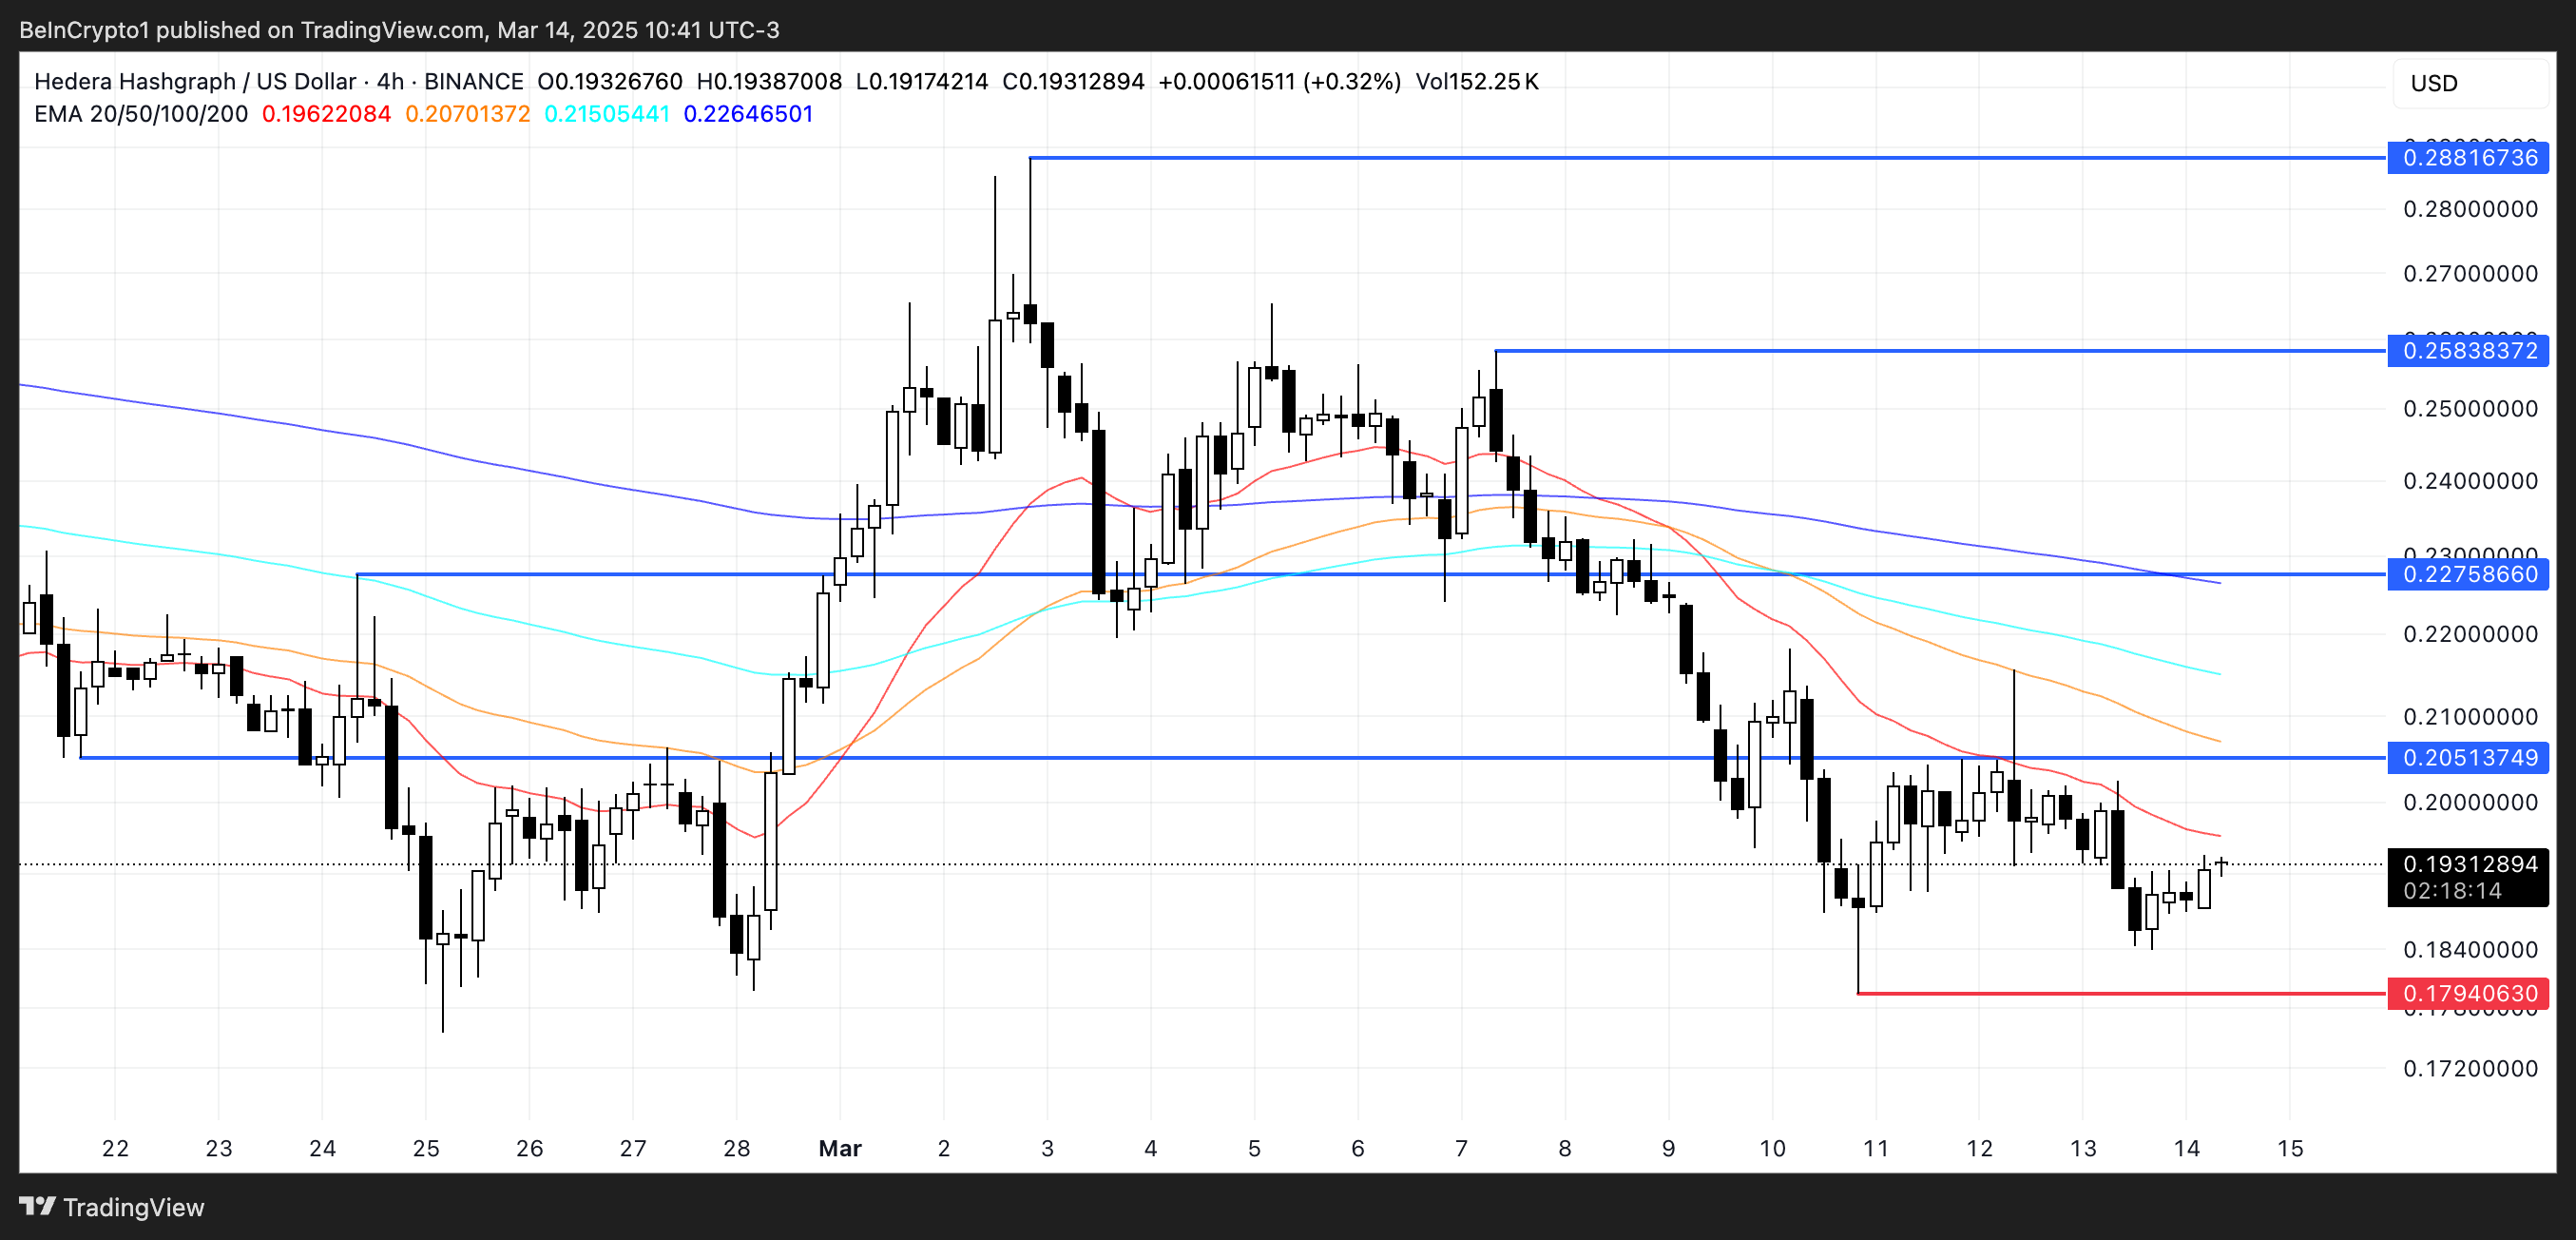
However, BBTrend data suggests that the downtrend may be losing steam, opening the door for a potential price reversal.
If buying momentum strengthens, HBAR could rise toward the $0.20 resistance level, a key threshold that could determine whether an upward move gains traction.
A successful breakout above $0.20 could pave the way for further gains toward $0.227, with stronger bullish momentum potentially pushing the price toward higher resistance levels at $0.258 and even $0.288.
