
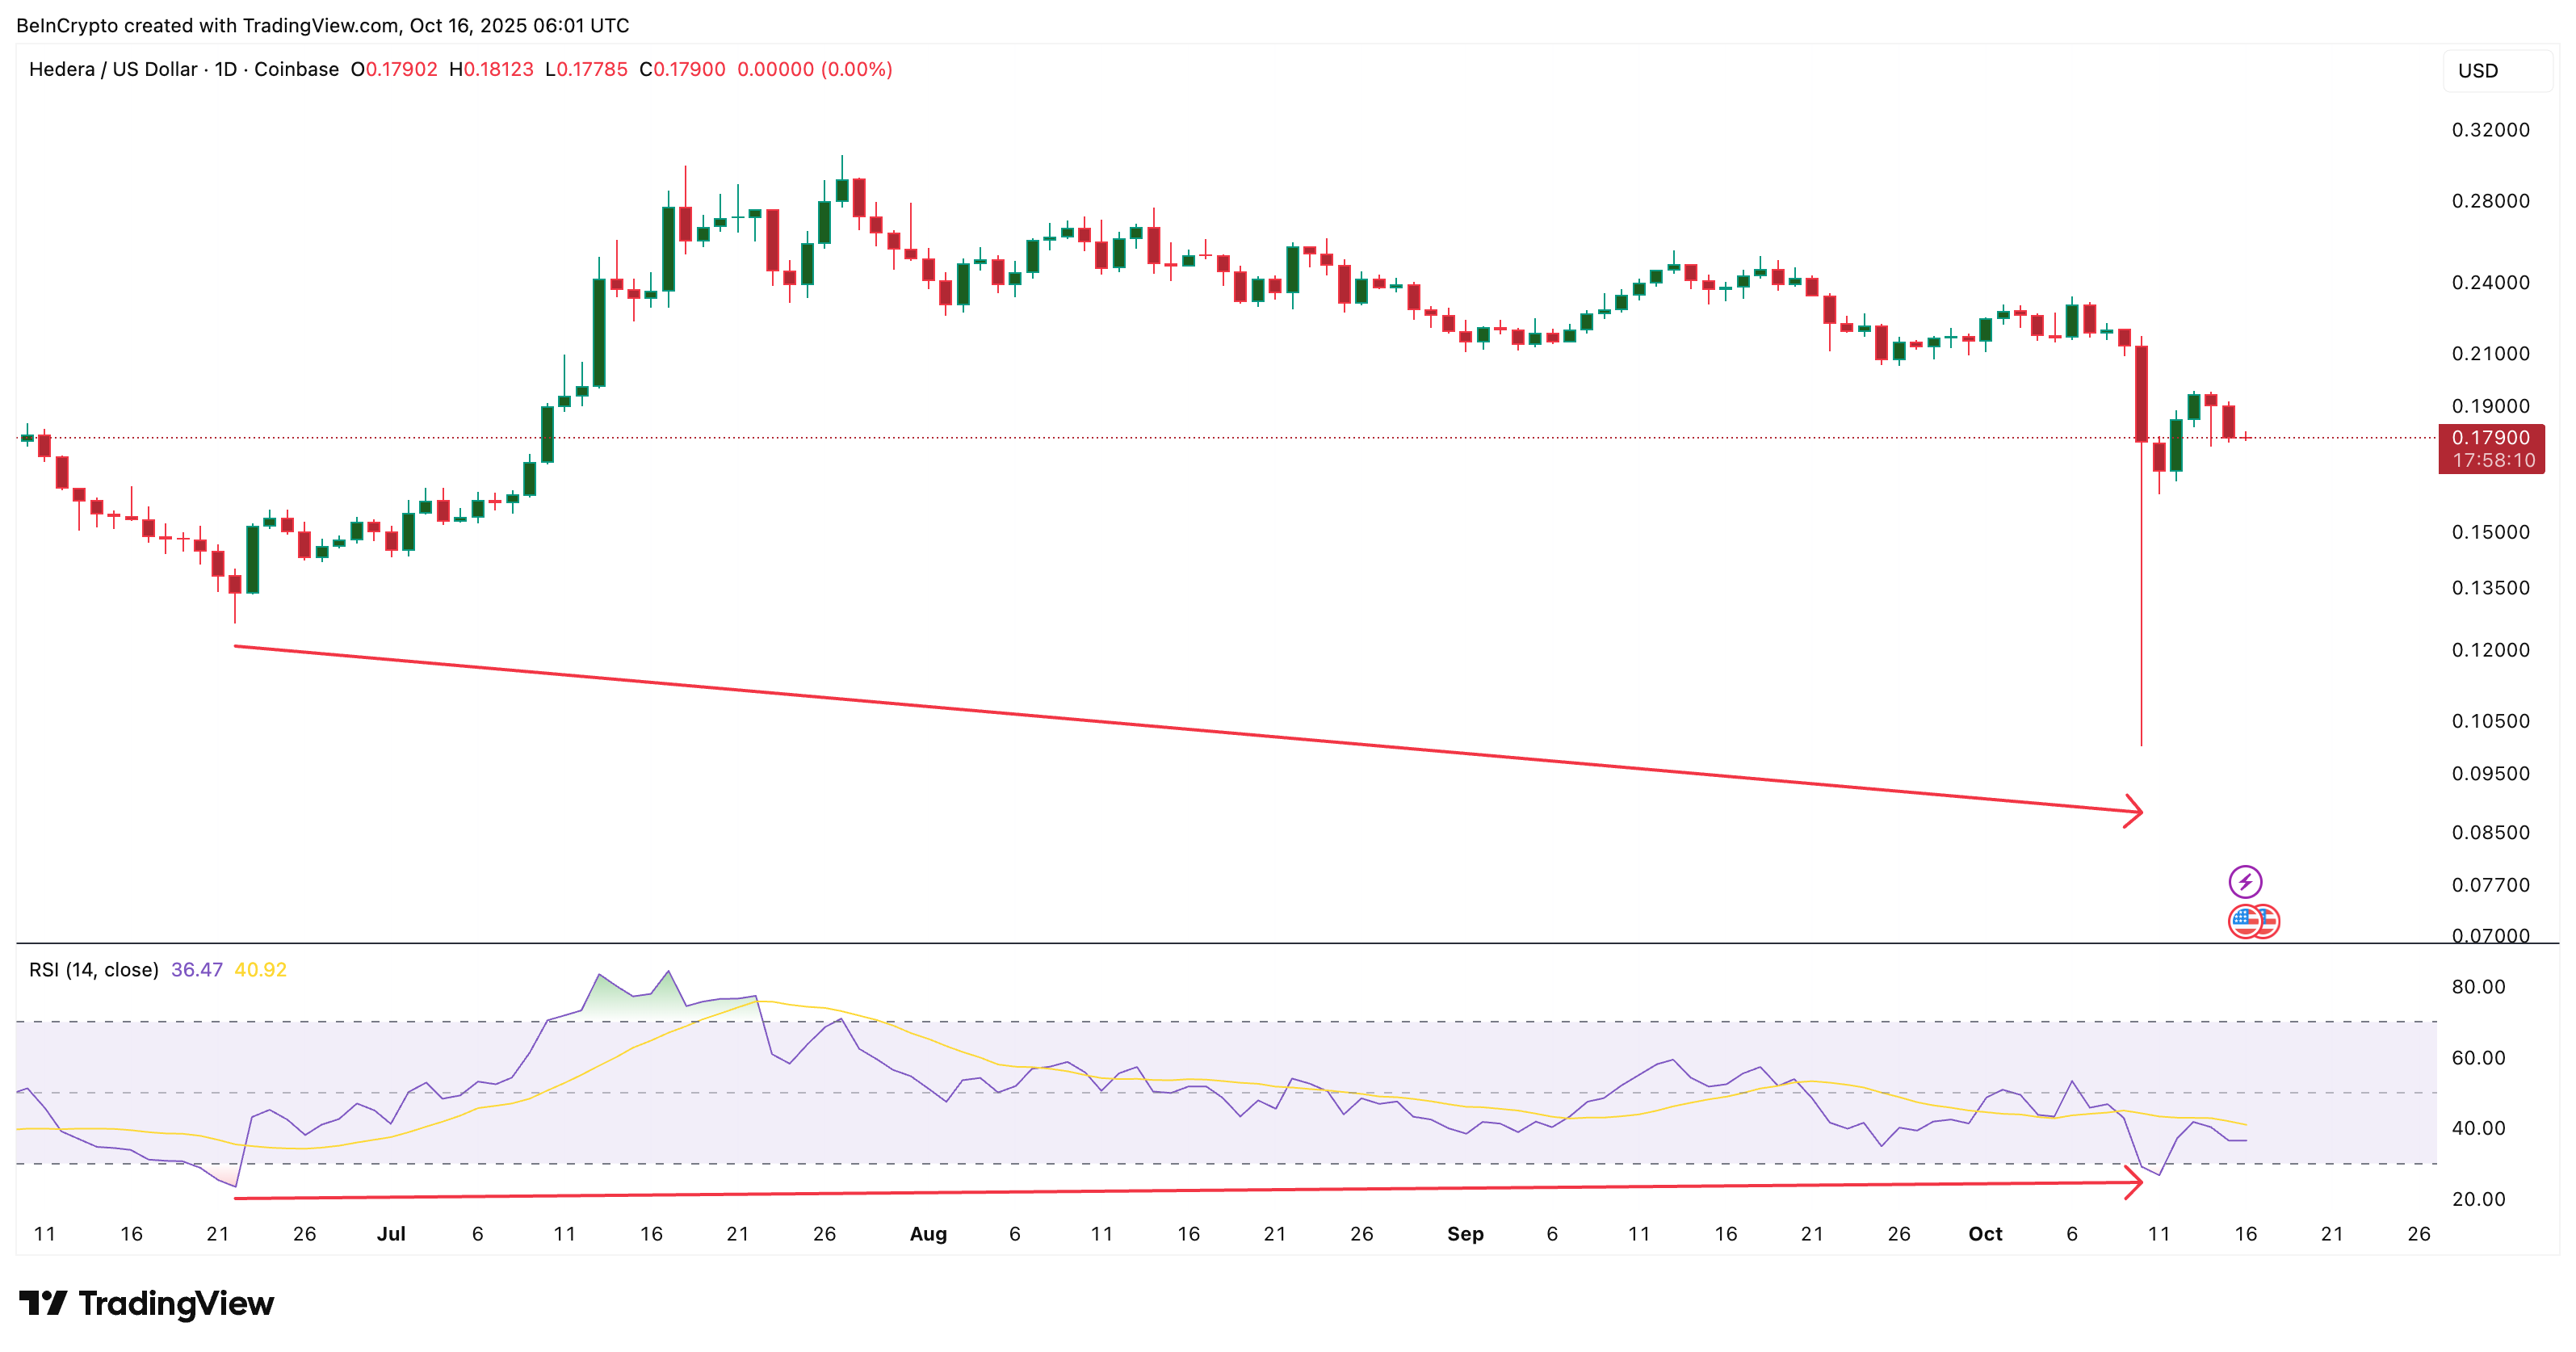
Hedera’s (HBAR) price has been sliding for weeks, down 5% in the past seven days. It is nearly 24% down over the past month. The token has struggled to break out of its downtrend, even as buyers tried to stabilize the price post the “Black Friday” crash.
However, a well-known technical signal and a steady flow of money into the asset now hint that a reversal might be forming. But only if HBAR can clear one critical price level.
Momentum and Money Flow Indicators Hint at a Reversal Attempt
When an asset stays in a long downtrend, traders often turn to indicators like the Relative Strength Index (RSI) to check if momentum is shifting. The RSI measures how fast and how strong price changes are — and right now, it’s flashing an early bullish divergence.
Between June 22 and October 8, HBAR’s price formed a lower low, while the RSI formed a higher low, a standard bullish divergence. This type of RSI divergence usually signals that sellers are running out of strength, and a trend reversal could be near.
The Chaikin Money Flow (CMF) supports this idea. CMF tracks how much money large wallets are moving in or out. Currently, it remains positive at 0.18, even after easing slightly in the last two days.
That means more money is still flowing into HBAR than out of it. It also suggests that overall interest hasn’t vanished despite the recent correction.
Want more token insights like this? Sign up for Editor Harsh Notariya’s Daily Crypto Newsletter here.

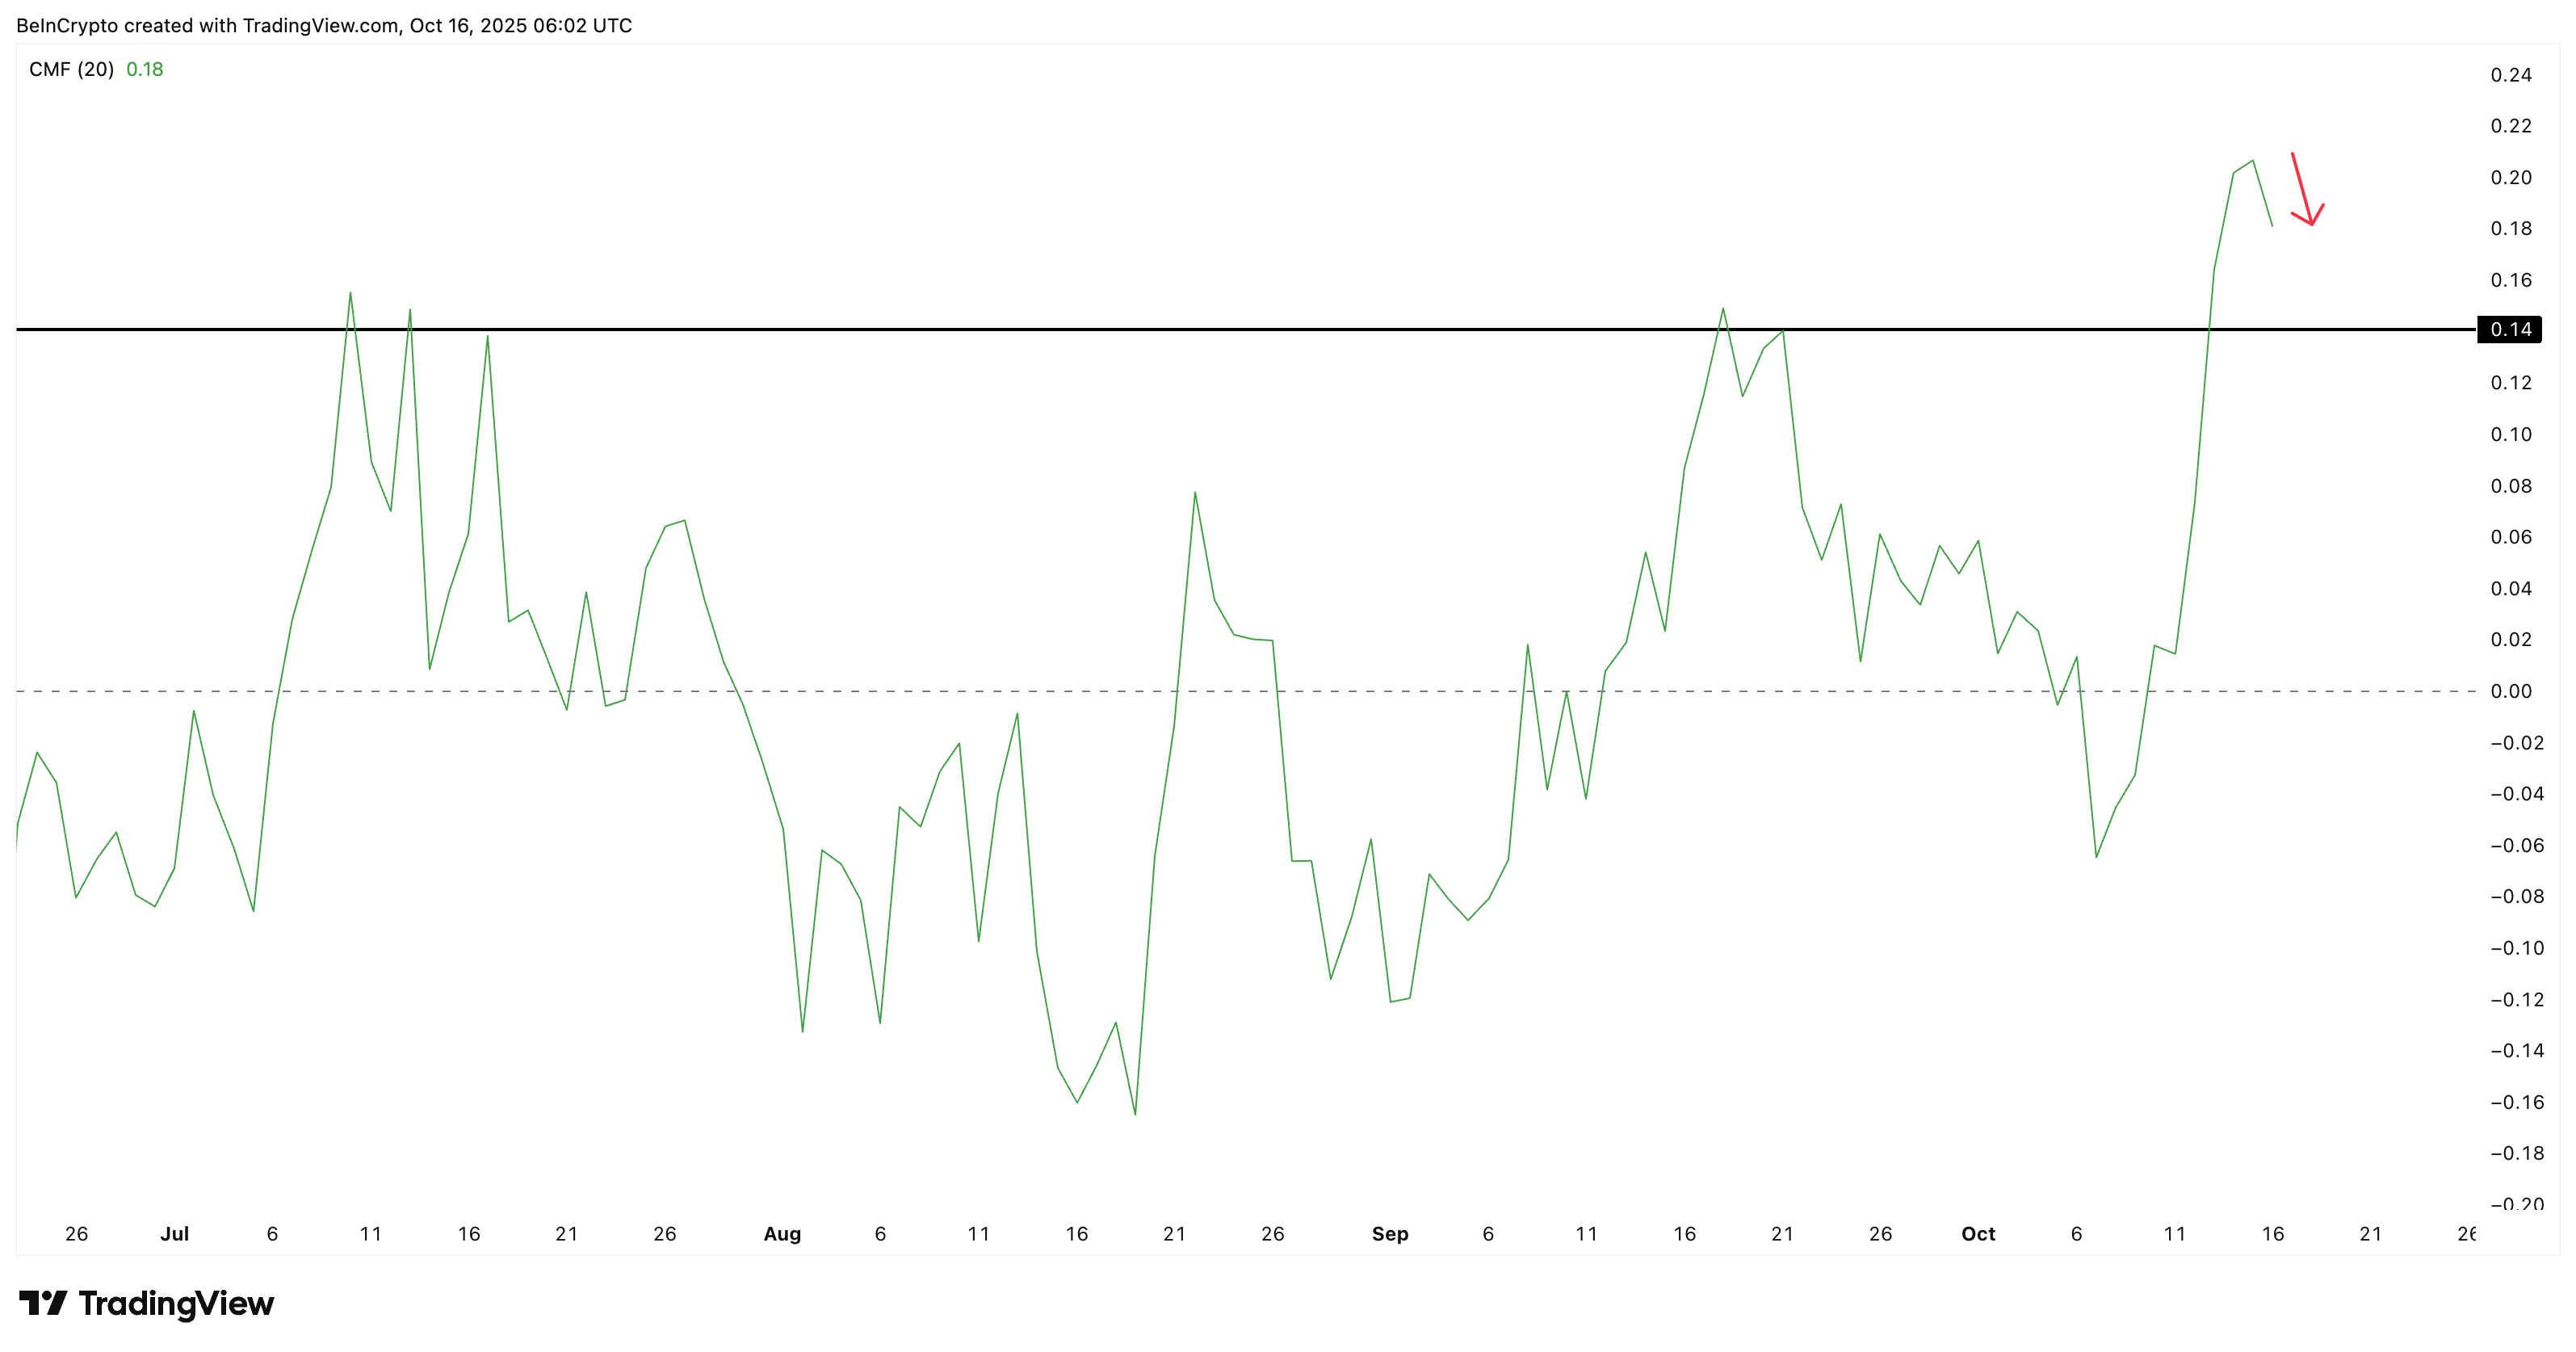
Still, traders should watch 0.14 on the CMF as the cutoff. If the CMF falls below that line, it would mean the flow of money is drying up.
HBAR Price Must Clear $0.19 for the Reversal to Hold
The HBAR price currently trades near $0.17, trying to hold above its immediate support zone of $0.16. The area around $0.19 has repeatedly stopped every move higher since October 11, acting as a strong ceiling (resistance).
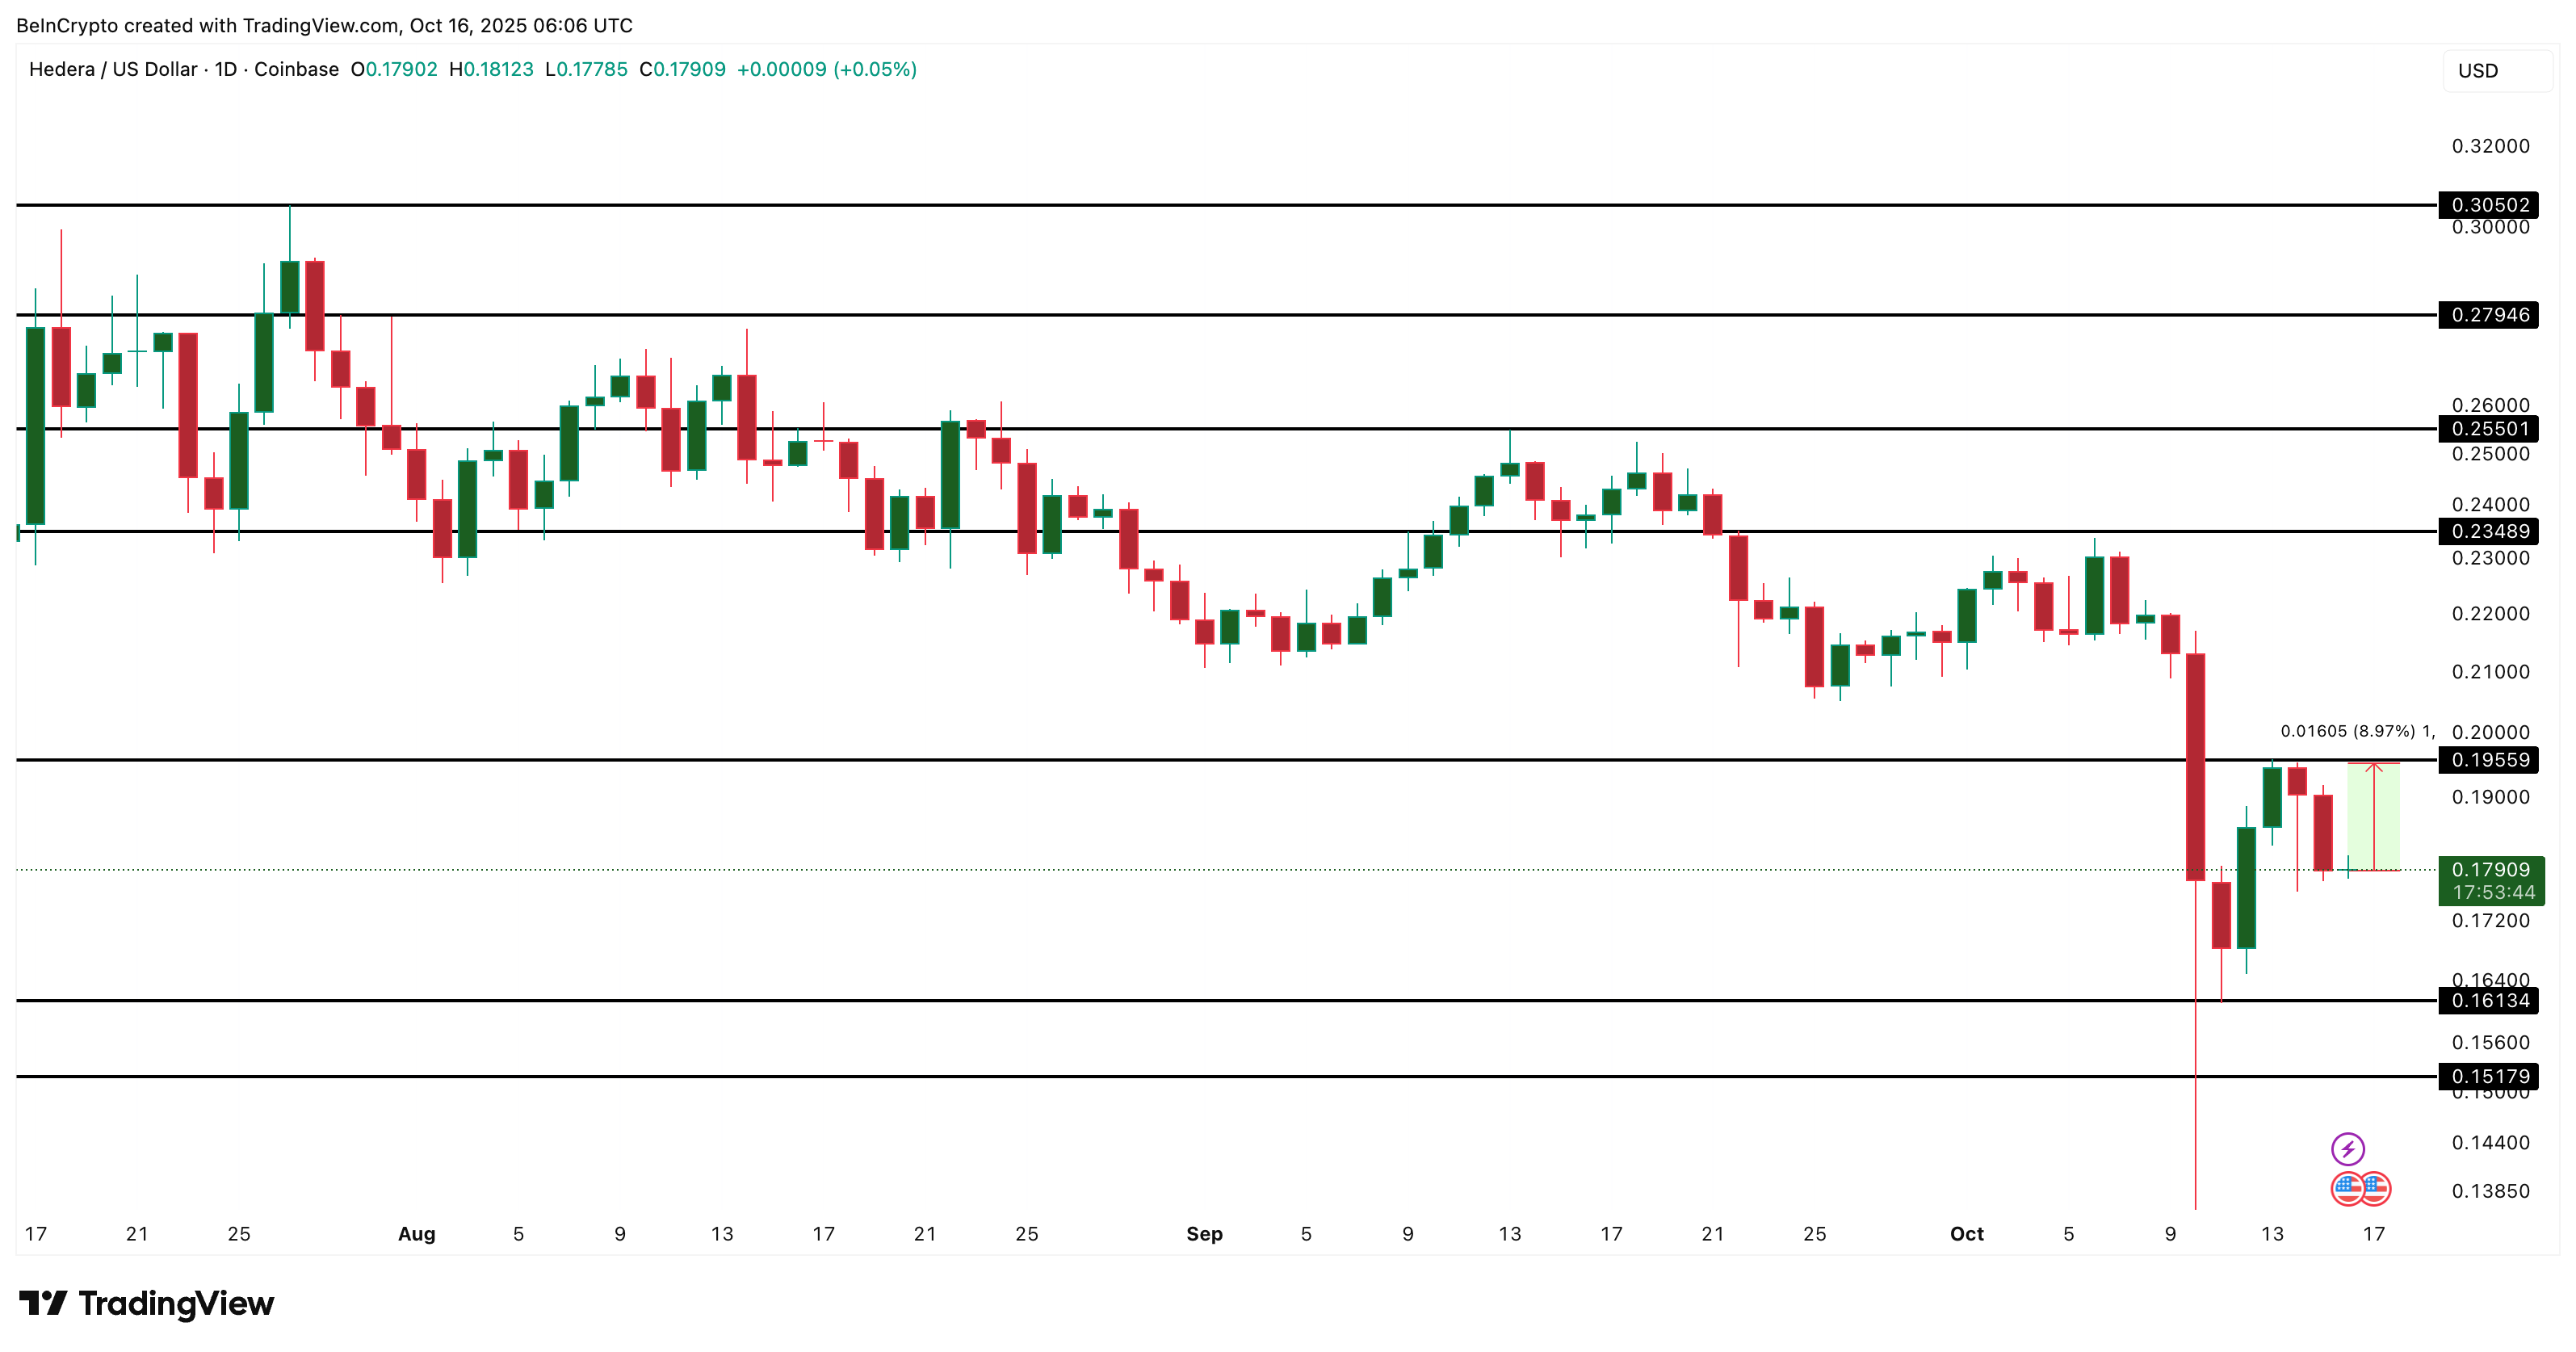
For HBAR to confirm a bullish reversal, it might first need to rise about 9%. Doing so, it would close above $0.19 on the daily timeframe. That breakout would show that buyers have finally absorbed the sell pressure at that level and are ready to push higher.
If HBAR manages to do that, the next resistance zones appear near $0.23 and $0.25, both marking previous swing highs. But if the token loses ground below $0.16, it could slide back toward $0.15, cancelling the bullish setup.
At this stage, the indicators show that HBAR is trying to form a base. Yet, momentum alone won’t be enough. The expected 9% jump above $0.19 is what will decide whether this turns into an actual reversal or just another short-lived bounce.
