
HBAR price has barely moved this week, but that calm may not last much longer. Trading near $0.24, it is up 2% in the past day and 66% over three months.
Behind the muted surface, money flow signals and chart patterns hint that HBAR’s long pause could be ending — and a bigger move may be close.
Big Money Flows In, While Smart Money Stays Cautious
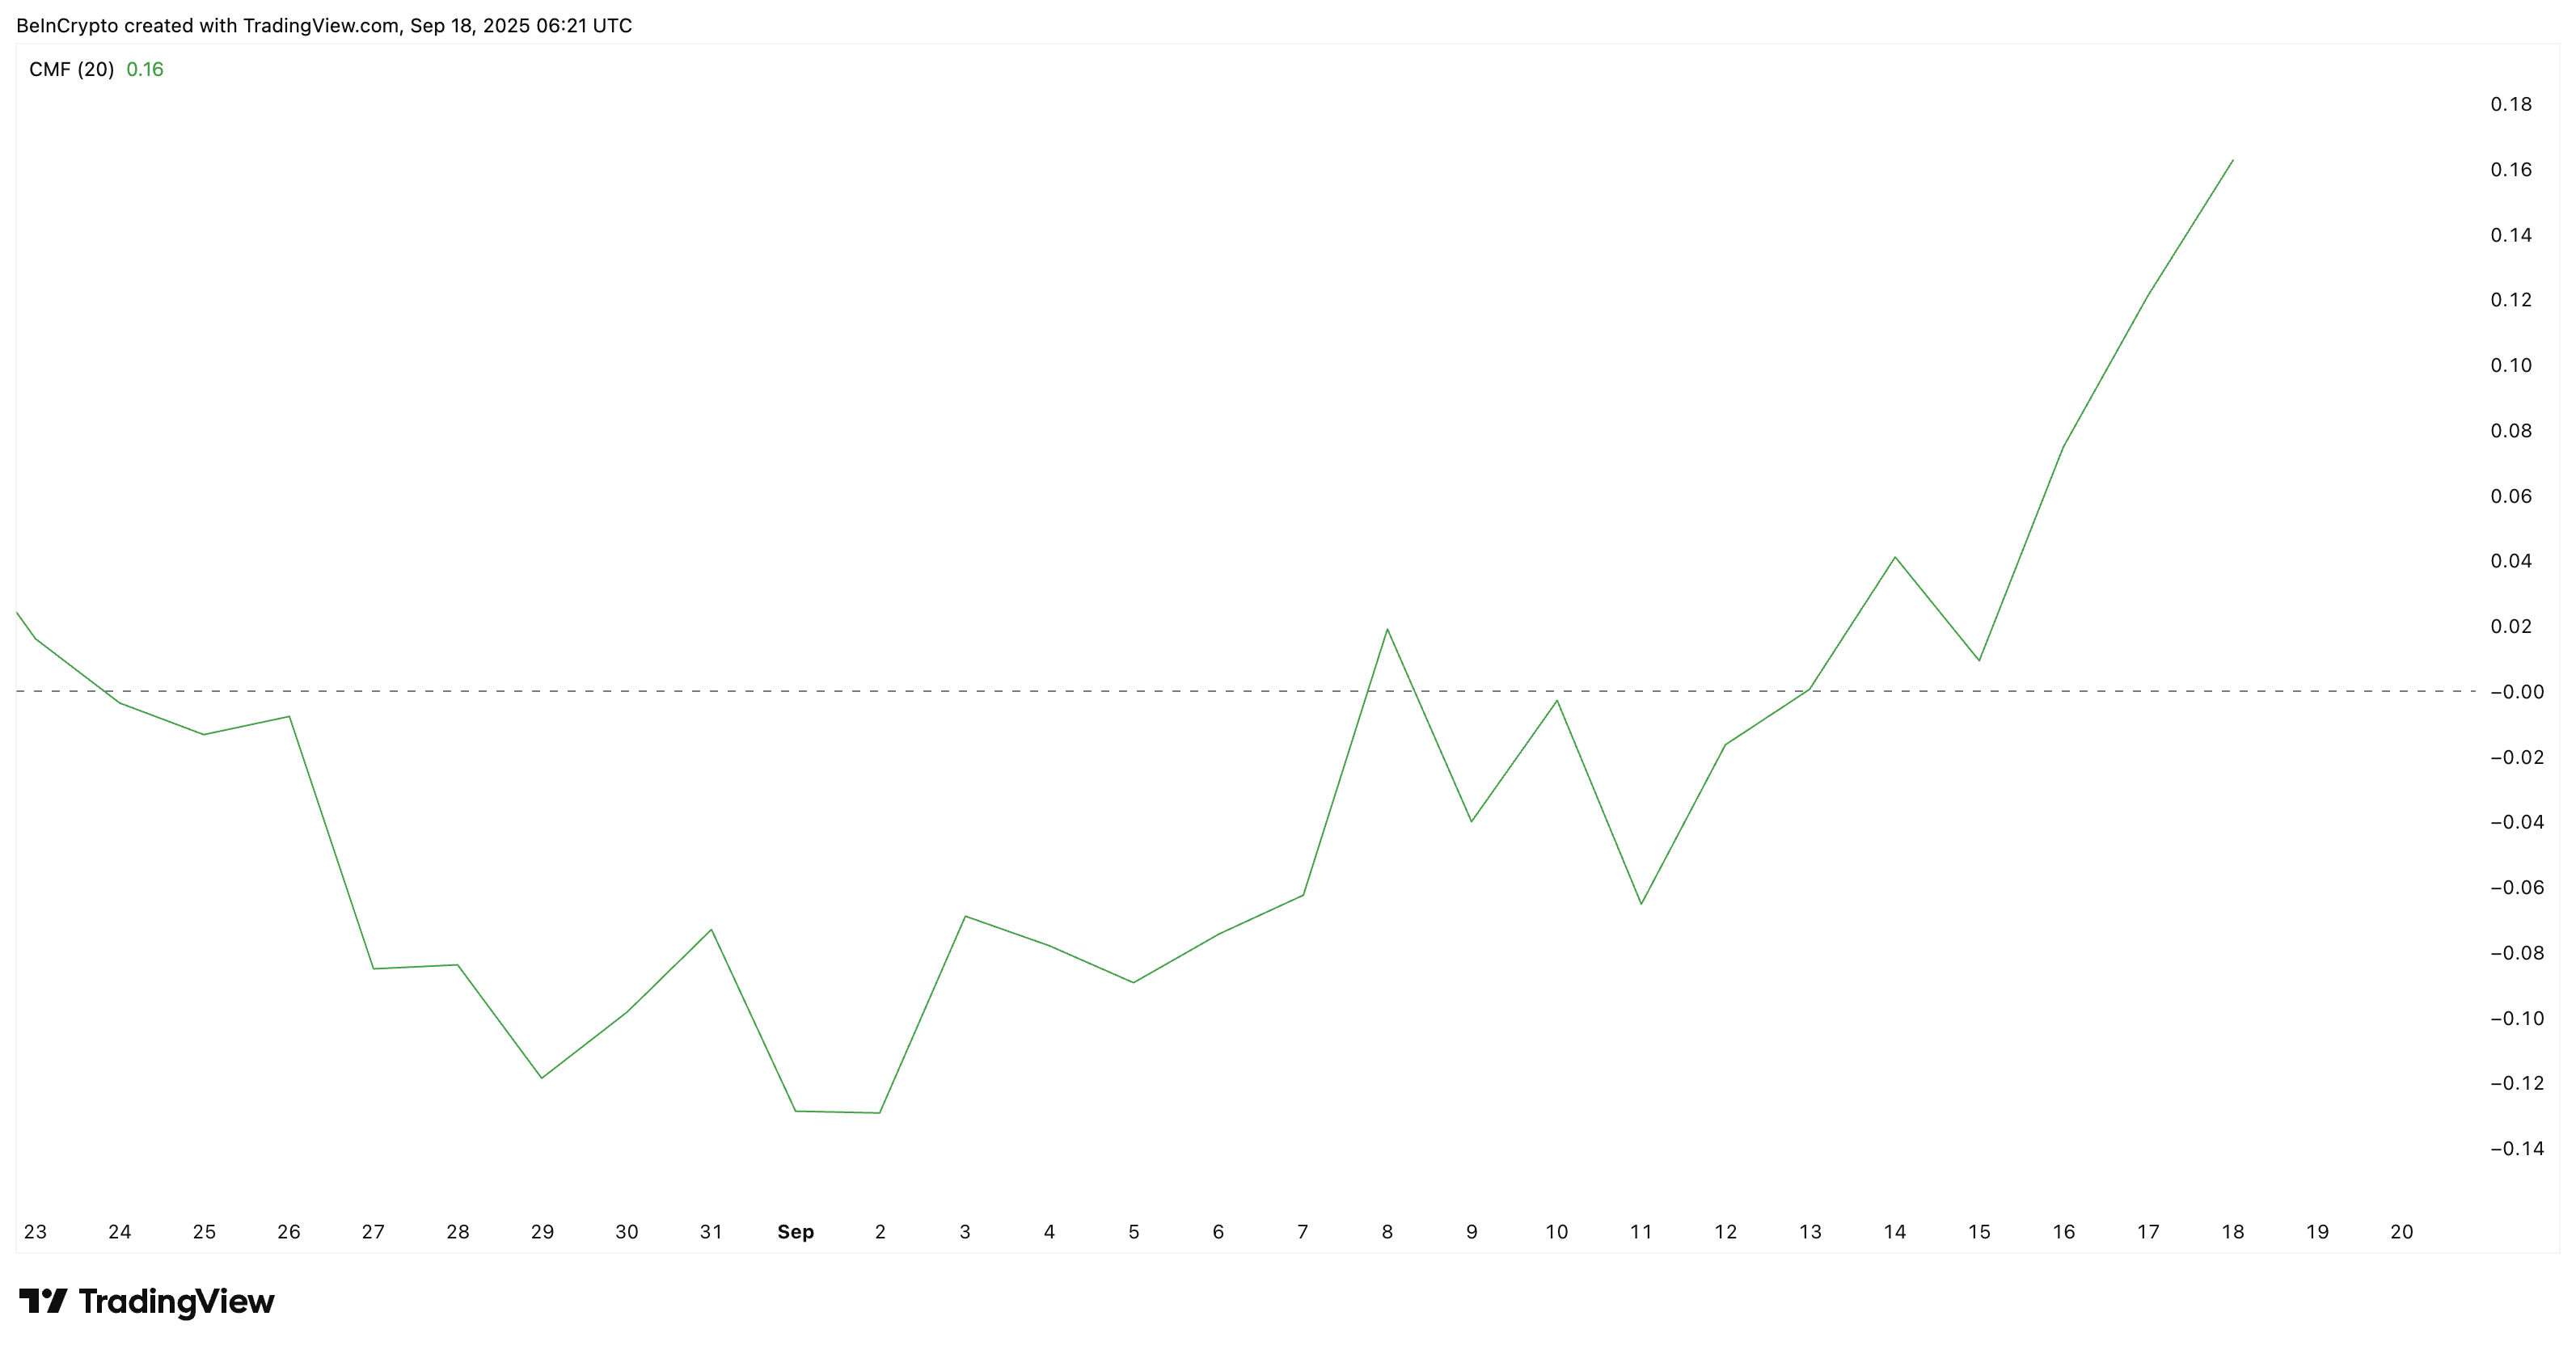
The Chaikin Money Flow (CMF), which measures whether buying or selling pressure is stronger, has turned sharply higher. On September 11, CMF was at –0.06. By September 17, it had risen to +0.16.
This shows that whales and big wallets are quietly buying HBAR, betting on a longer-term breakout rather than small rebounds.
Want more token insights like this? Sign up for Editor Harsh Notariya’s Daily Crypto Newsletter here.
The Smart Money Index (SMI) gives a different angle. SMI tracks faster traders who look for short-term rebounds. While it has climbed back near 1.00, it is yet to cross 1.004 — a level that would confirm stronger participation.
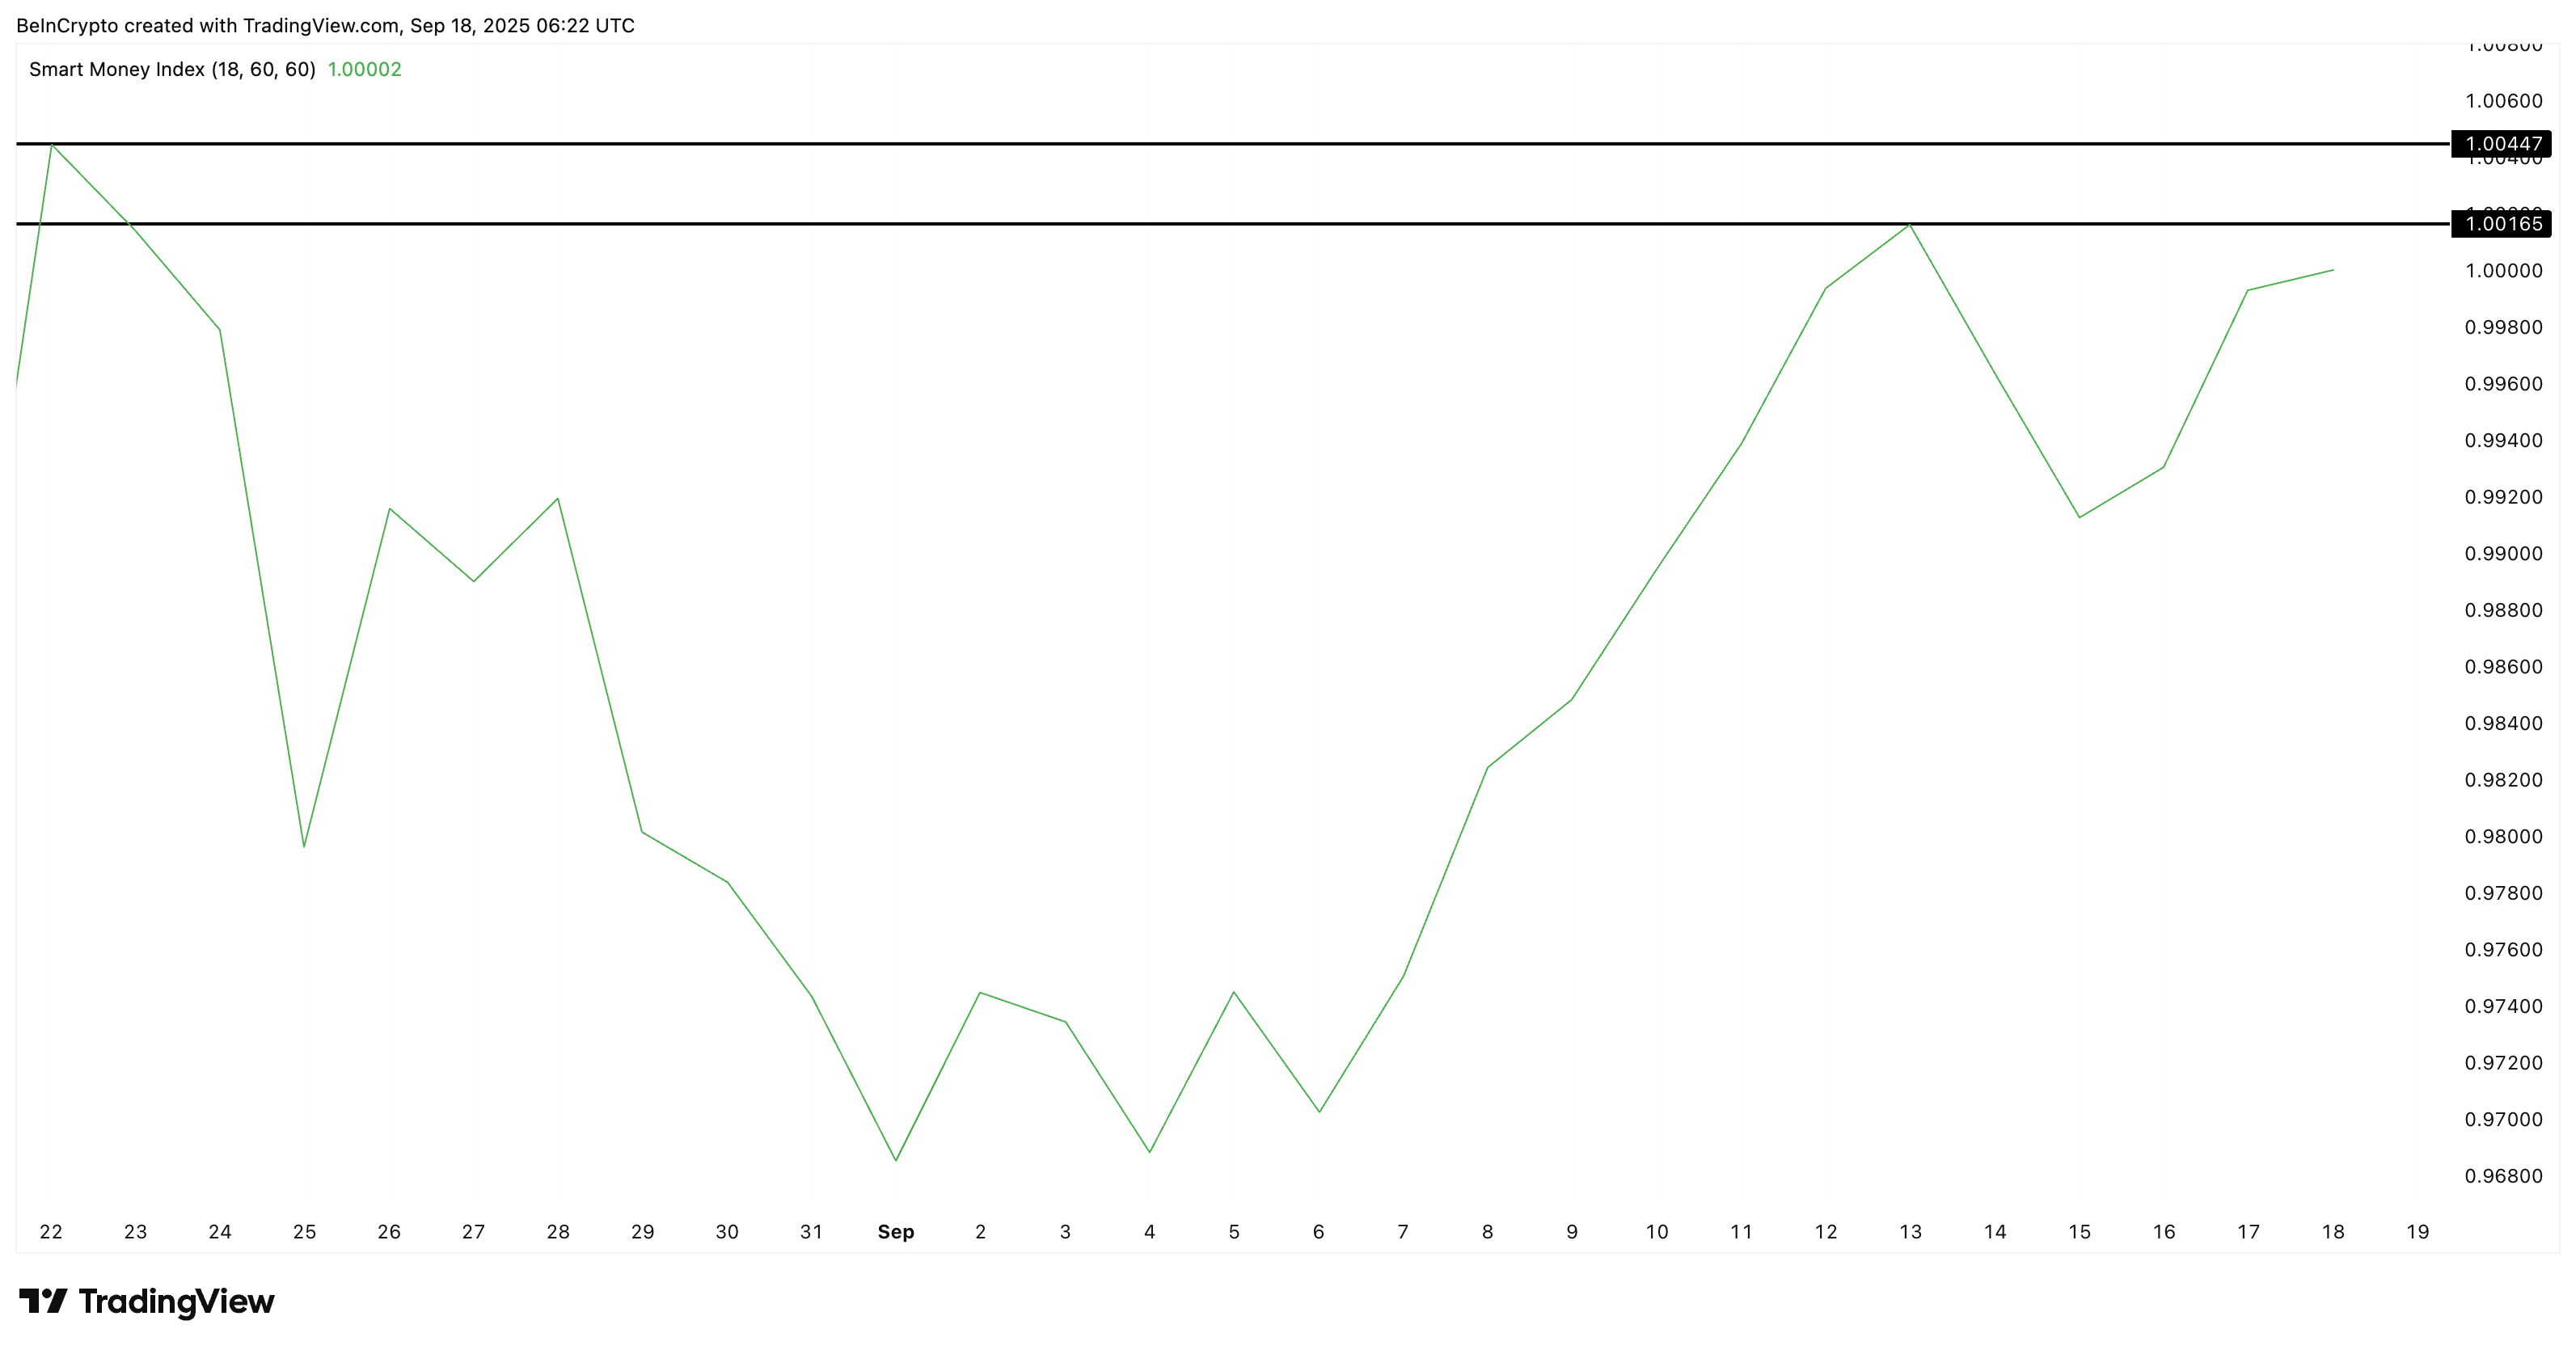
This means short-term traders are interested but still cautious, likely waiting for a key pattern breakout move above a key level before committing more.
Adding to the picture, the 4-hour chart flashes a bullish “golden” crossover, where the 100-period Exponential Moving Average (EMA) or the sky blue line is closing in on the 200-period EMA or the deep blue line.
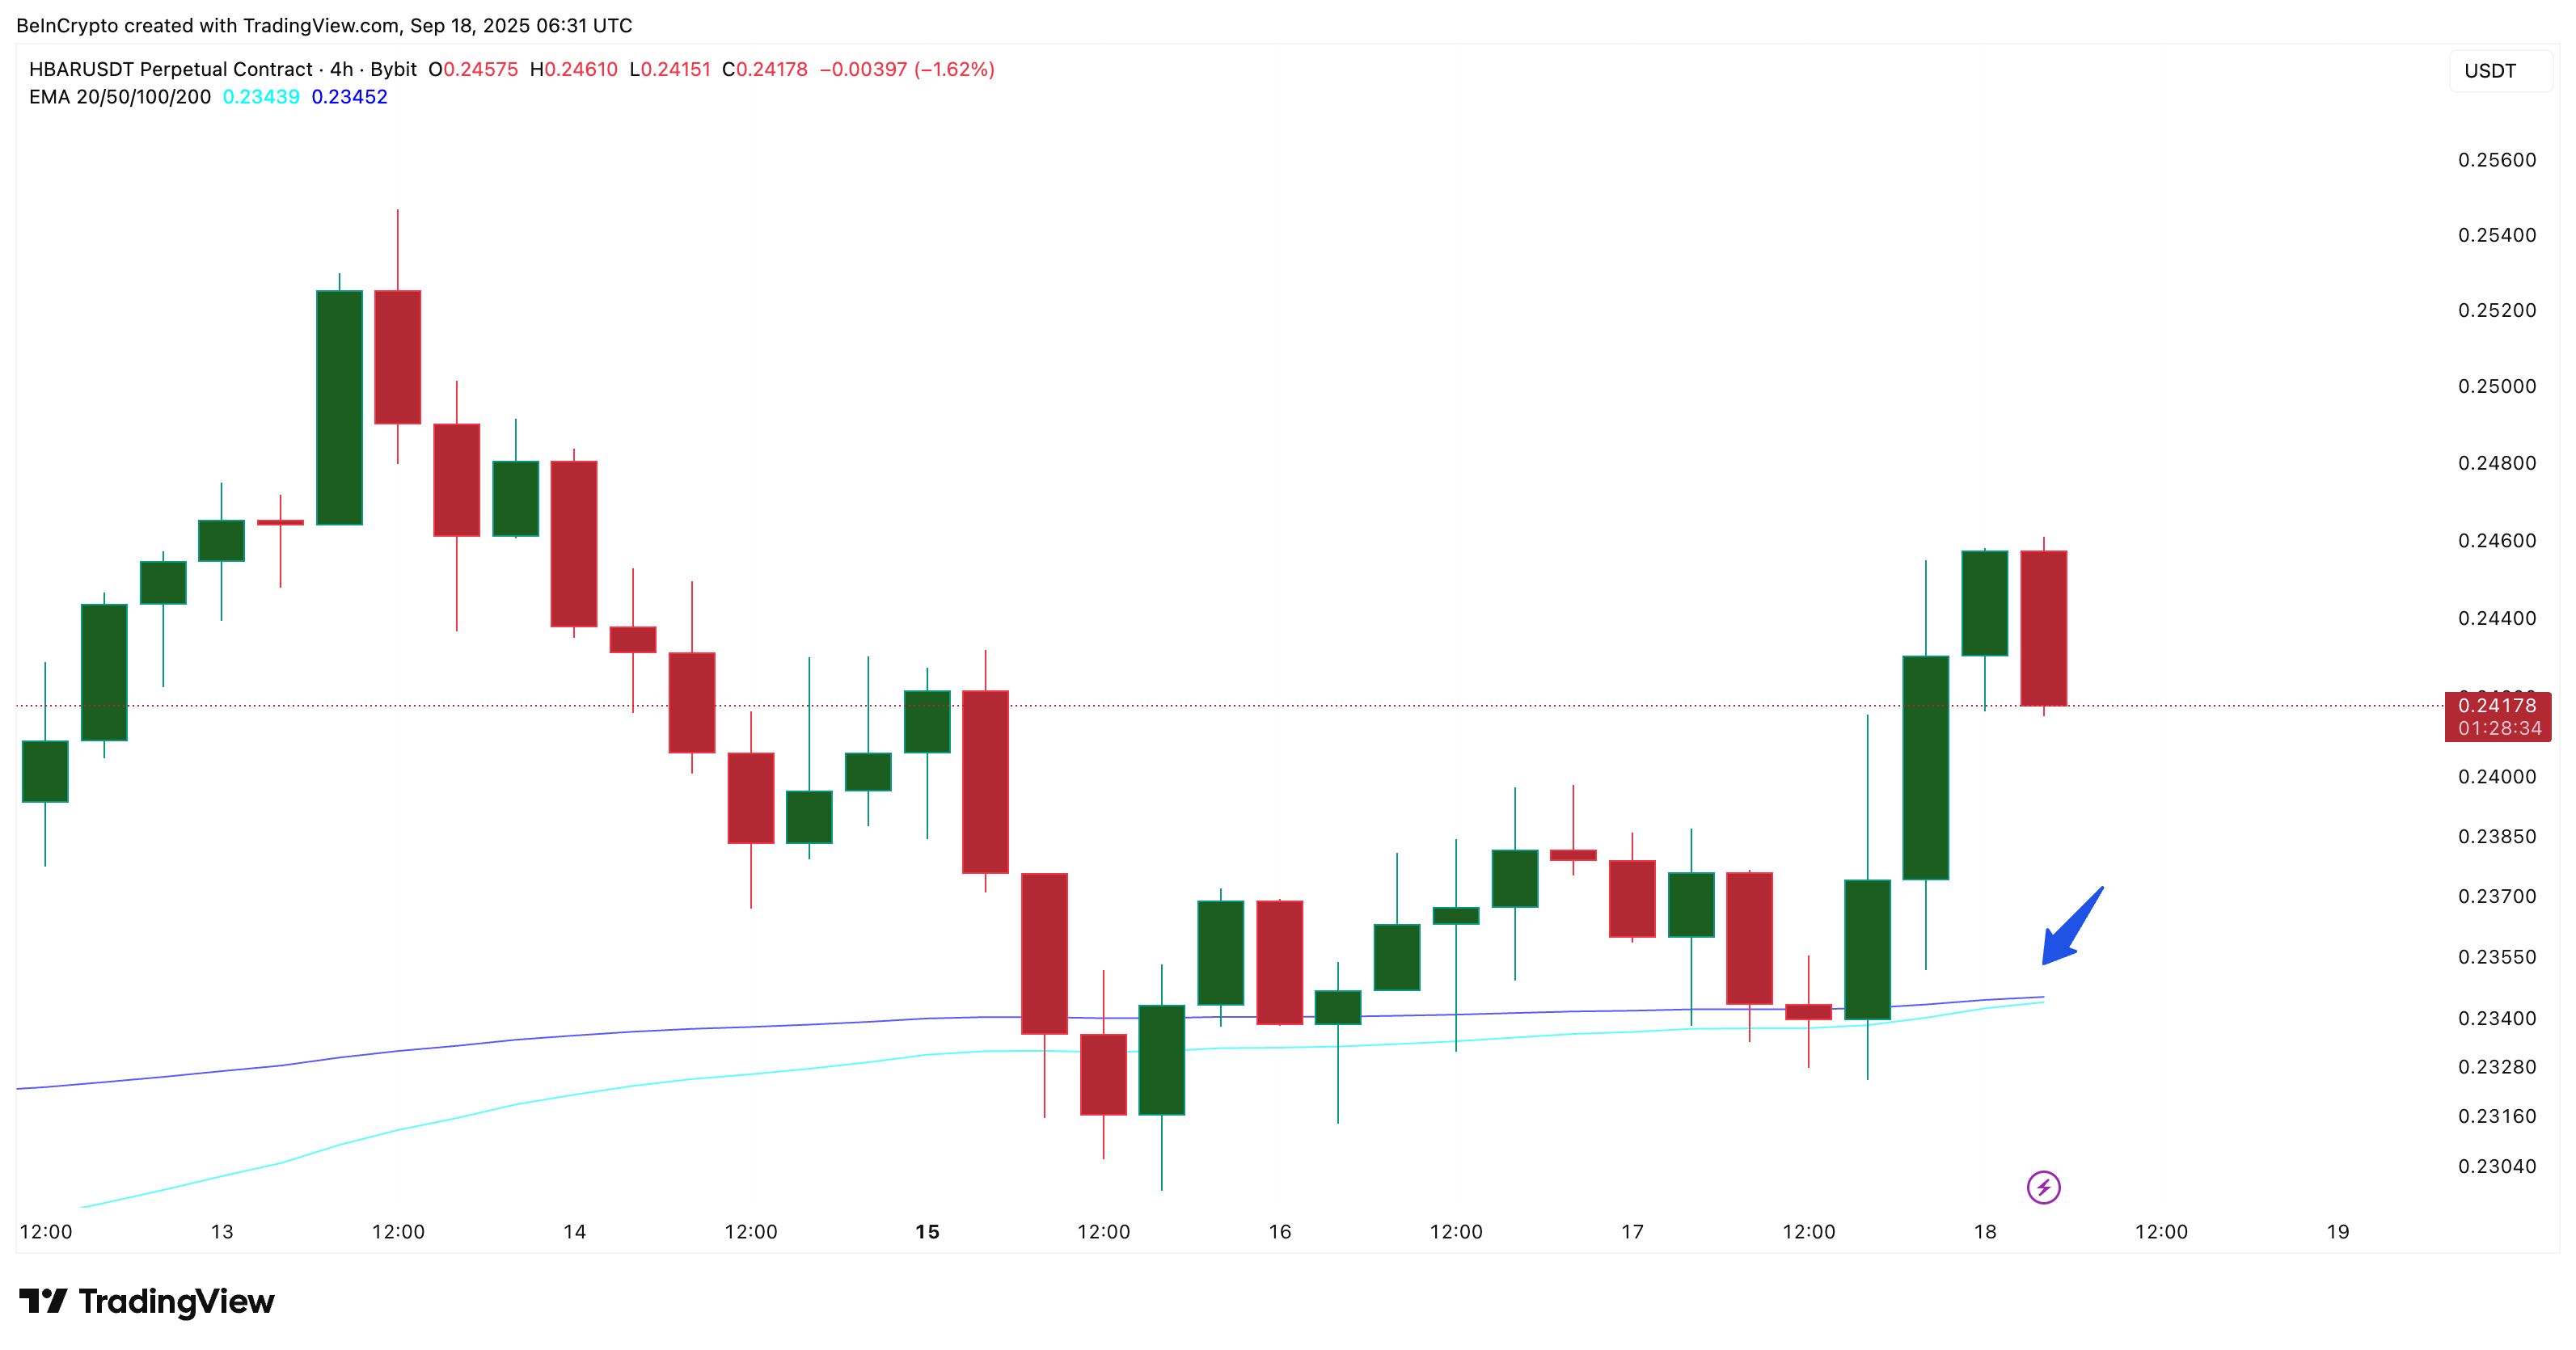
The 100 EMA crossing above the 200 EMA is often read as a strong sign that shorter-term momentum is powerful enough to shift the broader Hedera price trend higher.
The Exponential Moving Average (EMA) is a trend line that gives more weight to recent prices, making it quicker to react to market changes than a simple moving average.
Cup-and-Handle Breakout Still Holds for the HBAR Price
On the daily chart, HBAR has already broken out of the handle of a cup-and-handle pattern. A breakout from the handle suggests consolidation is ending, which matches the story from CMF and the cautious but growing Smart Money flows.
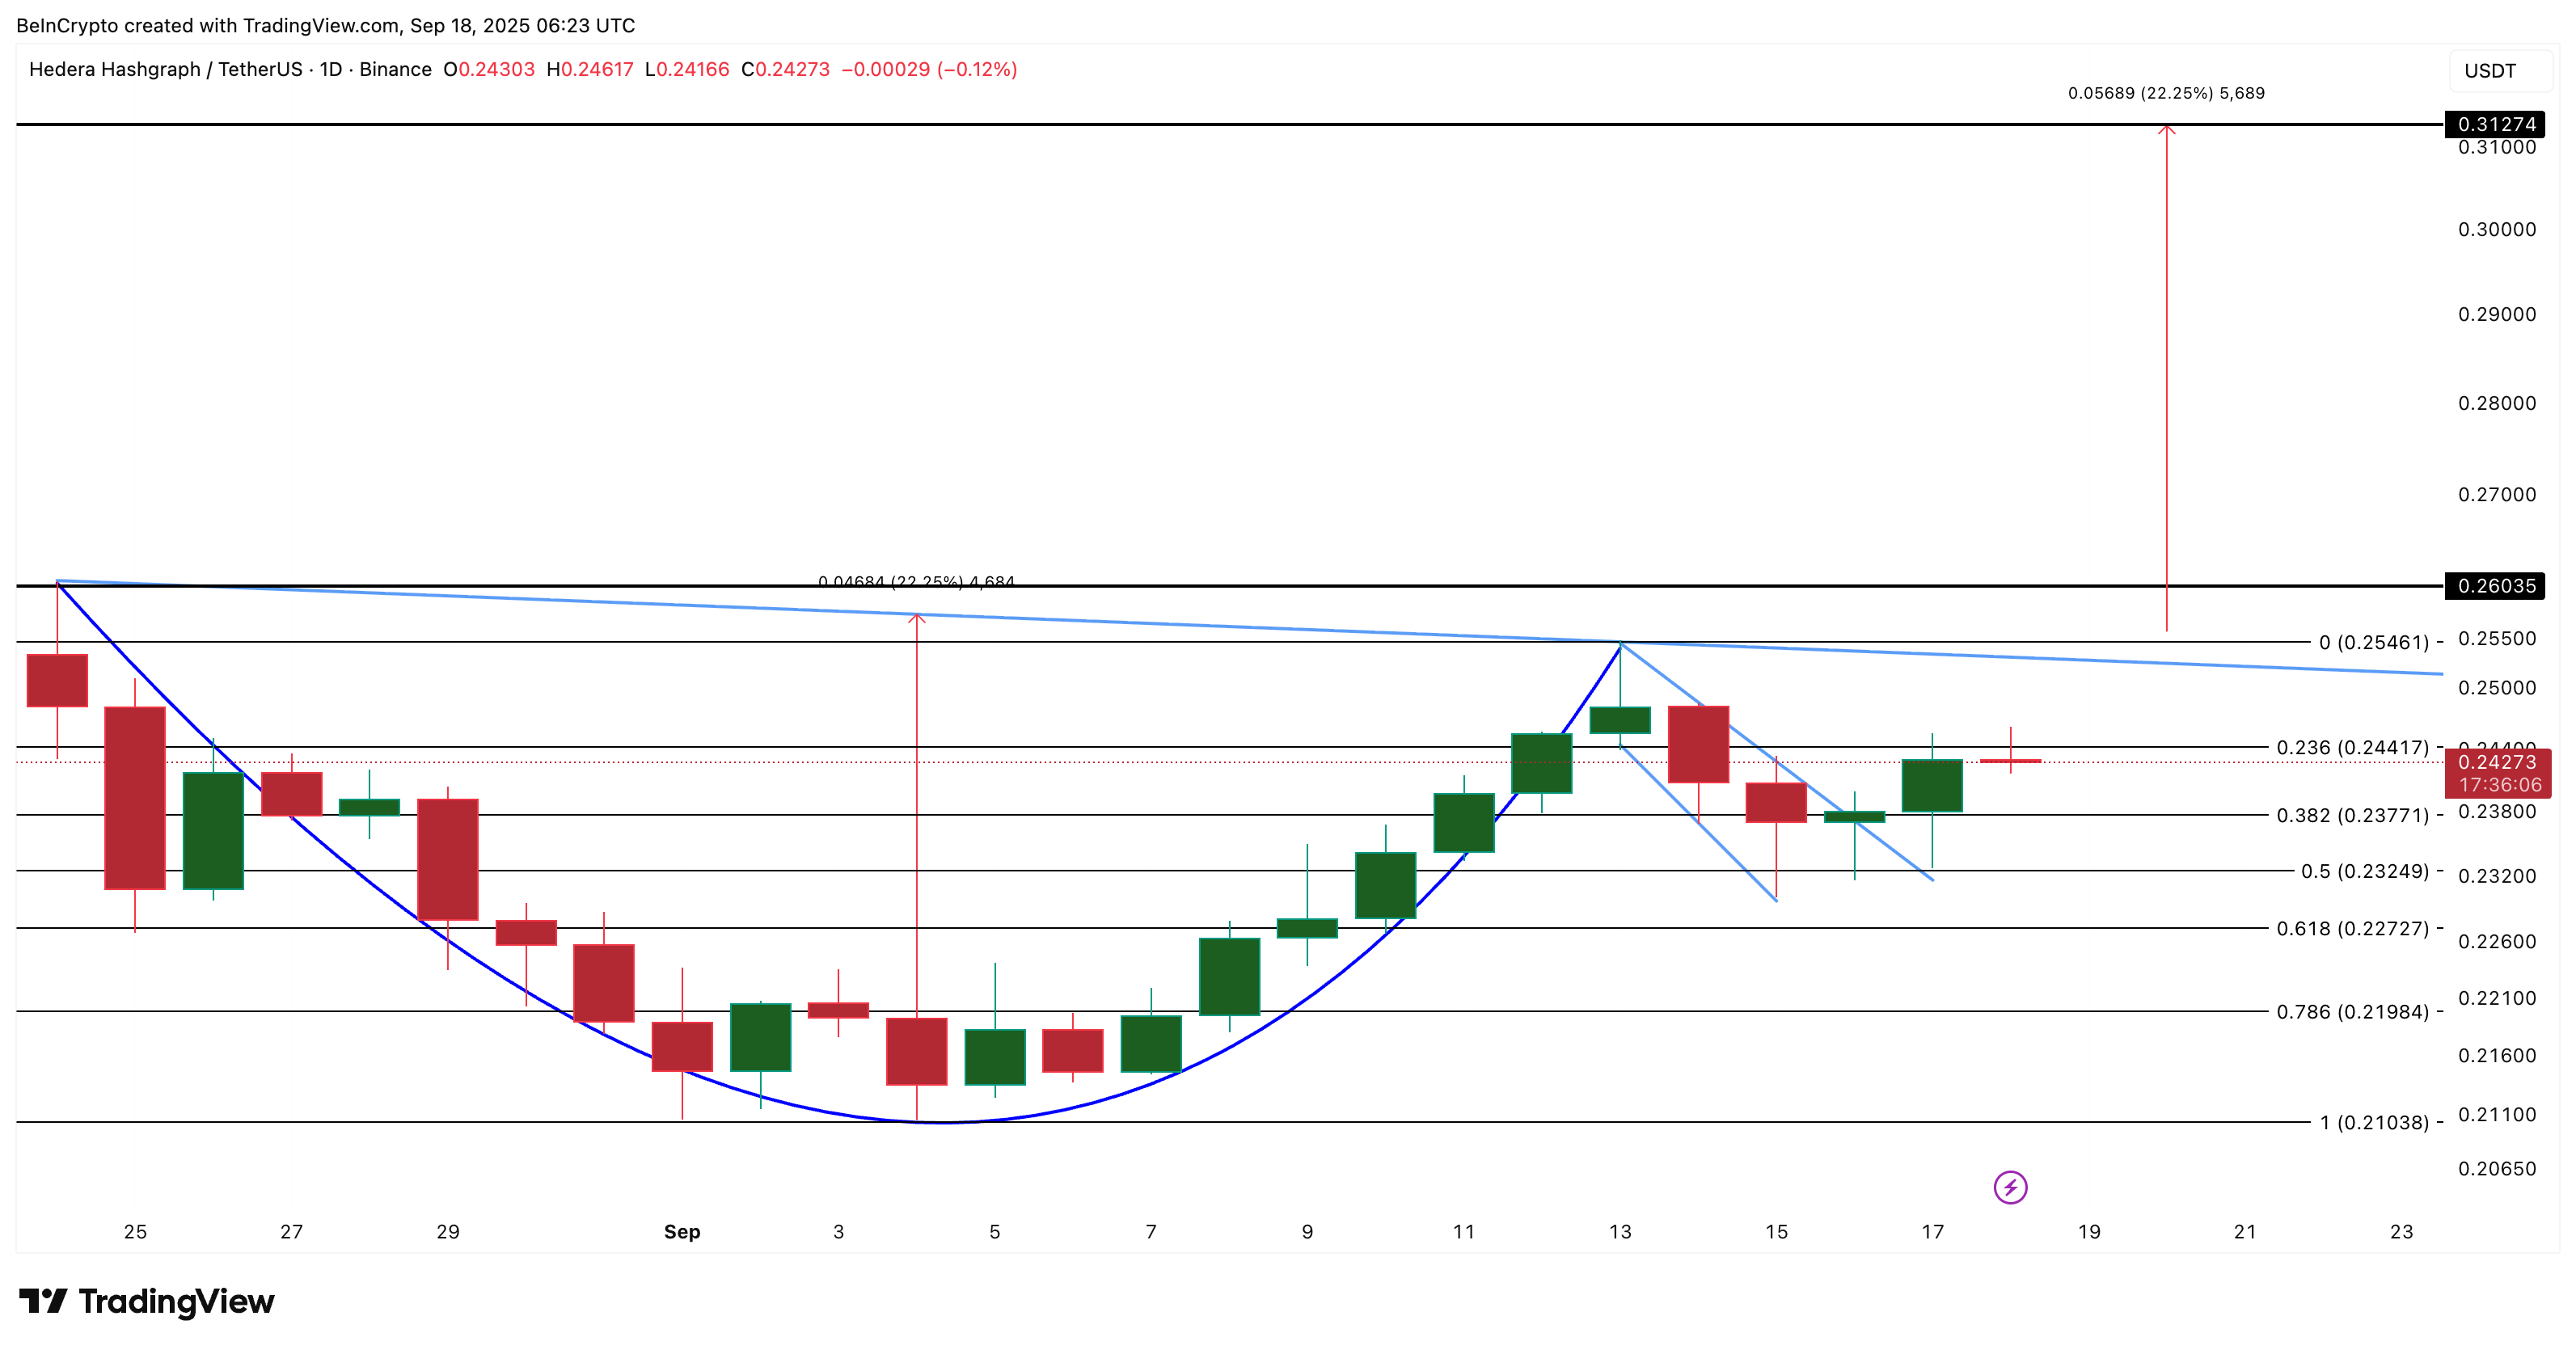
The neckline, or key level, mentioned earlier, is $0.25. If the HBAR price closes a daily candle above this level, it would confirm the breakout and point to a target near $0.31. That is where both big wallets and fast-moving traders may pile in together, pushing the rally harder.
If this HBAR price move fails, support lies at $0.23 and $0.22. A drop under $0.21 — the base of the cup — would invalidate the bullish setup.
For now, the mix of whale inflows, cautious Smart Money, and a looming golden crossover suggests that the Hedera (HBAR) price rally setup is still alive. Whether it stretches toward $0.31 depends on how it handles the neckline in the days ahead.
