
HBAR has been one of the strongest performers over the past year, with gains of nearly 350%. Even in the last three months, it is still up about 30%. But the short-term picture looks weaker. The HBAR price trades at $0.21, down 7.6% over the past week and month.
If signals now flashing on the charts play out, Hedera’s year-long uptrend could finally be at risk.
Bearish Signals and Weak Buying Point to Deeper Risk
On the 12-hour chart, two key bearish crossovers are closing in. The orange 20-EMA (Exponential Moving Average) line is closing in on the 100-EMA line (sky blue), while the red 50-EMA line is approaching the deep blue 200-EMA line.
If both lines cross down, they often mark further downside. The last crossover on August 20, when the 20-EMA fell under the 50-EMA, sent the HBAR price down from $0.24 to $0.22 in a few sessions.
Want more token insights like this? Sign up for Editor Harsh Notariya’s Daily Crypto Newsletter here.
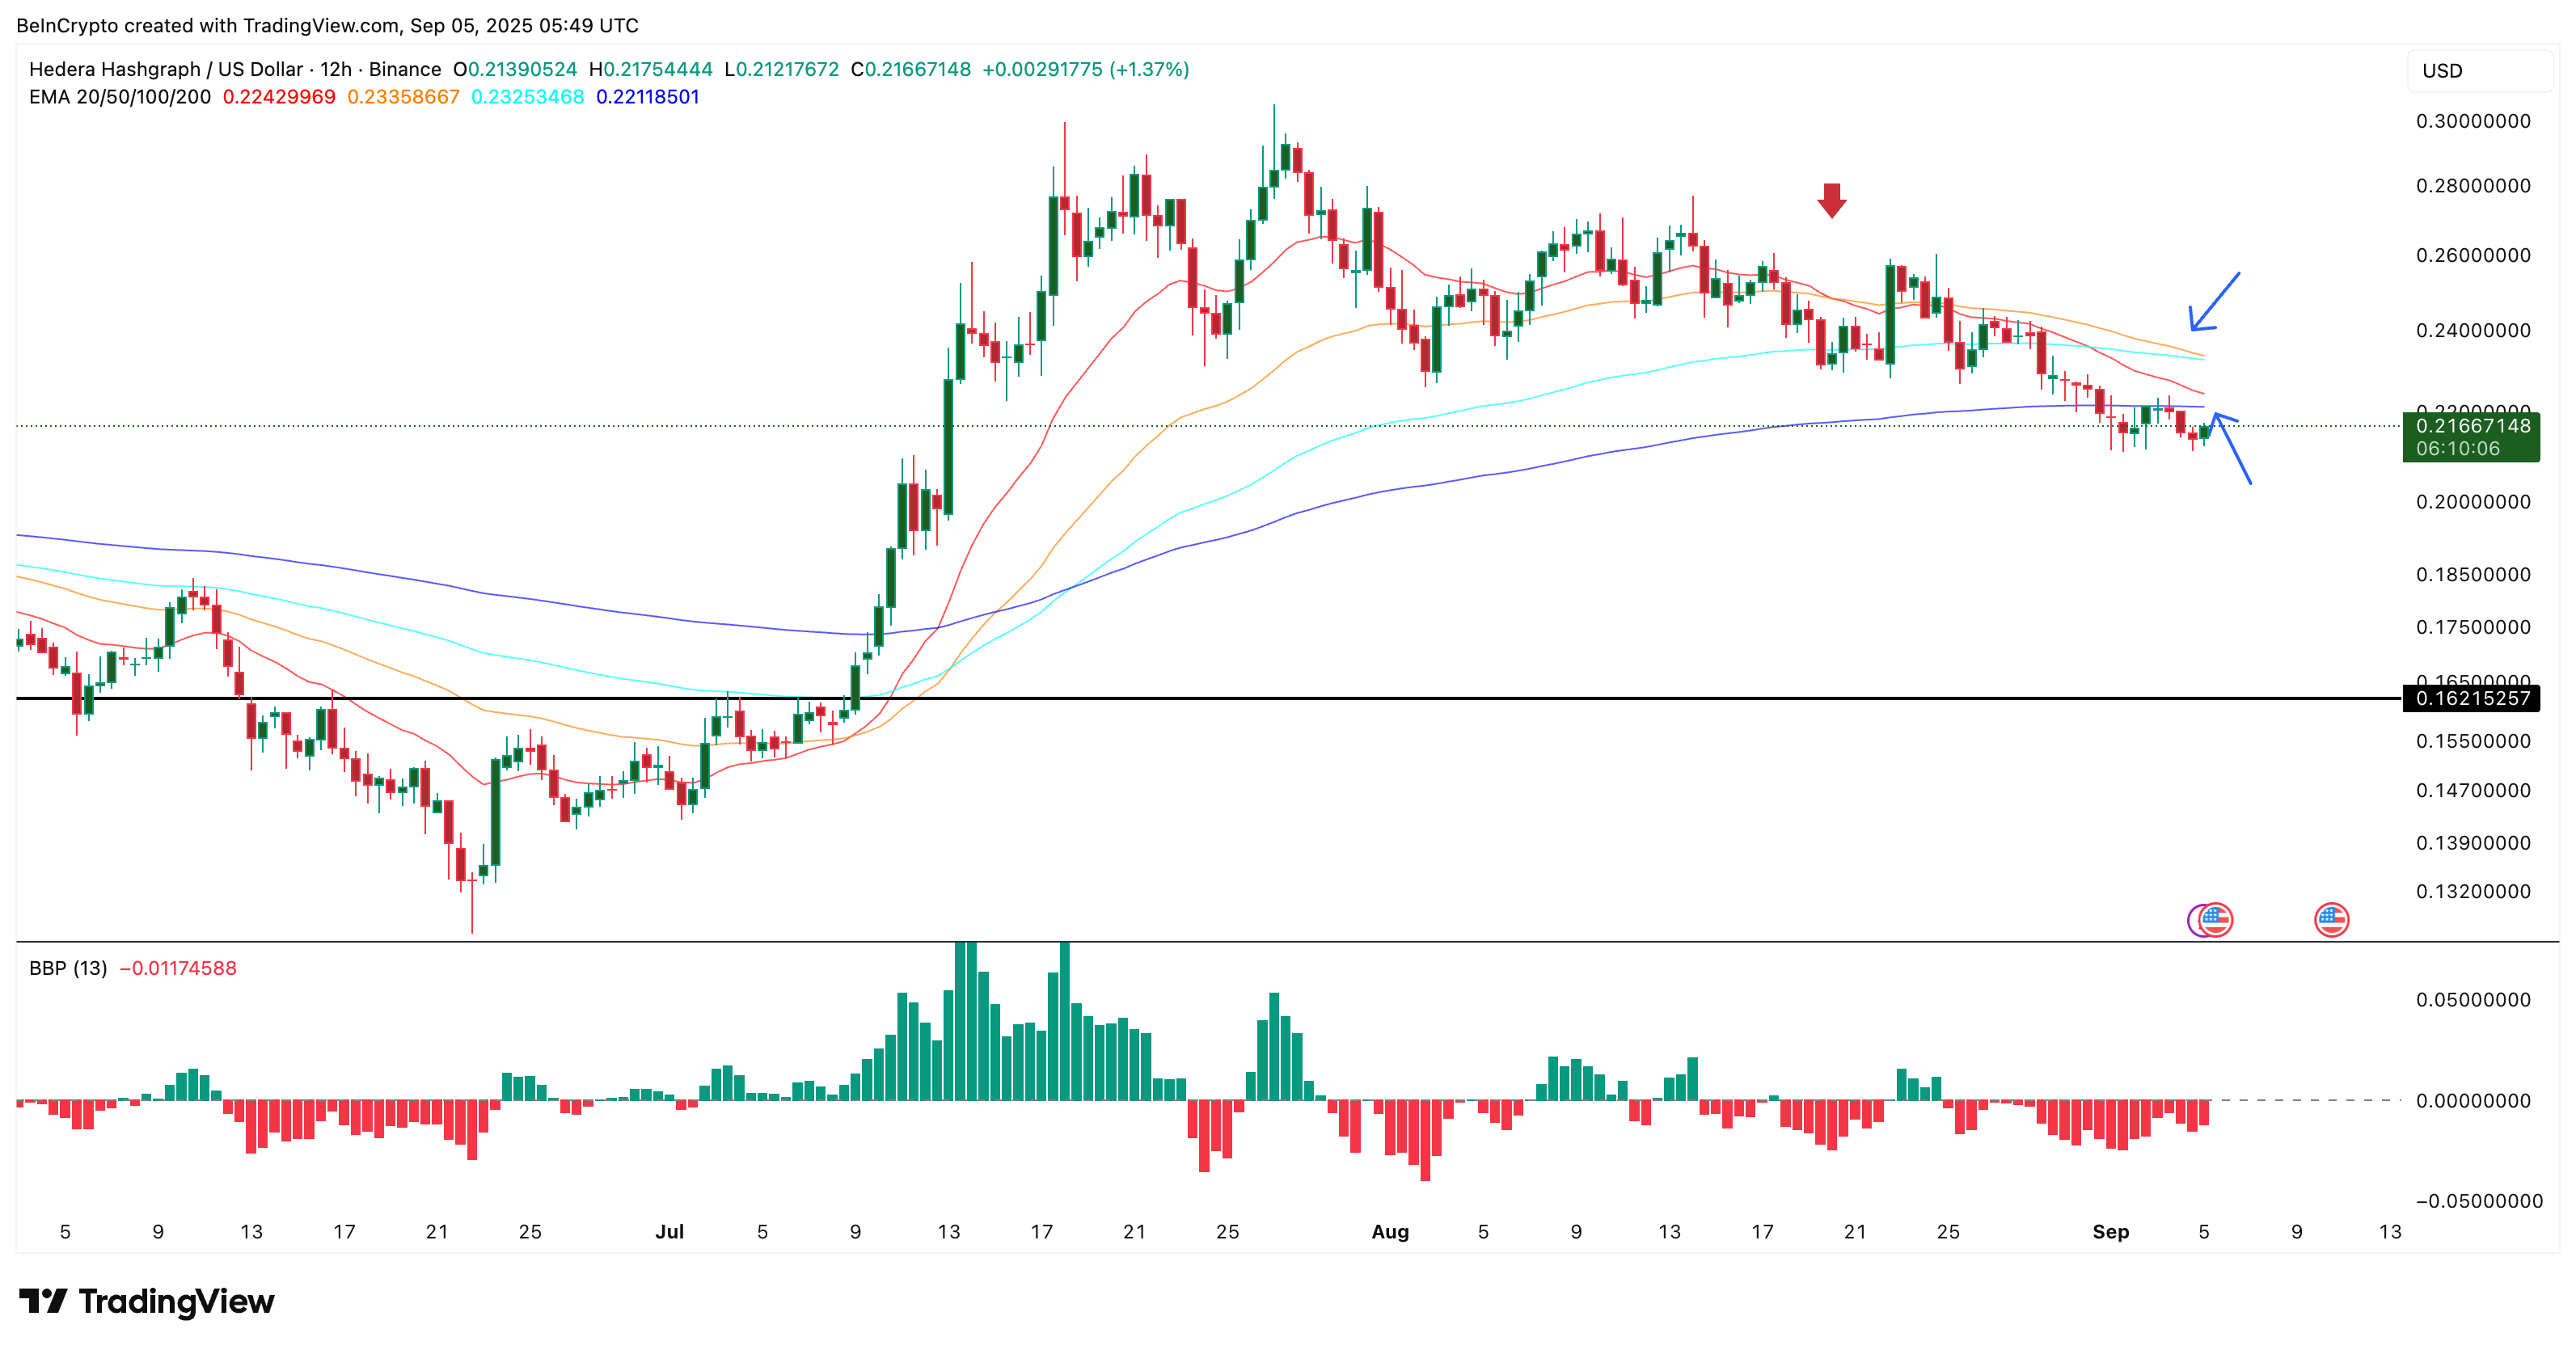
EMA, or exponential moving average, is a line that smooths price action to show short-term and long-term trends. When shorter EMAs move below longer ones, it signals that selling is building and momentum is shifting to bears.
HBAR price is already trading under all major EMAs, which suggests bears are in control. This is confirmed by the bull-bear power indicator, which shows the balance between buying and selling strength. The red bars are expanding, meaning bear power is getting stronger.
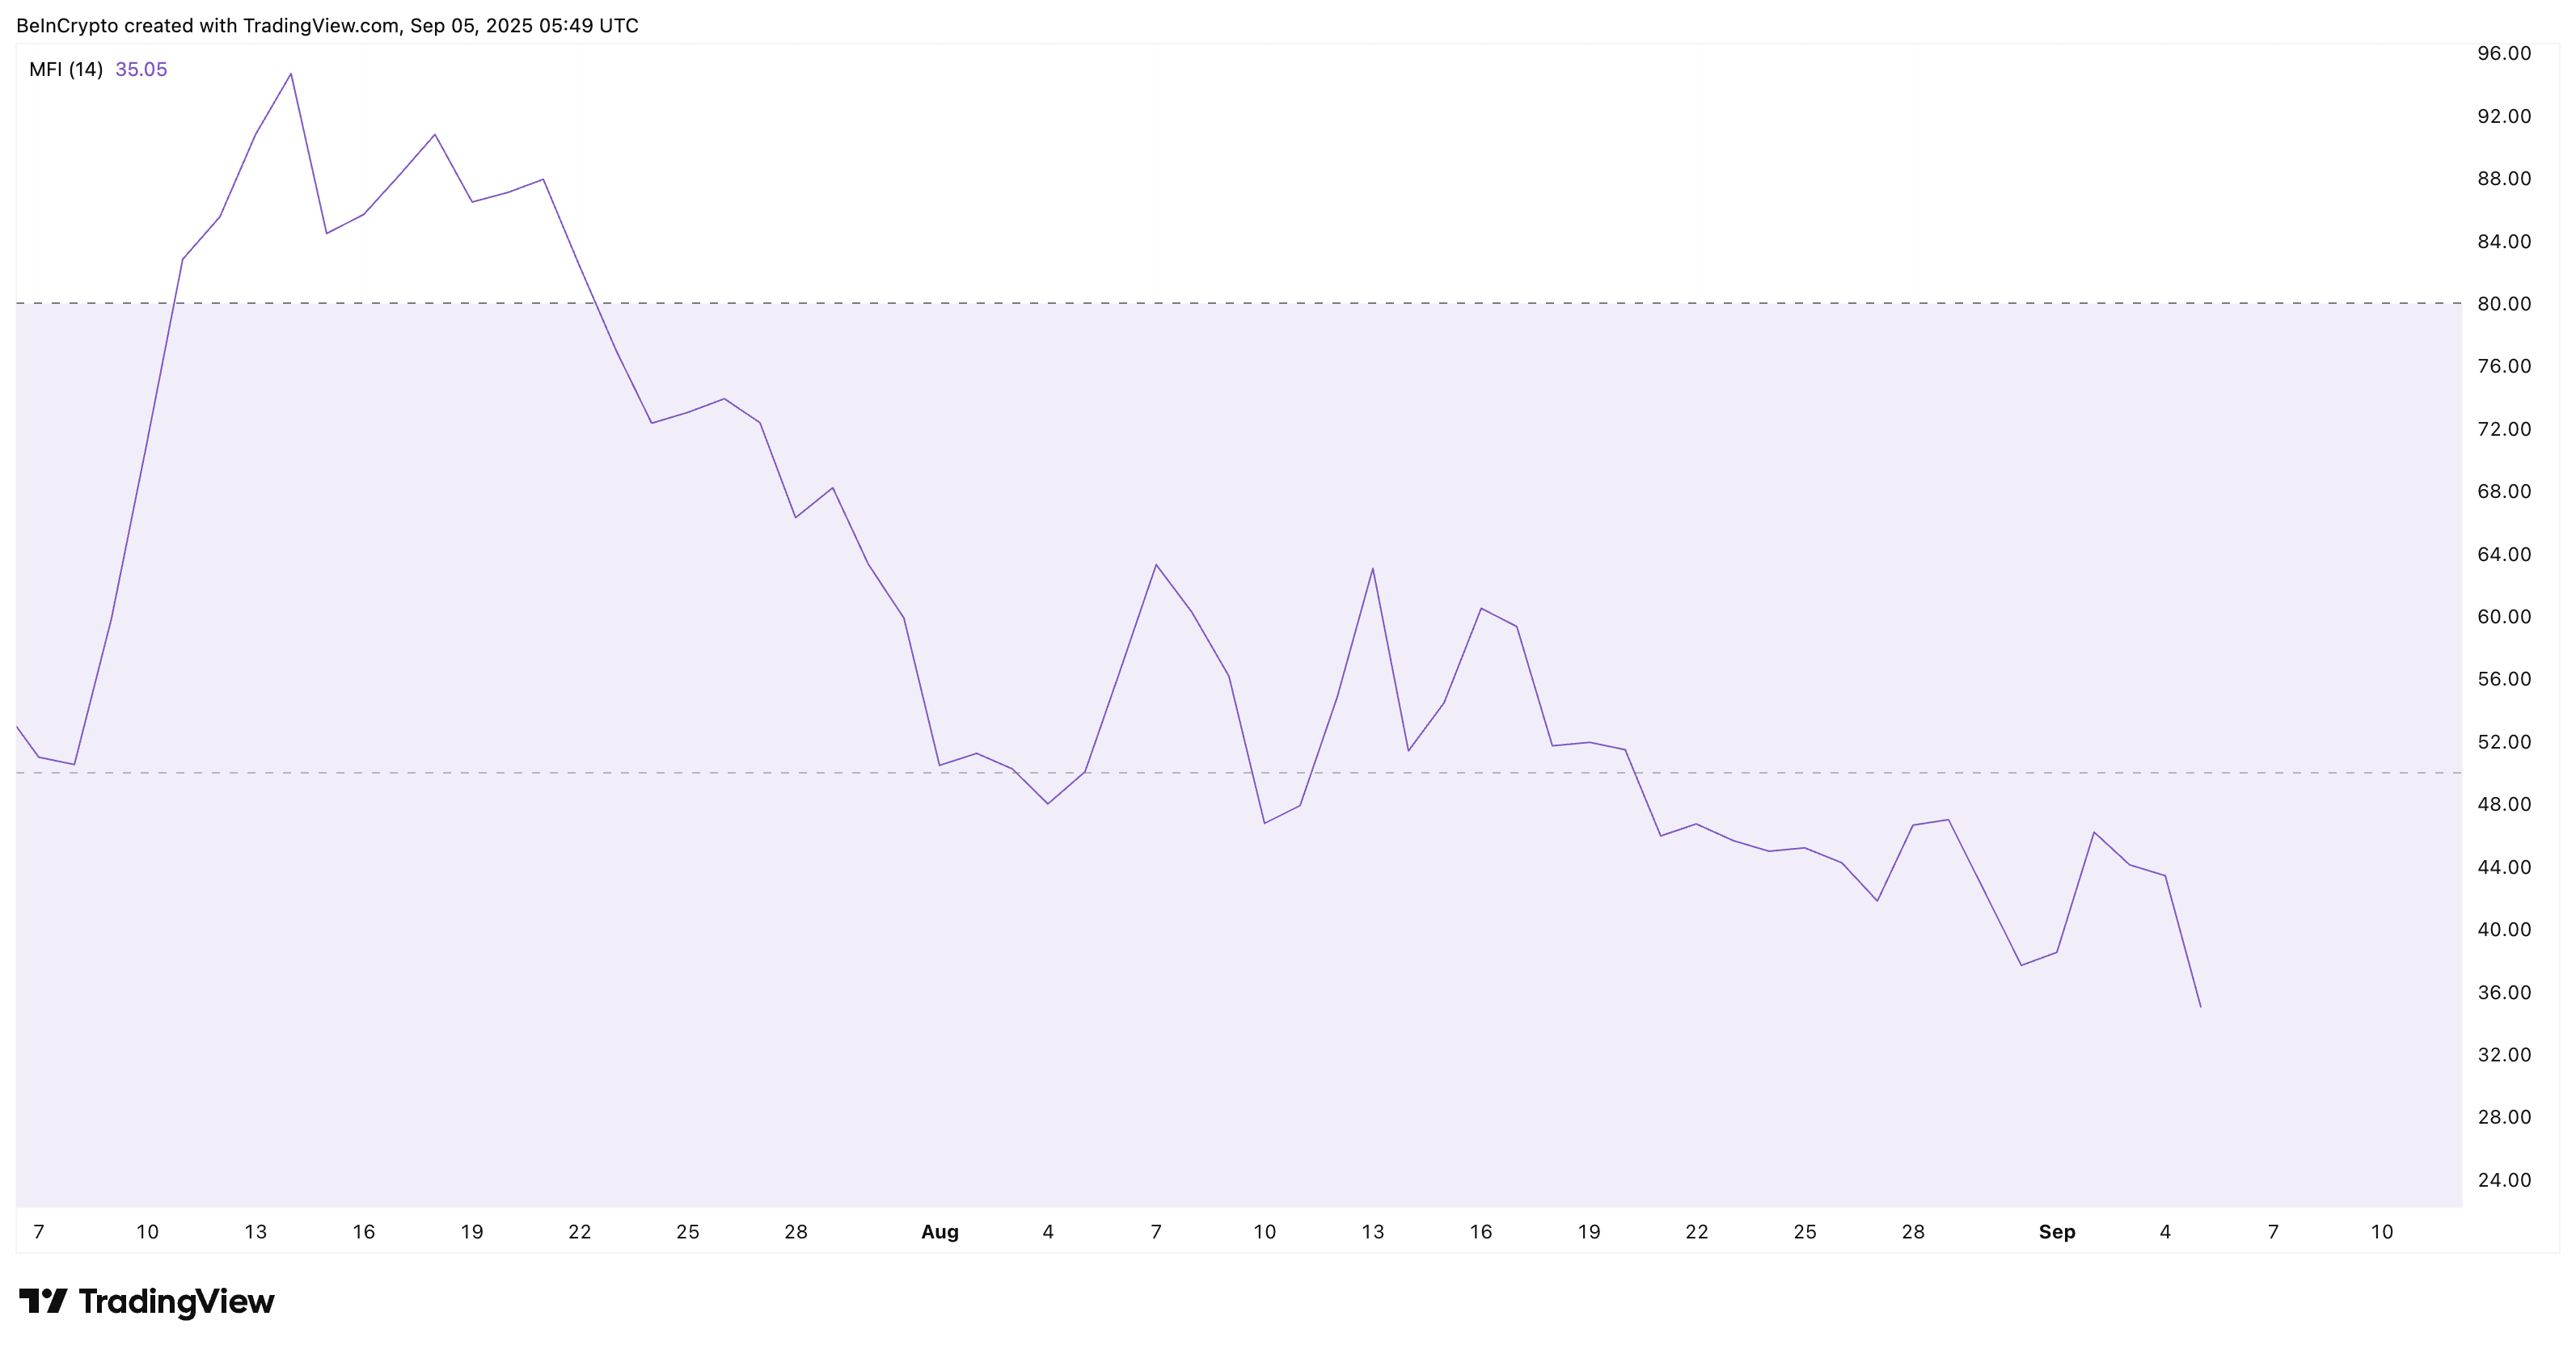
Normally, bearish crossovers can fail if bulls return with heavy buying. But that looks unlikely here. The Money Flow Index (MFI), which measures both trading volume and price action, has dropped to 35. This means fewer traders are buying the dip while selling pressure grows.
When you combine bearish crossovers, rising bear strength, and weak buying, the setup points to more downside. If $0.210 breaks, HBAR price could fall to as low as $0.162 (one of the strongest support levels), one highlighted on both the 12-hour and daily charts. The daily chart shows up next.
Bullish Pattern Offers Hope, But Only Above Key HBAR Price Levels
The daily chart gives bulls a slim chance. HBAR price has been moving inside a falling wedge, a structure that often hints at a bullish reversal. The wedge shows selling pressure slowing as the lines narrow, but the reversal only becomes valid with a breakout.
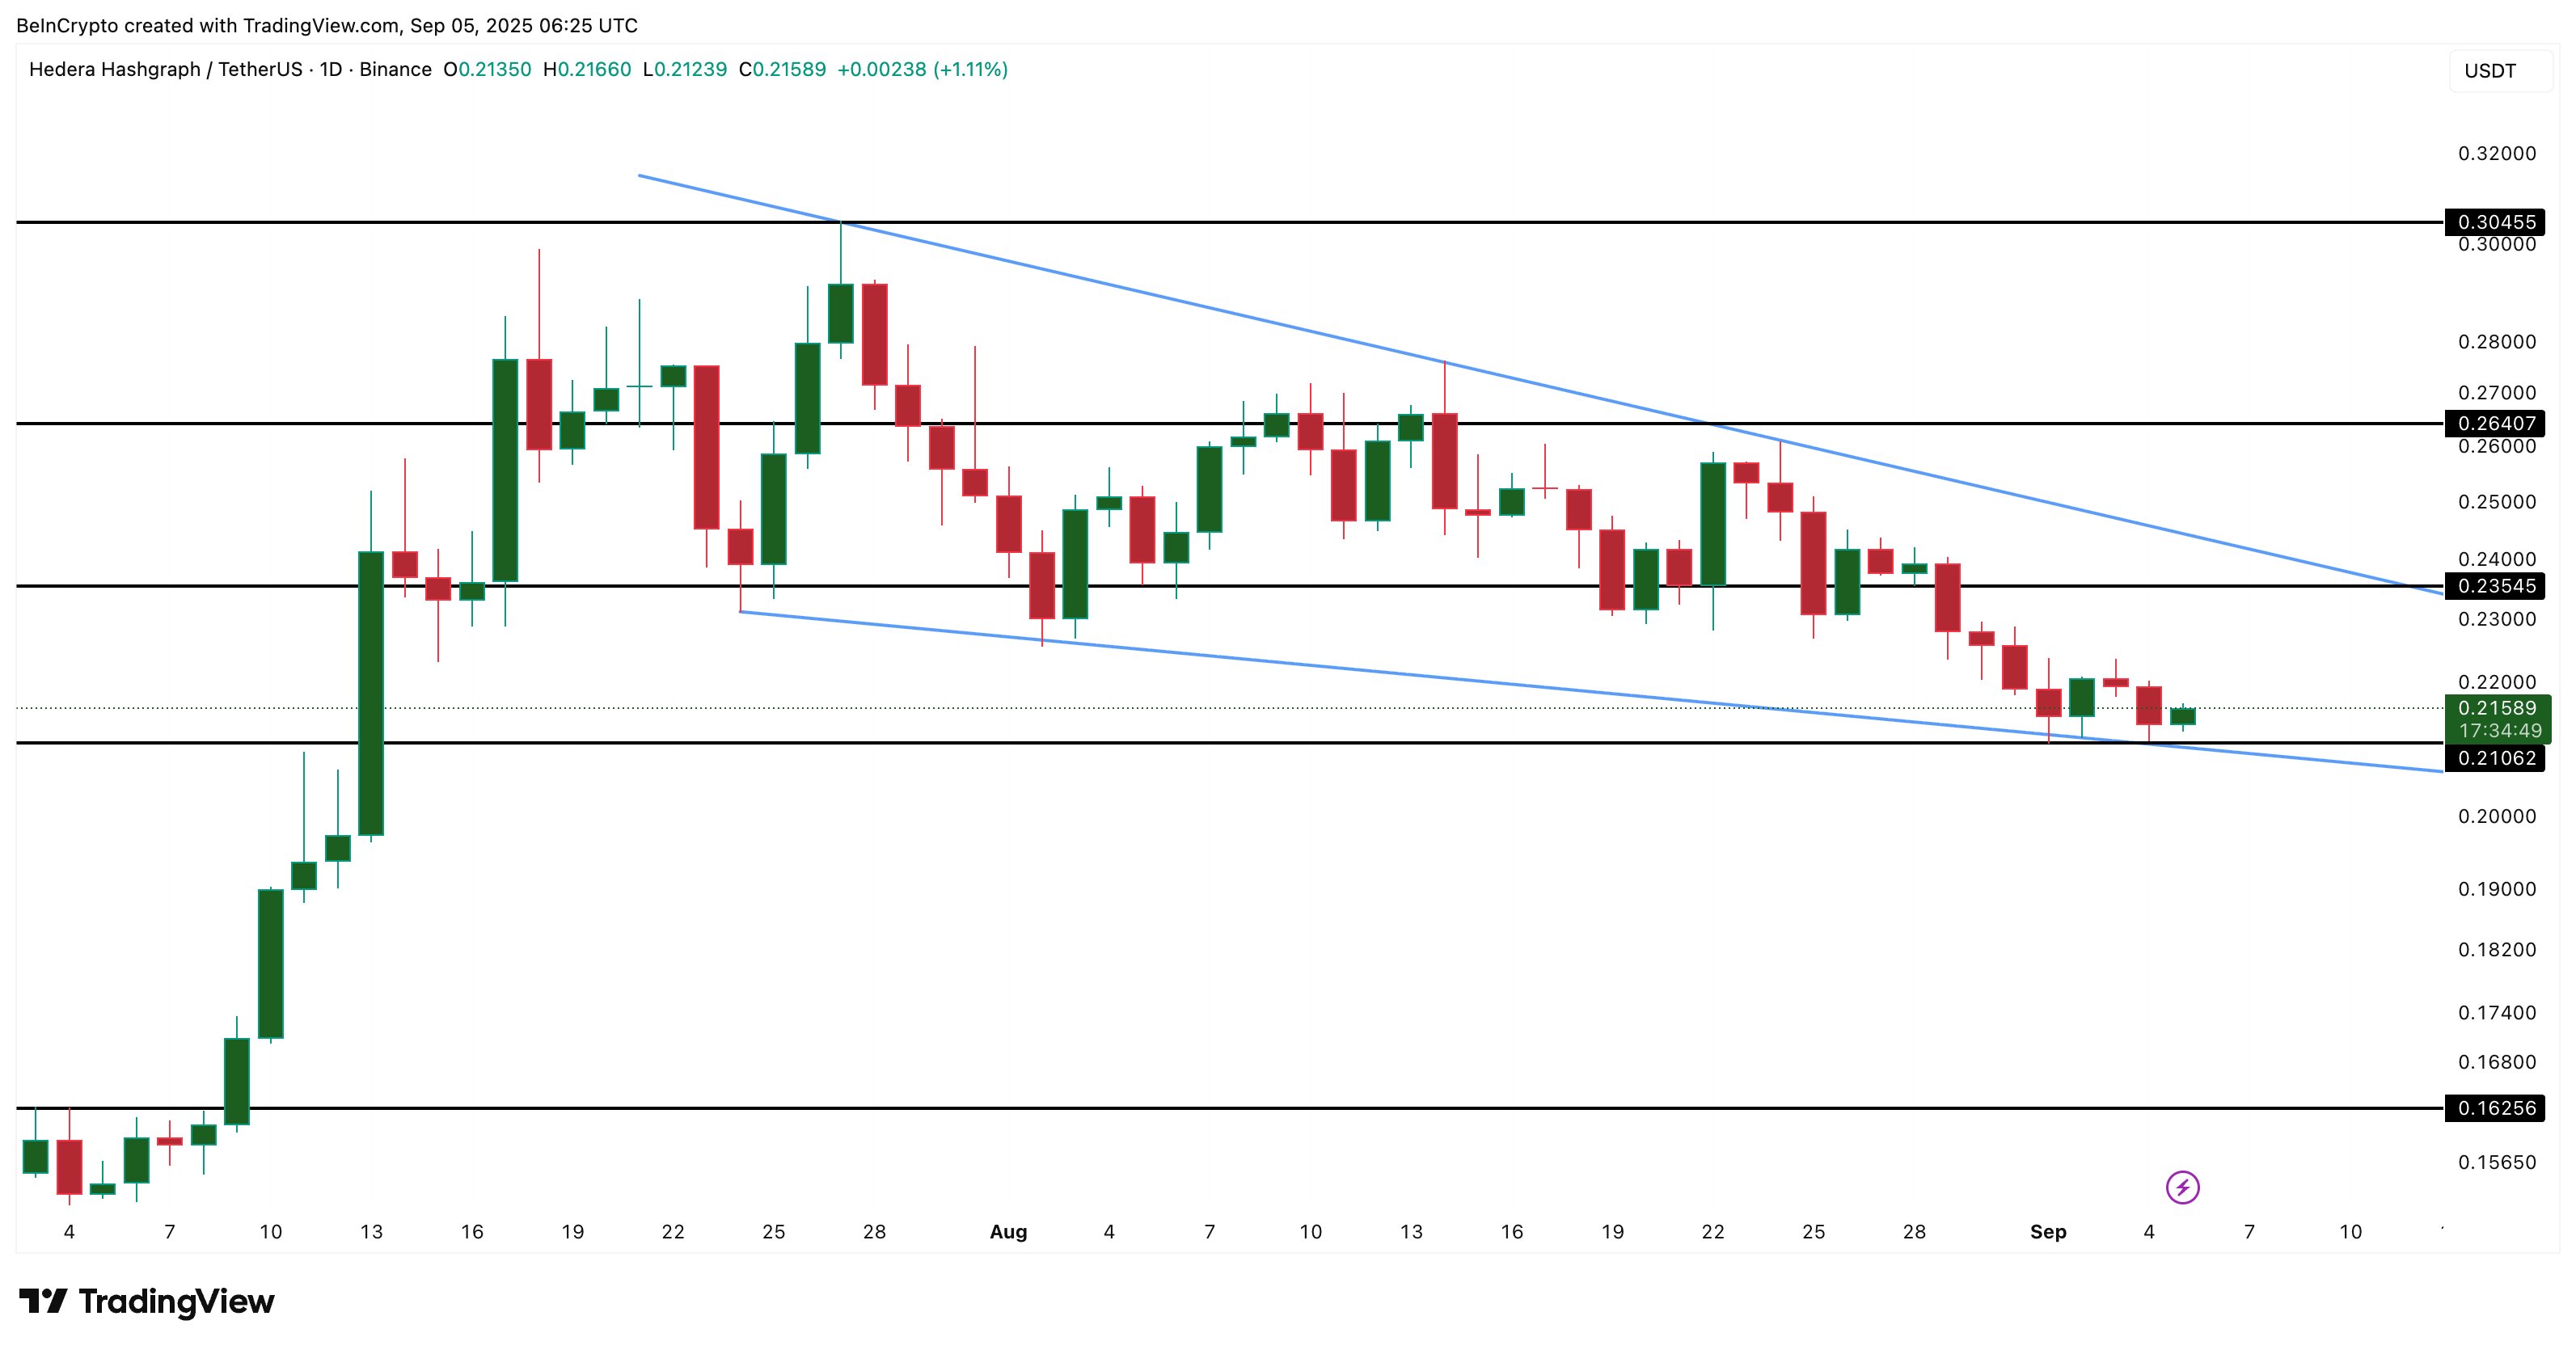
Support at $0.210 is critical. If this level fails, the wedge breaks down, and the $0.162 target comes back into focus. This matches the same level from the 12-hour chart.
For the bullish case, resistance sits at $0.235. A strong move above it would invalidate the bearish crossovers and keep the wedge alive. If that happens, HBAR price could aim for $0.264 and possibly $0.304.
Until then, bears remain in charge. The year-long uptrend is not yet broken, but unless bulls defend $0.210 and reclaim higher ground, HBAR price risks sliding much lower.
