


Hedera Hashgraph (HBAR) is trading inside a descending parallel channel and bounced on its support line on June 22. Enjin Coin (ENJ) has created a double bottom pattern and broken out from a descending resistance line. Helium (HNT) has bounced at the $10.20 support area for the fifth time since March.
HBAR
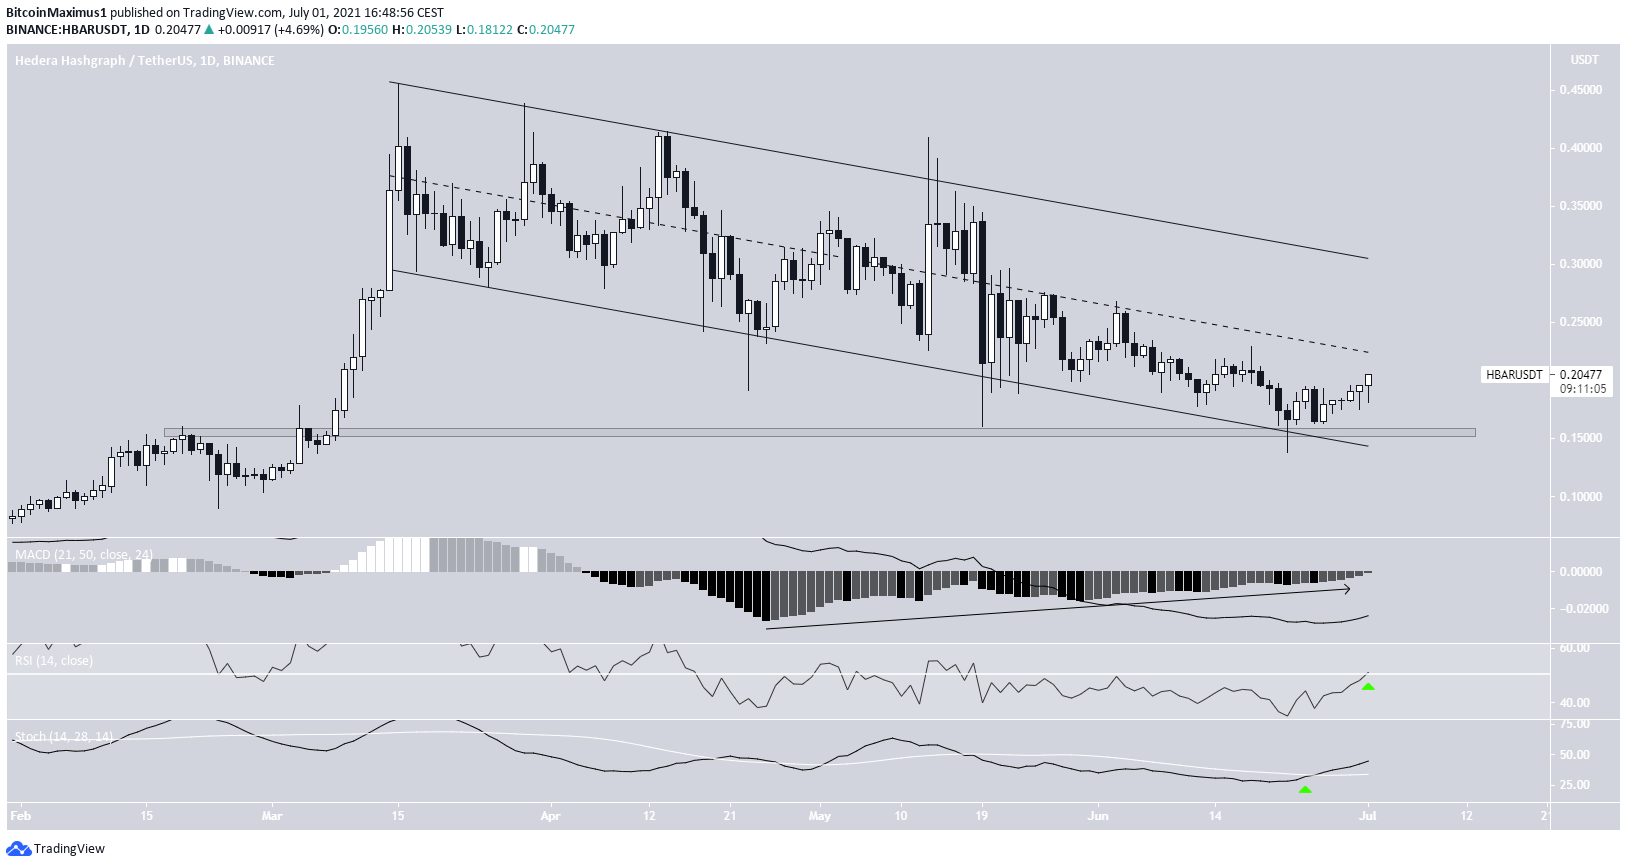
Since March 14, HBAR has been trading inside a descending parallel channel. On June 22, it reached the support line of the channel for the sixth time and began an upward movement. The low coincided with the $0.155 horizontal support area and the movement was preceded by bullish divergence in the MACD.
Since then, the token has been moving upwards. In addition to this, the Stochastic oscillator has made a bullish cross and the RSI has nearly moved above 50.
A reclaim of the middle of the channel would confirm that the trend is bullish.
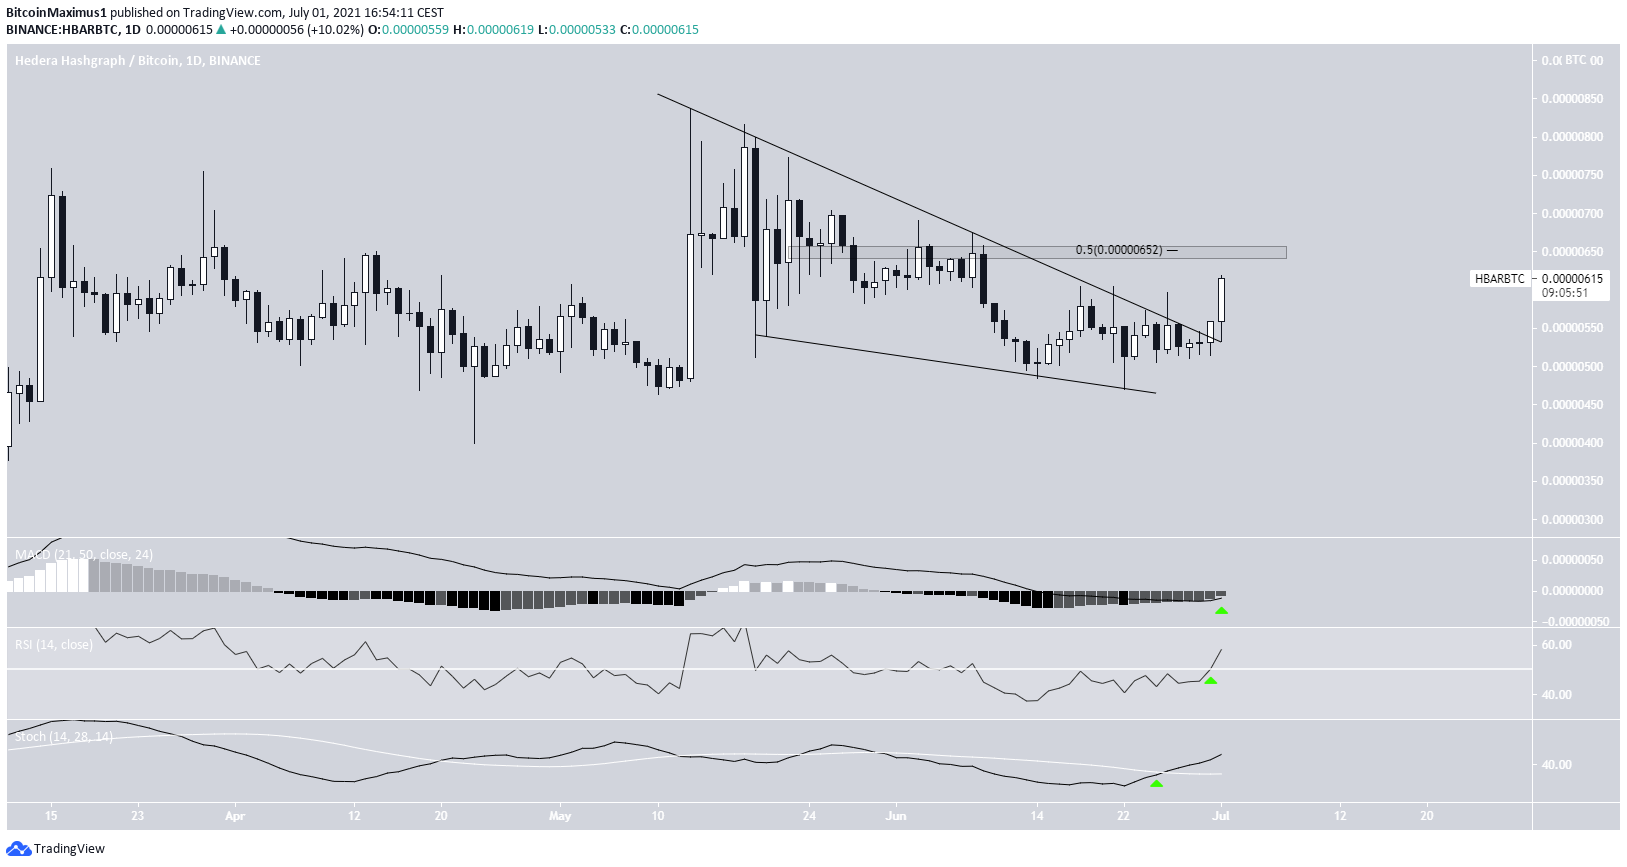
The HBAR/BTC chart looks similarly bullish. The token has broken out from a descending resistance line and is approaching the 0.5 Fib retracement resistance level at 652 satoshis, which is also a horizontal resistance area.
The Stochastic oscillator has made a bullish cross, the RSI has crossed above 50 and the MACD is nearly positive.
An increase above the 652 satoshi area could trigger a sharp upward movement.
Highlights
- HBAR is trading inside a descending parallel channel
- There is support at $0.155
ENJ
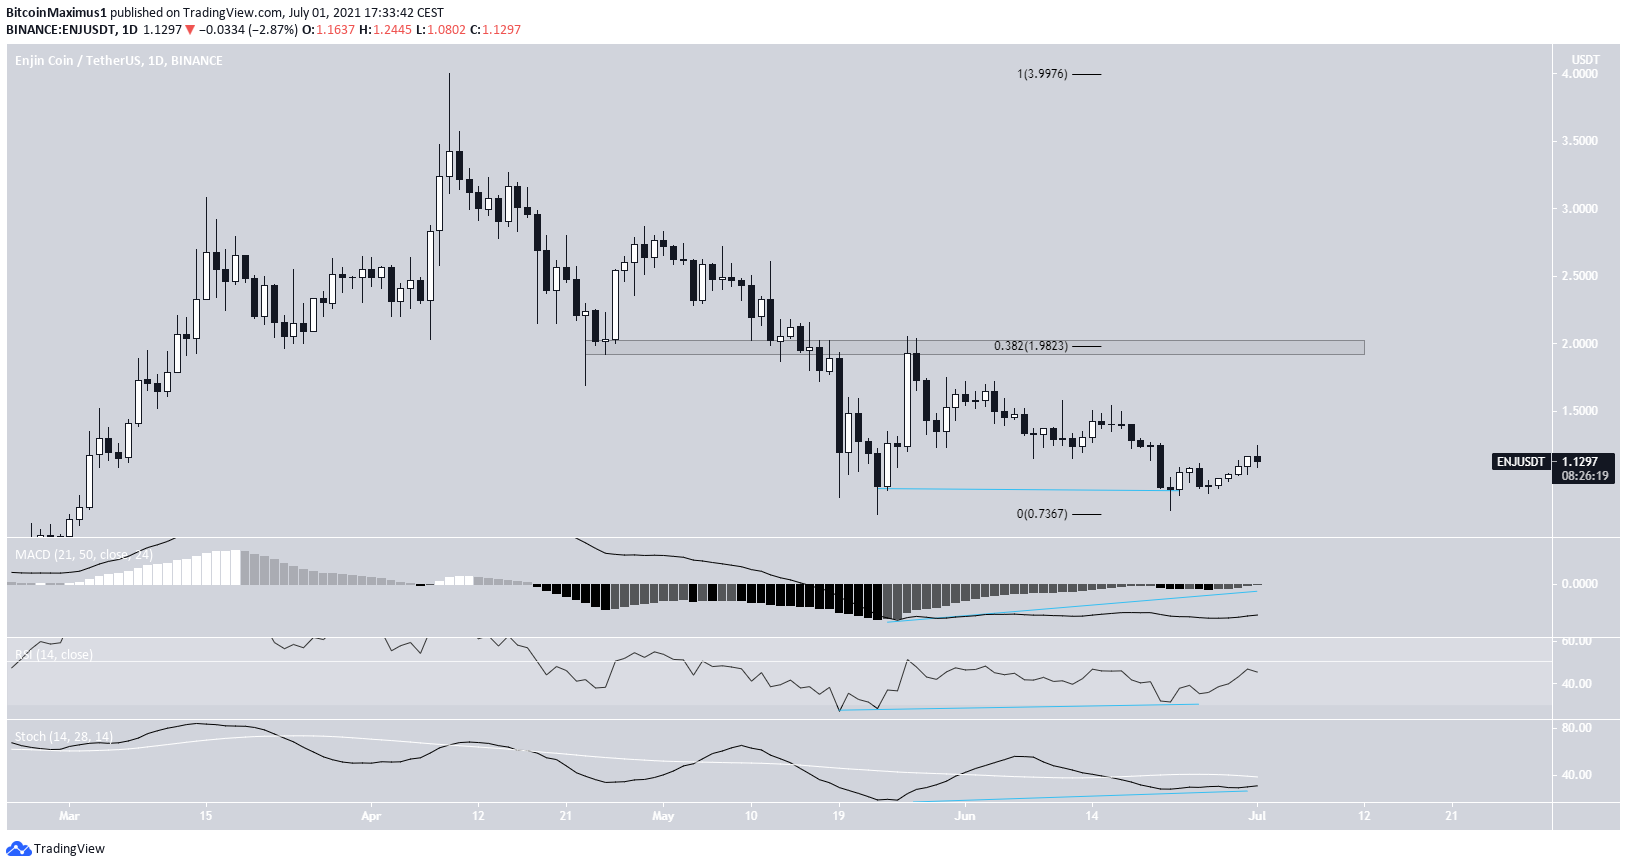
ENJ has been falling since April 9, when it reached an all-time high price of $4.
The token created a double bottom pattern on May 23 and June 22, doing so close to the $0.75 support area. In addition to this, the double bottom was accompanied by bullish divergence in the RSI, MACD & Stochastic oscillator.
Since then, ENJ has been increasing.
The closest resistance is at $1.98. This is both a horizontal resistance and the 0.382 Fib retracement resistance level.
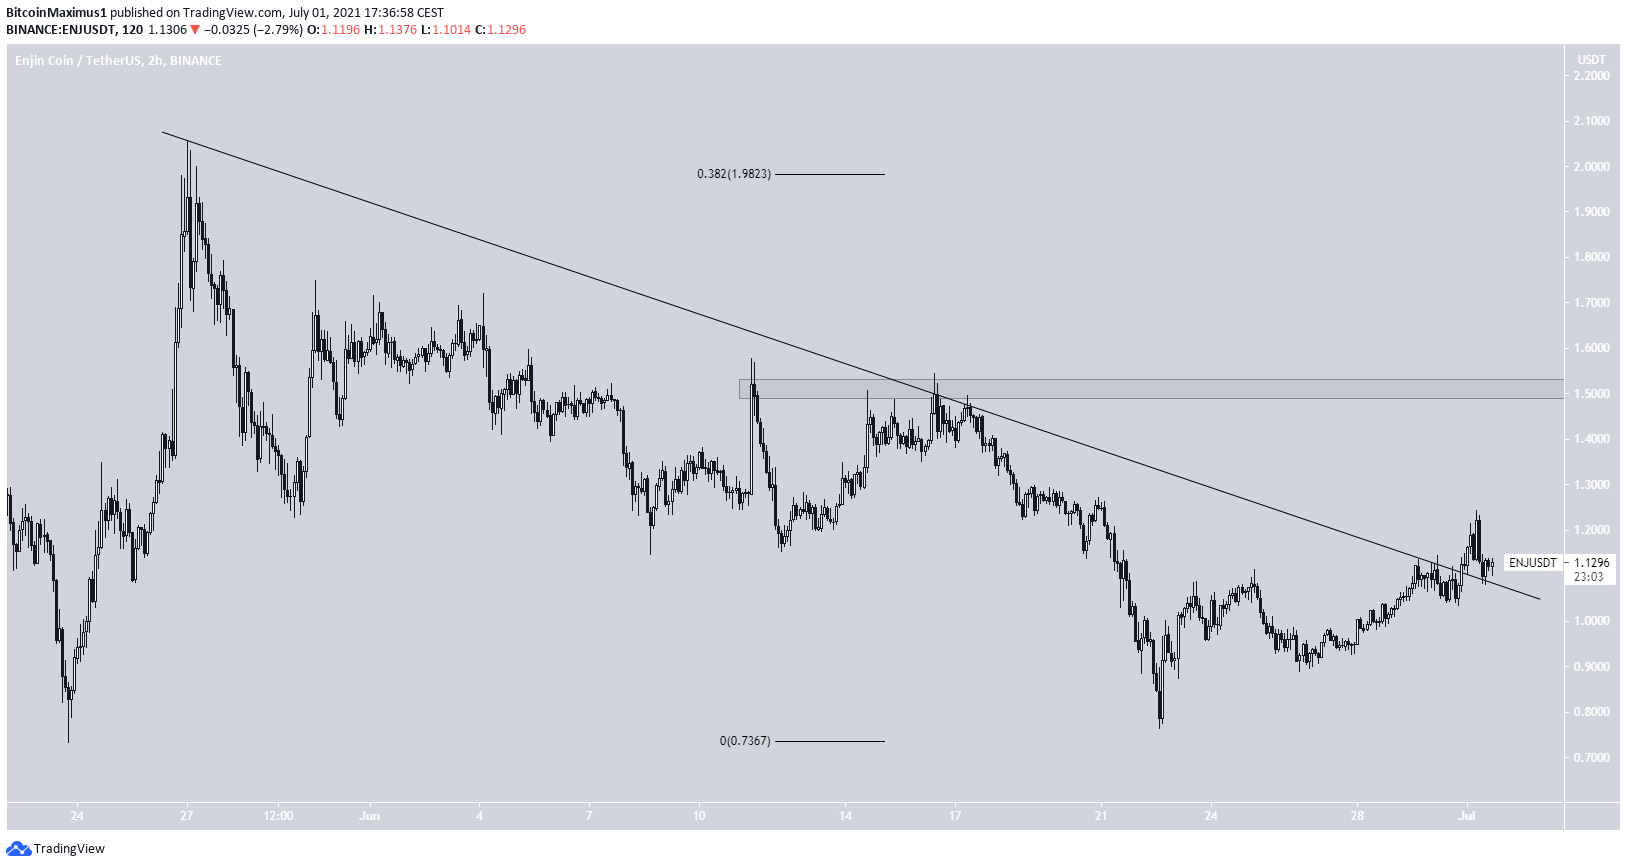
The shorter-term two-hour chart supports this possibility, since it shows a breakout from a descending resistance line.
There is minor resistance at $1.50.
Highlights
- ENJ has created a double bottom pattern
- It has broken out from a descending resistance line
HNT
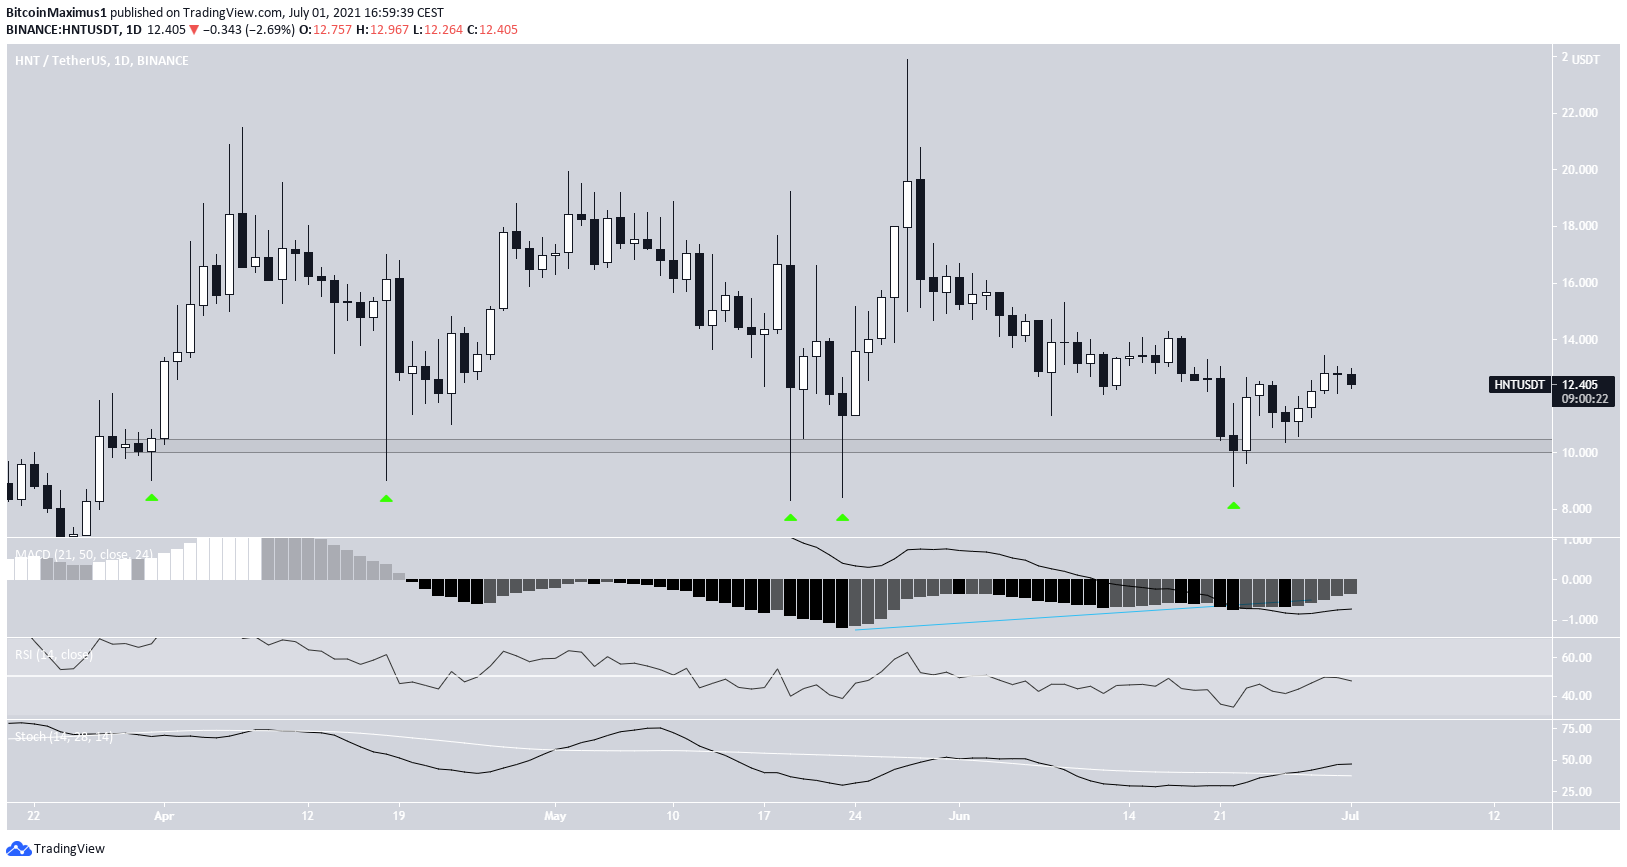
On June 22, HNT reached a low of $8.80. The ensuing bounce confirmed the $10.20 area as support. Since the end of March, the token has bounced on it five times.
The bounce was preceded by bullish divergence in the MACD. However, the rest of technical indicator readings are relatively neutral.
The Stochastic oscillator has made a bullish cross, but the RSI is still below 50. In addition, the MACD is negative.
Therefore, the direction of the trend cannot be accurately determined at the current time.
Highlights
- There is support at $10.20.
- Technical indicators are neutral.
For BeInCrypto’s latest bitcoin (BTC) analysis, click here.


