


The prices of both DFI.Money (YFII) and Yearn.Finance (YFI) have broken out from descending resistance lines and reclaimed important support levels shortly afterward.
It is possible that a number of DeFi coins have reached their bottoms after long decreases, as many are starting to rally upwards.
DFI.Money (YFII)
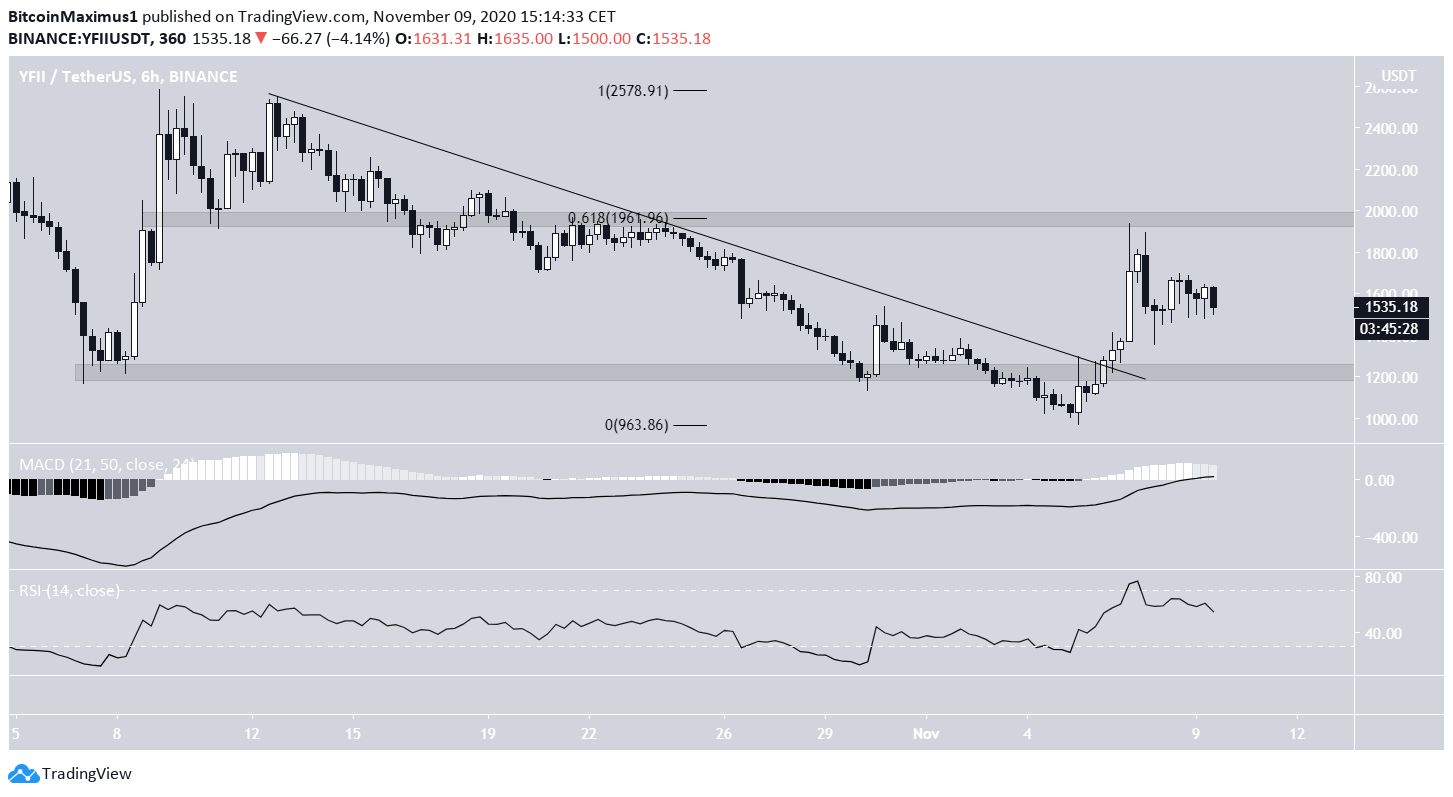
The YFII price has been increasing since it reached a low of $970 on Nov 5. Shortly after reaching the low, the price reclaimed the $1,240 area and proceeded to break out from a descending resistance line to reach a local high of $1,959.
However, the price was rejected by the $1,960 area after validating it as resistance. This area is the 0.618 Fib level of the entire downward move.
Technical indicators are relatively bullish since the MACD line has crossed above 0 and the RSI has crossed above 50. Therefore, as long as the price is trading above the $1,240 support level, it is expected to keep moving upwards and eventually make another breakout attempt.
Yearn.Finance (YFI)
Cryptocurrency trader @devchart outlined a YFI chart showing a possible bullish pennant pattern and state that the price could likely soon break out.
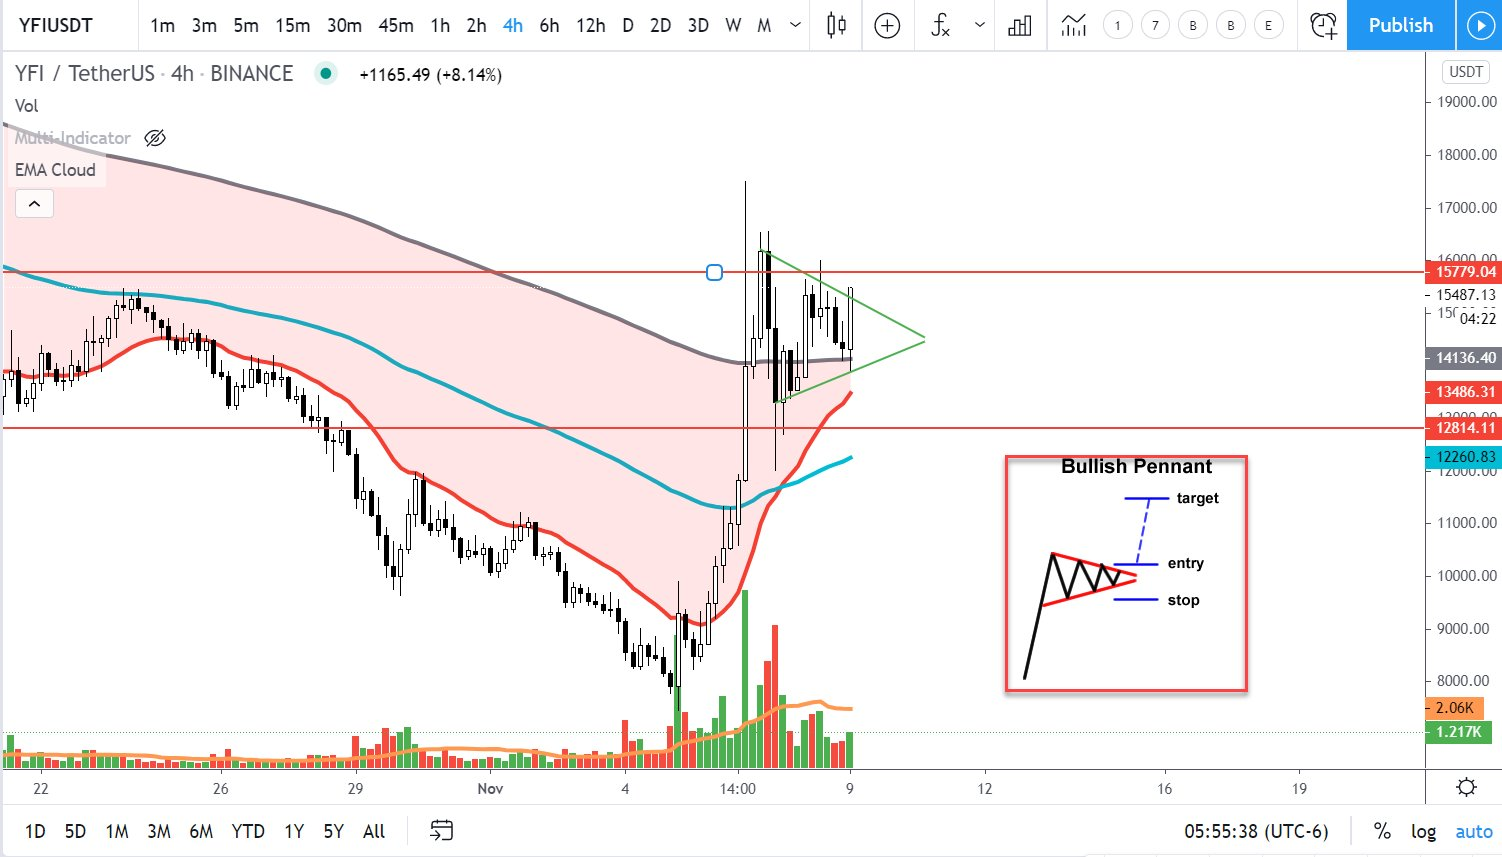
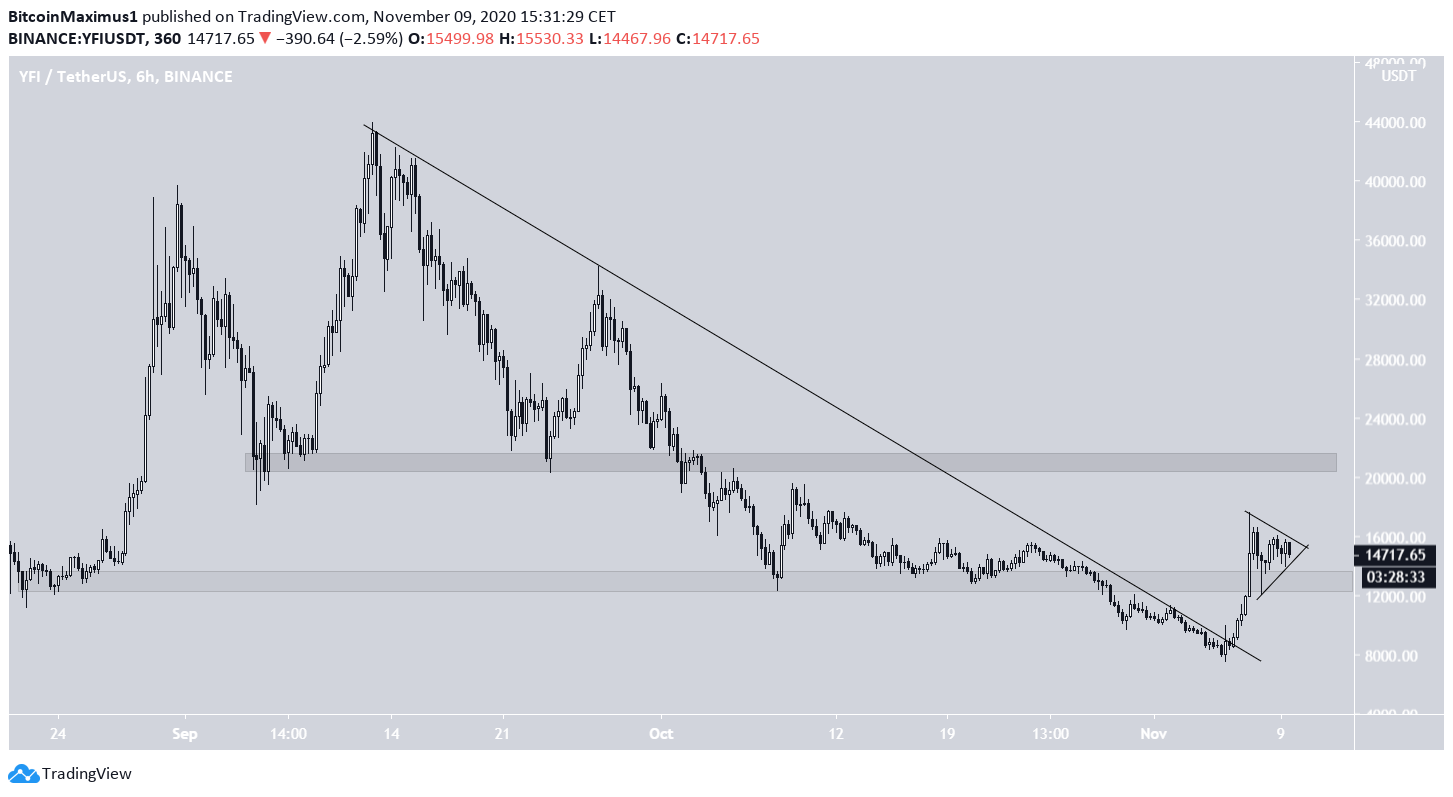
Similar to YFII, the YFI price has also broken out from a descending resistance line and reclaimed the $13,000 support area shortly after.
The pennant is considered a bullish continuation pattern, and since it is coming after an upward move, it would be expected to lead to a breakout.
If the price breaks out and continues moving upwards, it could reach the next resistance area at $21,000.
DeFi Perpetual Index (DEFI)
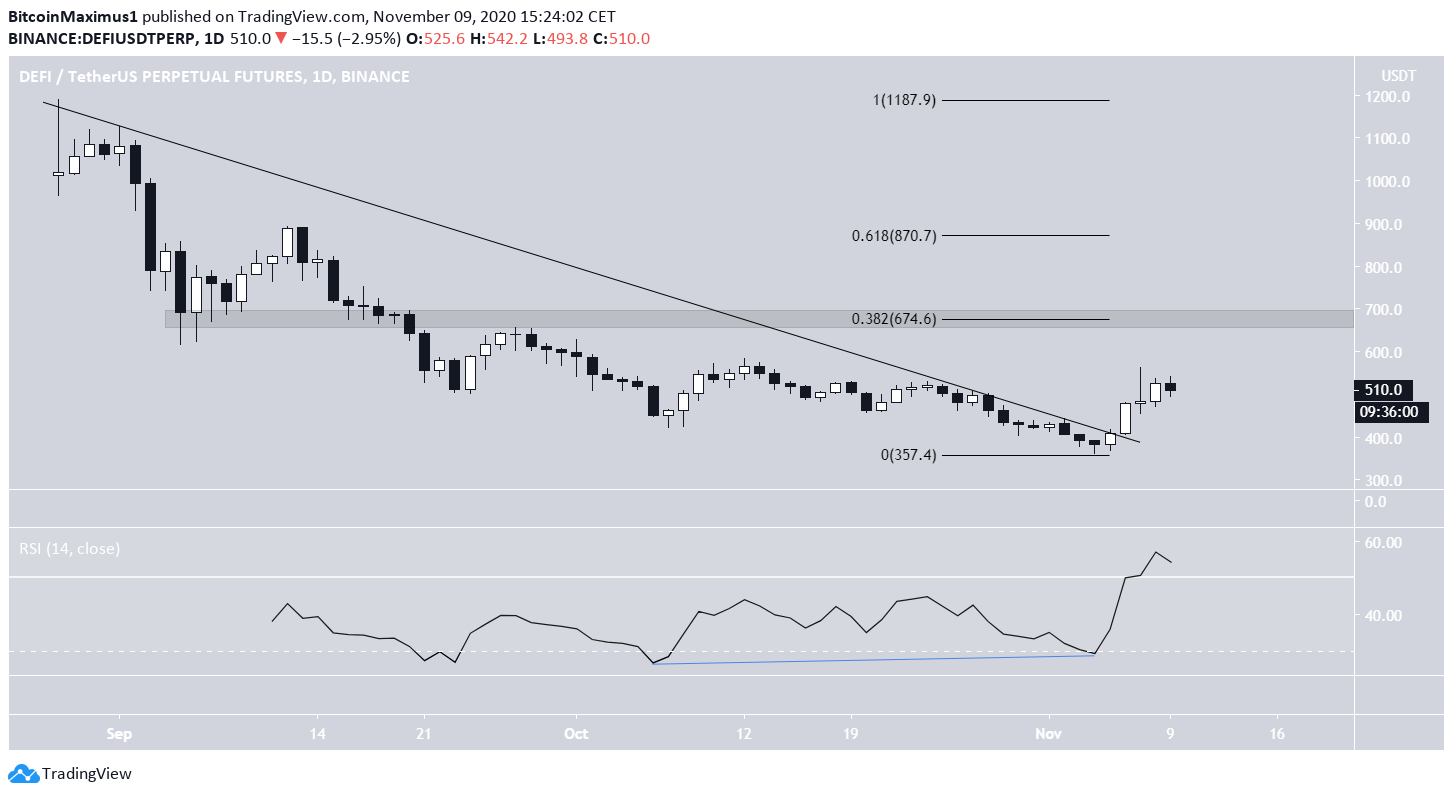
The DEFI index has been decreasing alongside a descending resistance line since Aug 28, when it reached a high of $1,181.
However, the daily RSI generated a considerable bullish divergence during the most recent lows, causing a trend reversal on Nov 4.
This led to a breakout from the descending resistance line and caused the daily RSI to move above 50, a bullish sign.
The DEFI index is expected to gradually move upwards towards the closest resistance area at $675.
Conclusion
The breakout from the DEFI index makes it possible that YFI and YFII along with numerous other DeFi coins have reached their bottoms and have now begun new rallies.
For BeInCrypto’s latest Bitcoin analysis, click here!
Disclaimer: Cryptocurrency trading carries a high level of risk and may not be suitable for all investors. The views expressed in this article do not reflect those of BeInCrypto.


