
BeInCrypto takes a look at the eight altcoins that decreased the most over the past seven days, from July 2 to July 9.
These altcoins are:
- Telcoin (TEL) : -26.15%
- Celo (CELO): -16.79%
- Hedera Hashgraph (HBAR): -11.56%
- VeChain (VET) : -11.23%
- Dogecoin (DOGE): -11.11%
- Internet Compuer (ICP) : -8.60%
- Qtum (QTUM) : -8.59%
- Stellar (XLM) : -8.58%
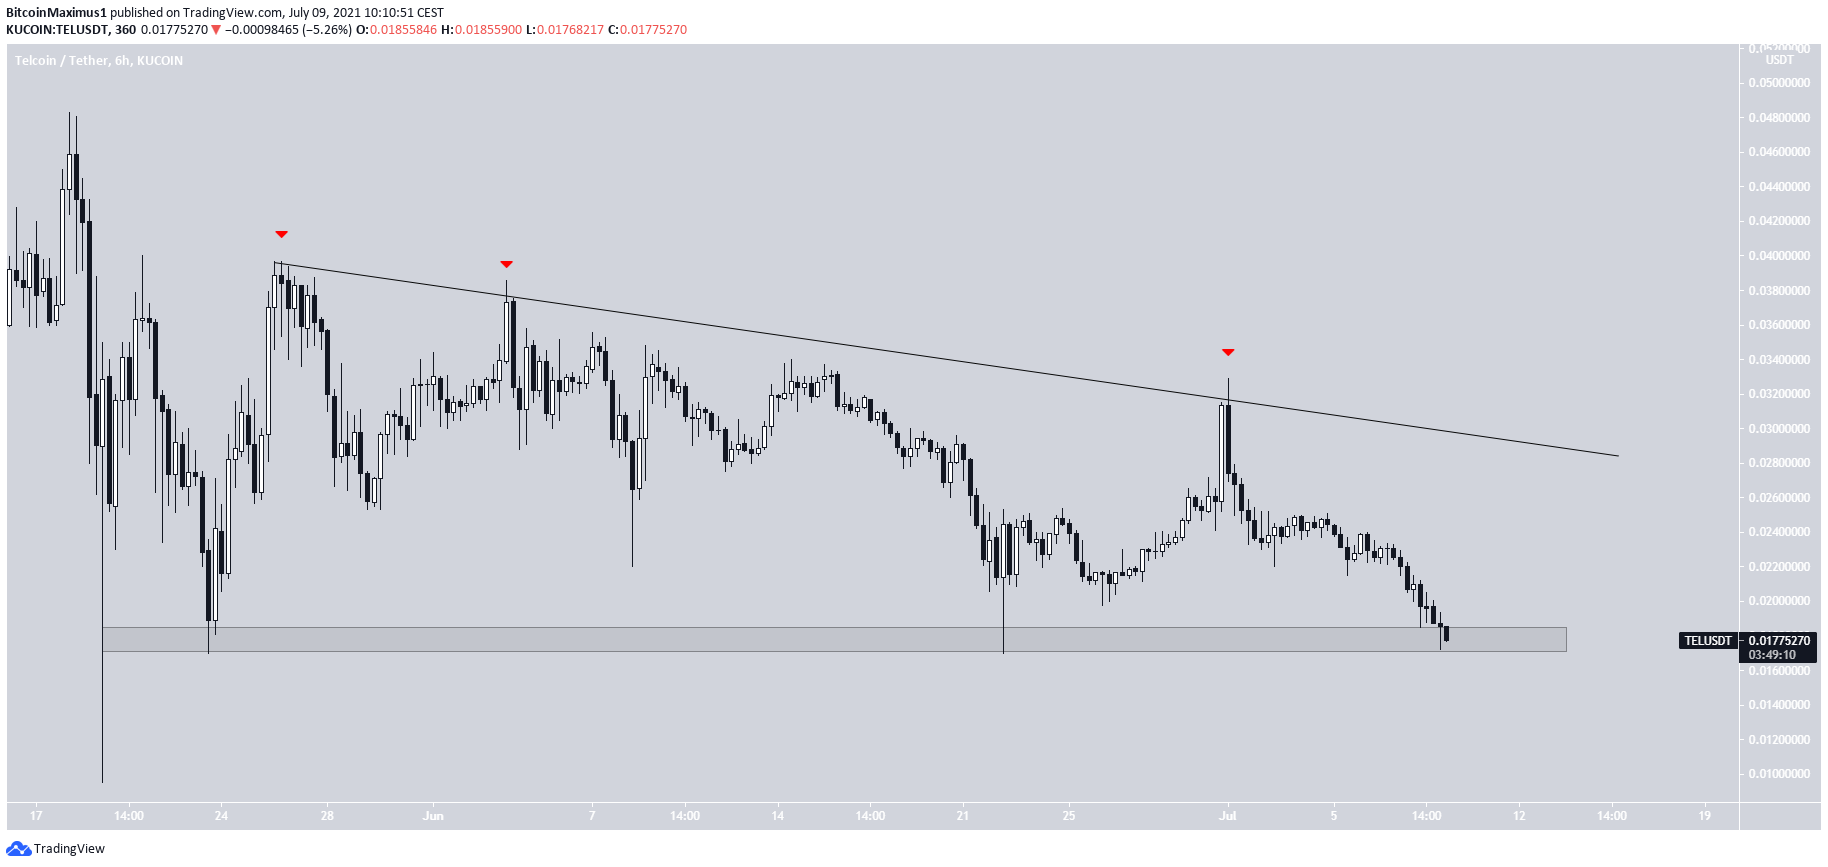
TEL
TEL has been decreasing alongside a descending resistance line since May 26. So far, it has been rejected by the line multiple times, most recently on July 1.
Throughout the pattern, it has bounced at the $0.018 horizontal support area numerous times.
When combined with the resistance line, this creates a potential descending triangle, which is normally considered a bearish pattern.
A breakdown could take TEL towards $0.01.
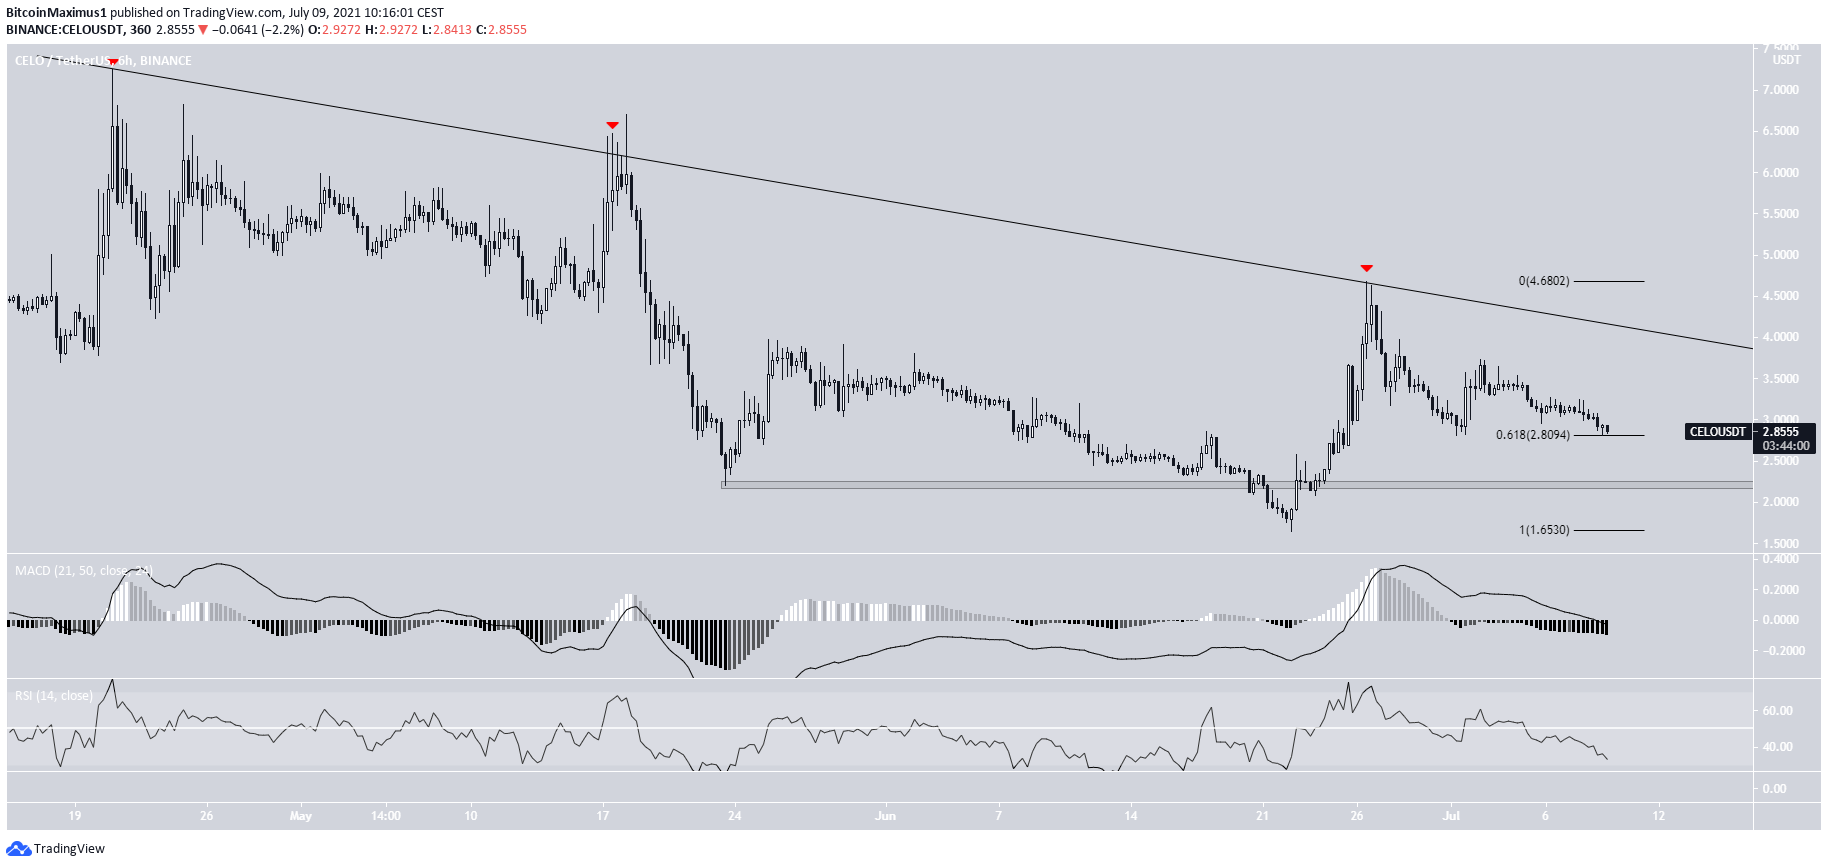
CELO
CELO has been decreasing alongside a descending resistance line since April 11, after it reached a high of $7.52. It was most recently rejected by the line on June 26.
For now, it’s trying to find support above the $2.80 support area, which is the 0.618 Fib retracement support level.
A breakdown below this level would most likely cause a decrease towards the next support at $2.05.
The MACD and RSI are both bearish. The former is negative while the latter has crossed below 50.
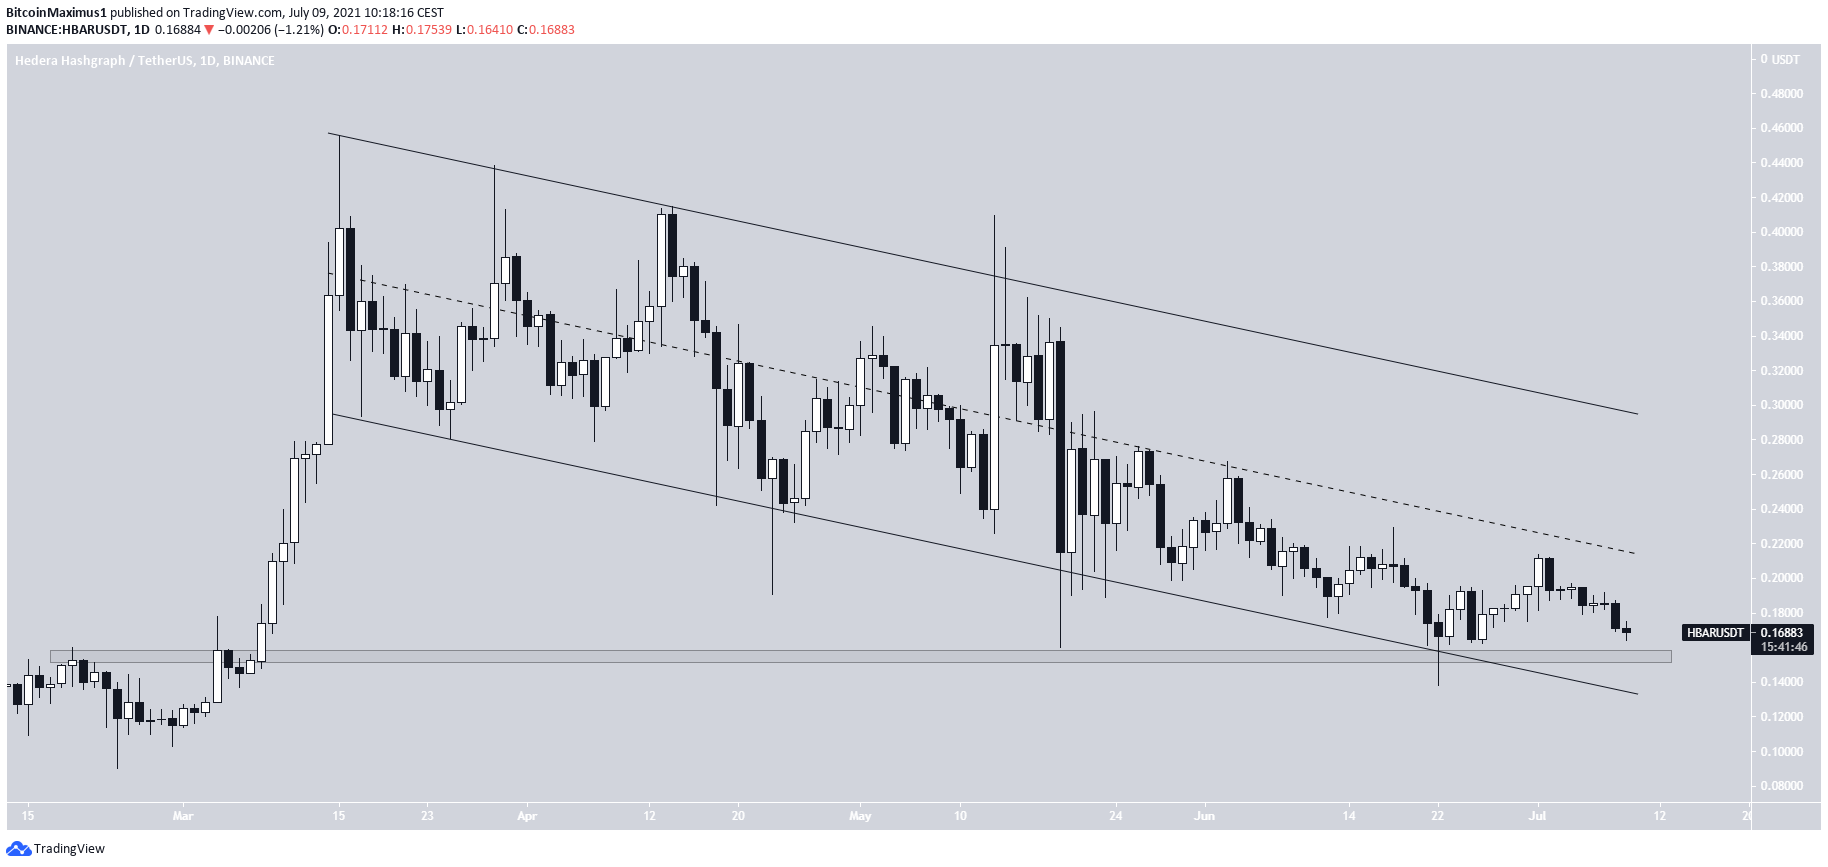
HBAR
HBAR has been trading inside a massive descending parallel channel since March 15, after reaching an all-time high price of $0.455. It has touched both the support and resistance lines numerous times.
It bounced at the support line of the channel on June 22. This also coincided with the $0.155 horizontal support area.
However, HBAR failed to reclaim the midline of the channel and is in the process of returning to the $0.155 support area once again.
Until it at least moves into the upper half of the channel, the trend cannot be considered bullish.
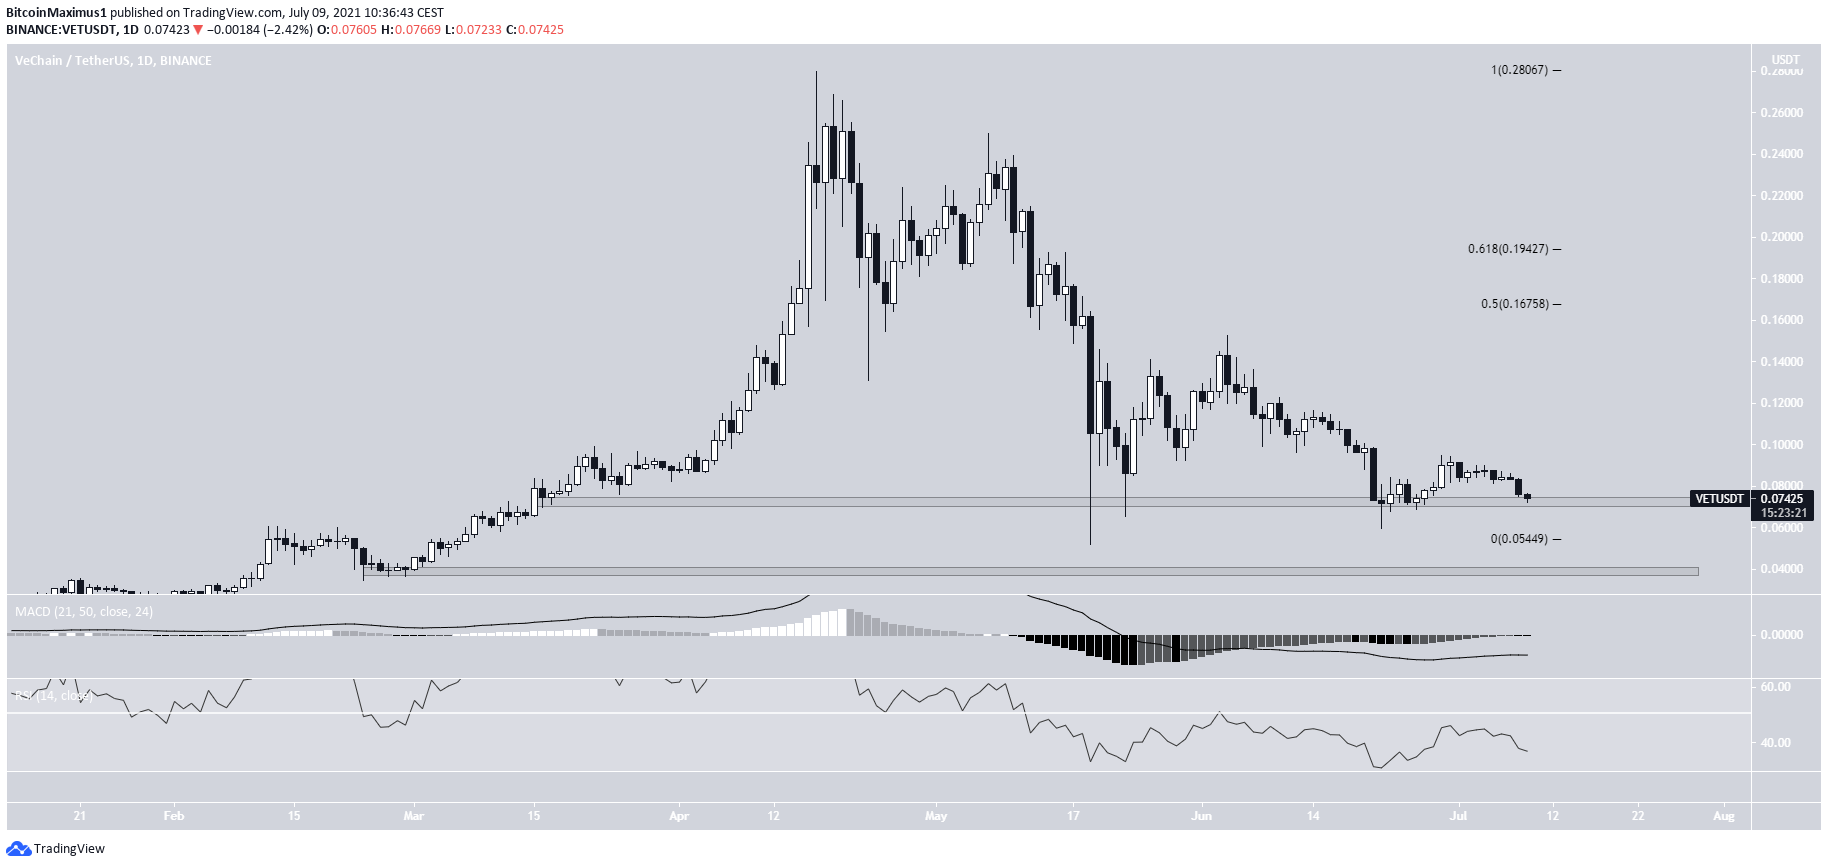
VET
On May 19, 23, and June 22, VET created a triple bottom pattern inside the $0.07 horizontal support area.
It initiated a bounce from this level, but it was short-lived. VET has returned to the $0.07 horizontal support area once again and there are no bullish reversal signs in place.
A breakdown could take VET all the way back to the $0.038 support area.
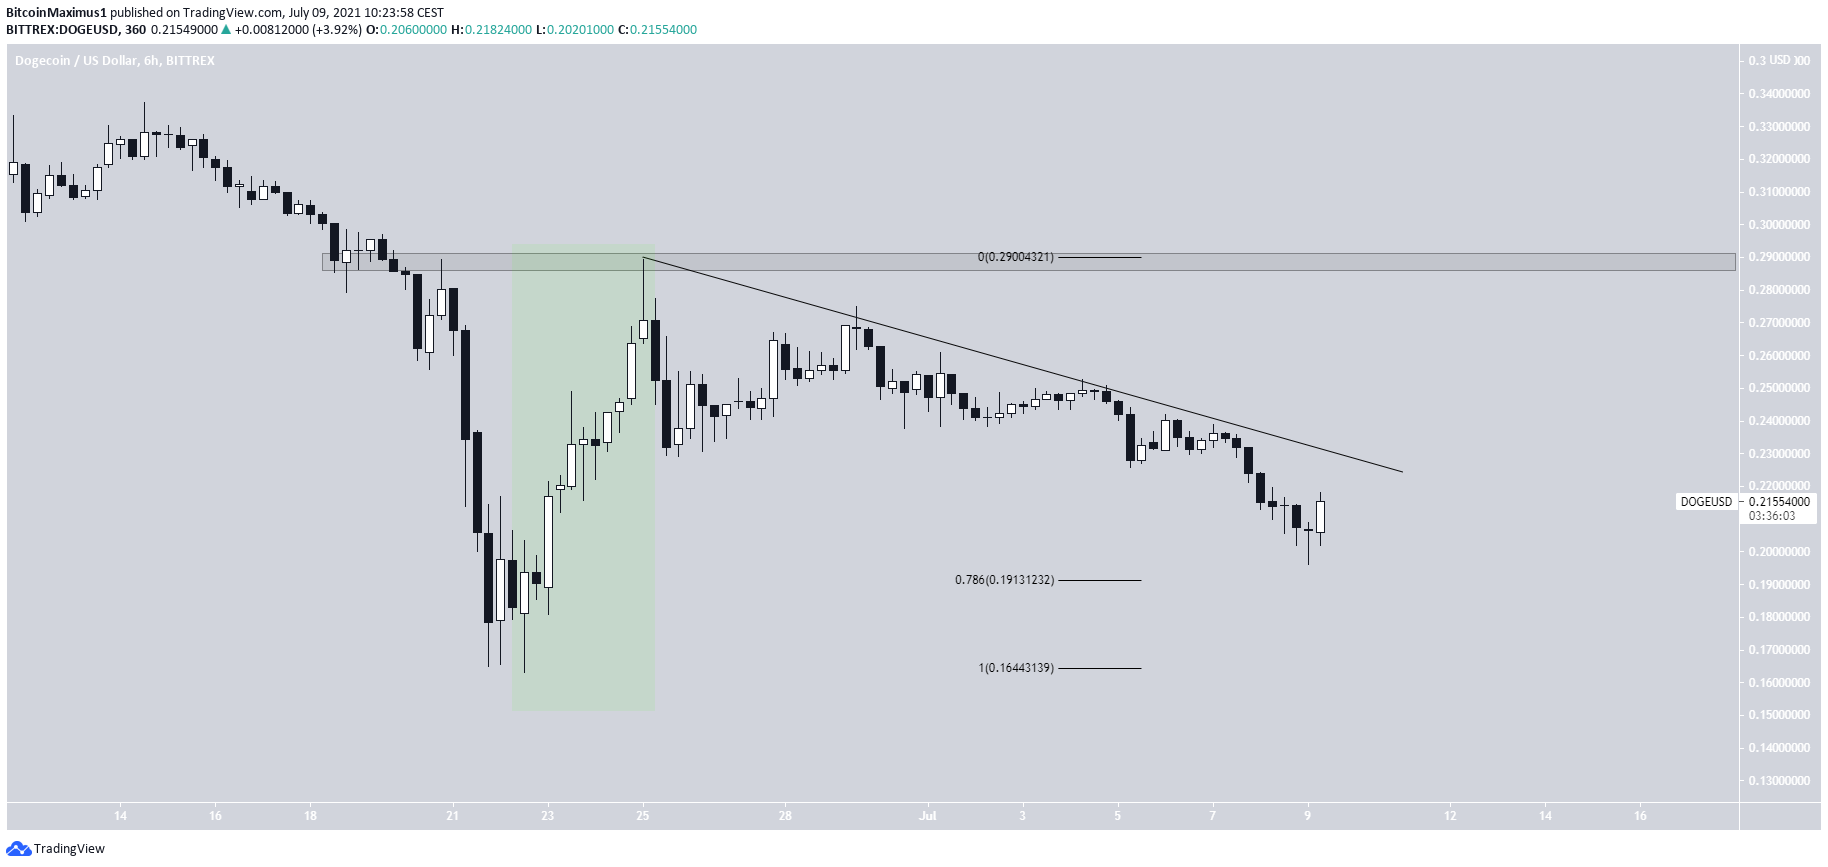
DOGE
On June 22, DOGE reached a low of $0.163 and bounced sharply, leading to a local high of $0.289 three days later. The upward movement looks impulsive (highlighted in green).
DOGE has been decreasing alongside a descending resistance line since.
On July 9, it reached the 0.786 Fib retracement support area at $0.191 and bounced. It’s currently making an attempt at breaking out from the aforementioned descending resistance line.
Doing so would likely lead to an upward move toward the $0.29 horizontal resistance area.
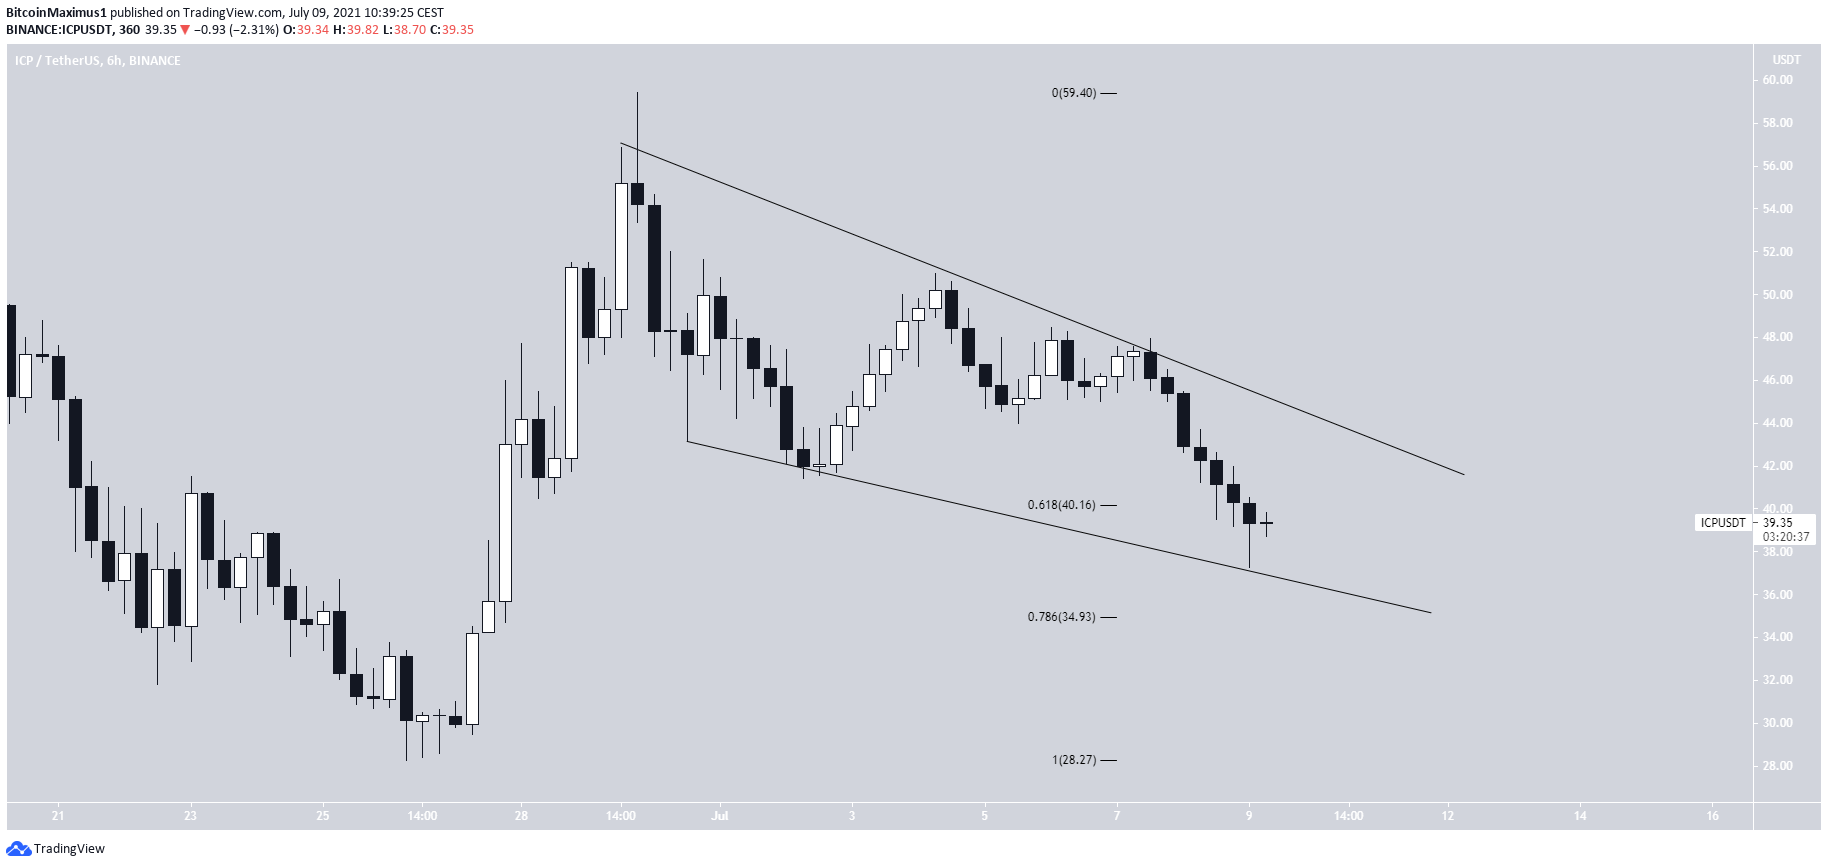
ICP
On June 26, ICP started moving up after reaching a low of $28.26. The bounce led to a high of $59.45, on June 29.
ICP has been moving downwards since. On July 8, it broke down below the $40 support area, which is the 0.618 Fib retracement support level.
The next support is found at $35 (the 0.786 Fib retracement level). It’s possible that ICP is trading inside a descending wedge.
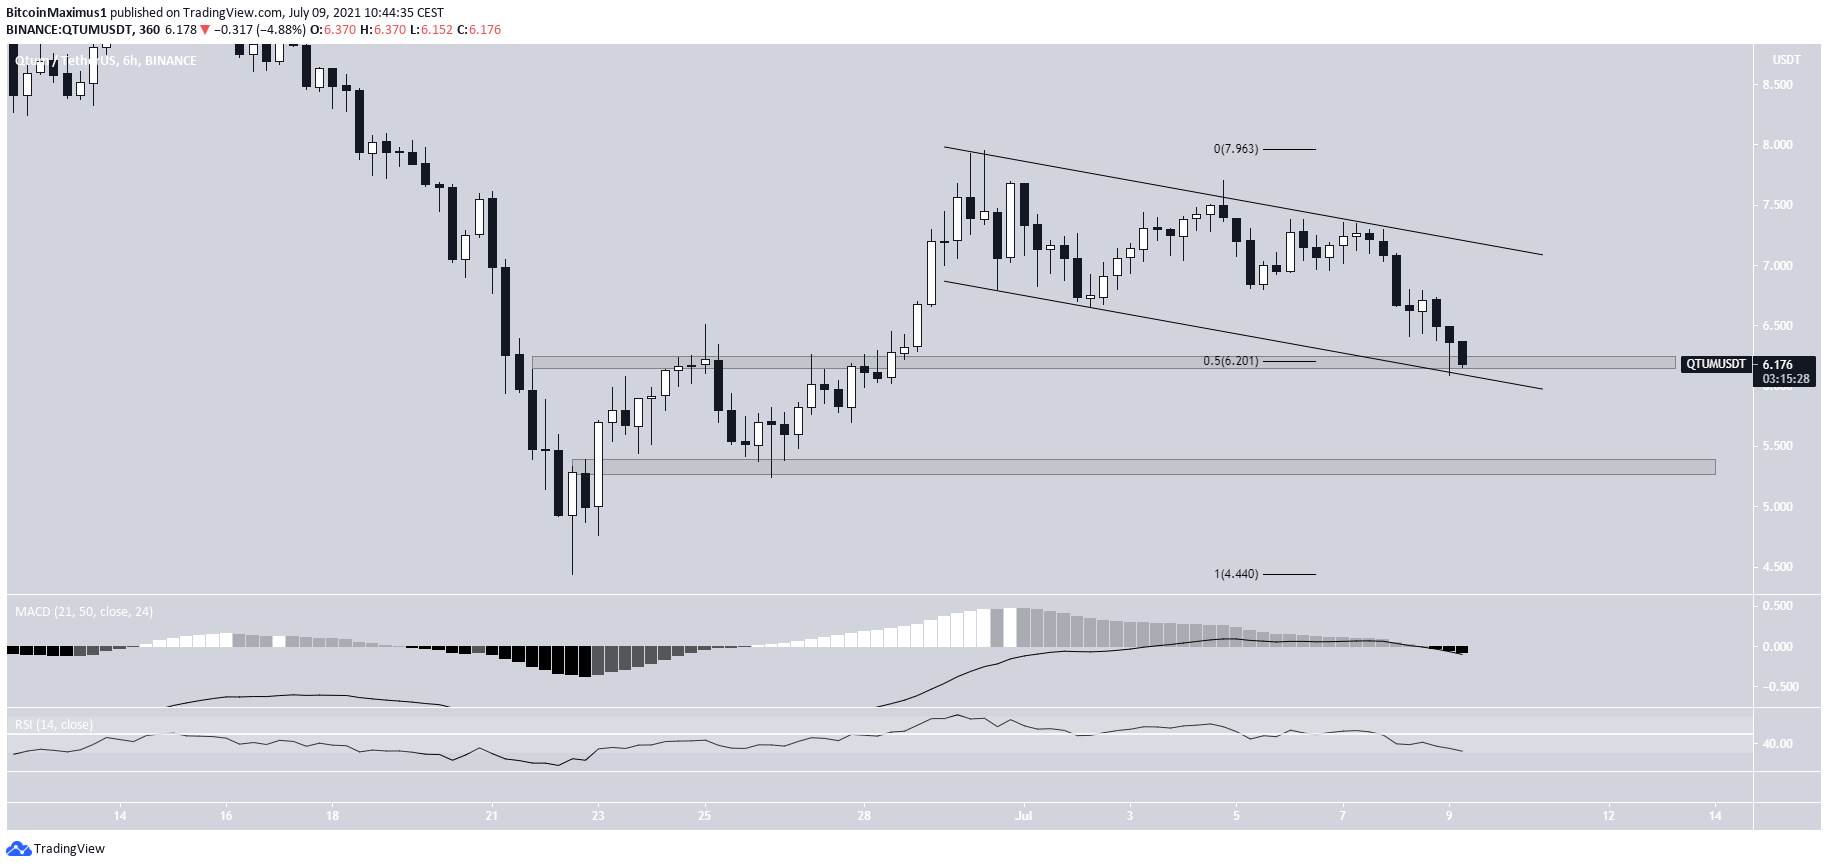
QTUM
QTUM has been decreasing since June 30, trading inside a short-term descending parallel channel.
Currently, it’s trading at a confluence of support levels created by the support line of the channel, 0.5 Fib retracement level, and a horizontal support area.
While this is an ideal level for a bounce, technical indicators are still bearish.
A breakdown from the channel would likely take QTUM towards the $5.30 horizontal support area.
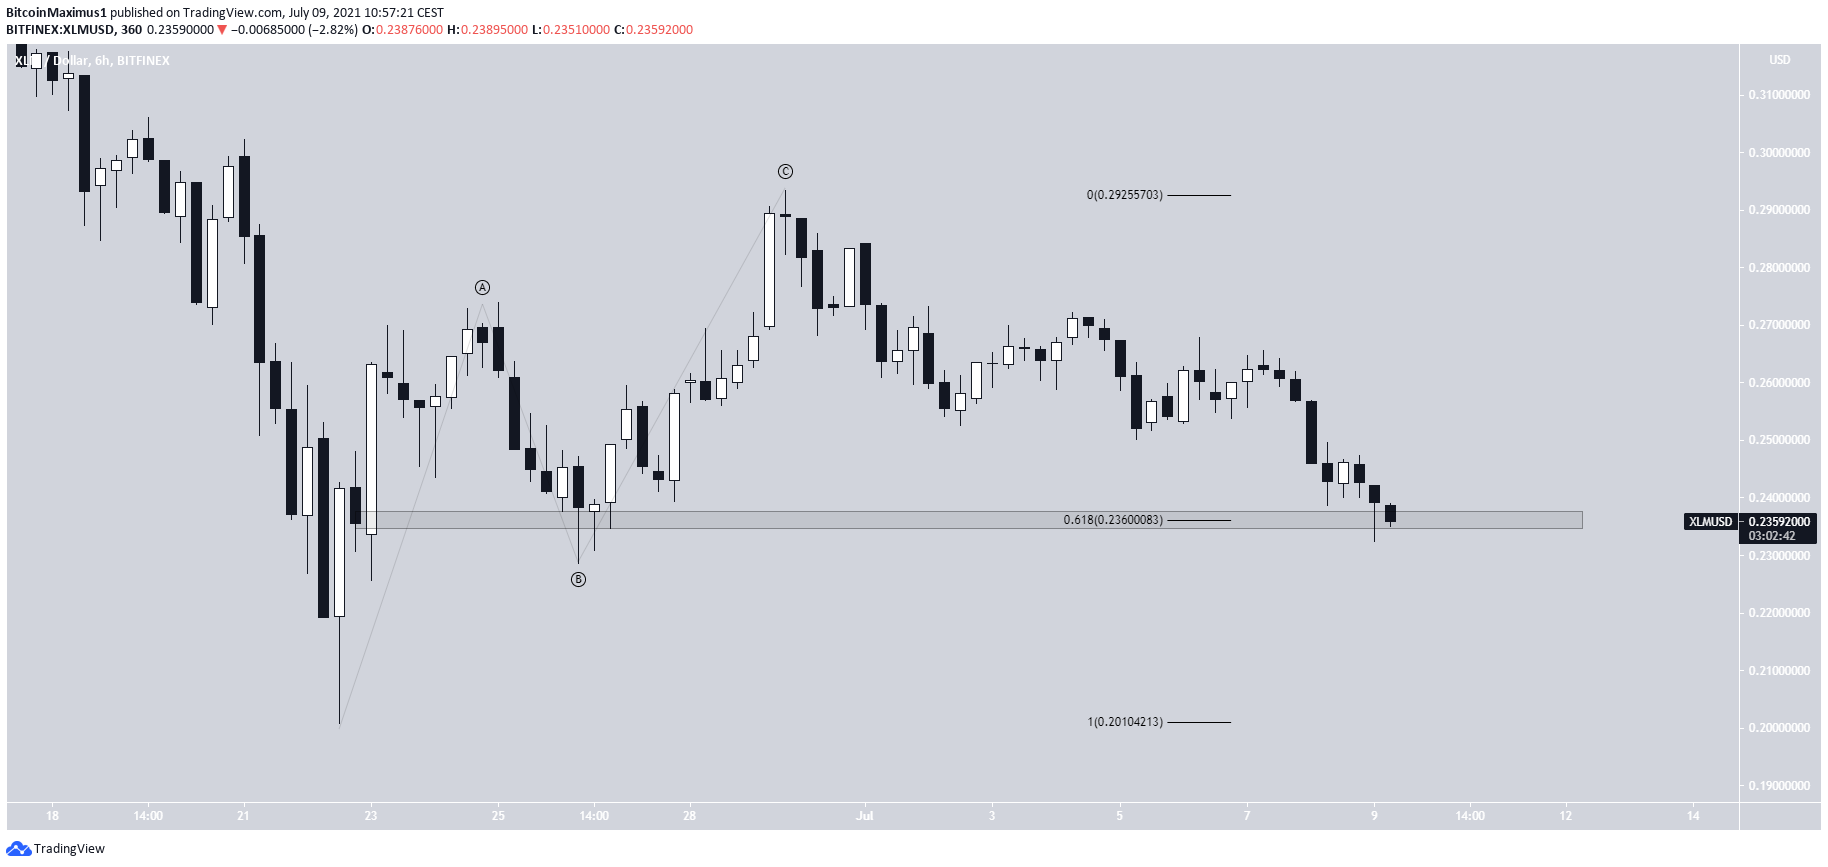
XLM
XLM bounced on June 22 after reaching a low of $0.20. This led to a high of $0.293 on June 29. The upward movement appears to be a three-wave structure, which is likely to be corrective.
XLM has been decreasing since and is currently trading at the 0.618 Fib retracement support level at $0.236.
A breakdown below this area would likely take XLM back towards $0.20.
For BeInCrypto’s latest bitcoin (BTC) analysis, click here.
