


The past seven days have been bullish for the cryptocurrency industry, with only one token decreasing in double digits. The eight tokens that decreased the most last week were:
- Smooth Love Potion (SLP): -20.82%
- Compound (COMP): -6.29%
- SHIBA INU (SHIB): -4.53%
- Flow (FLOW): -1.84%
- Mdex (MDX): -1.56%
- Kucoin Token (KCS): -1.49%
- SushiSwap (SUSHI): -0.33%
- Stacks (STX): -0.10%
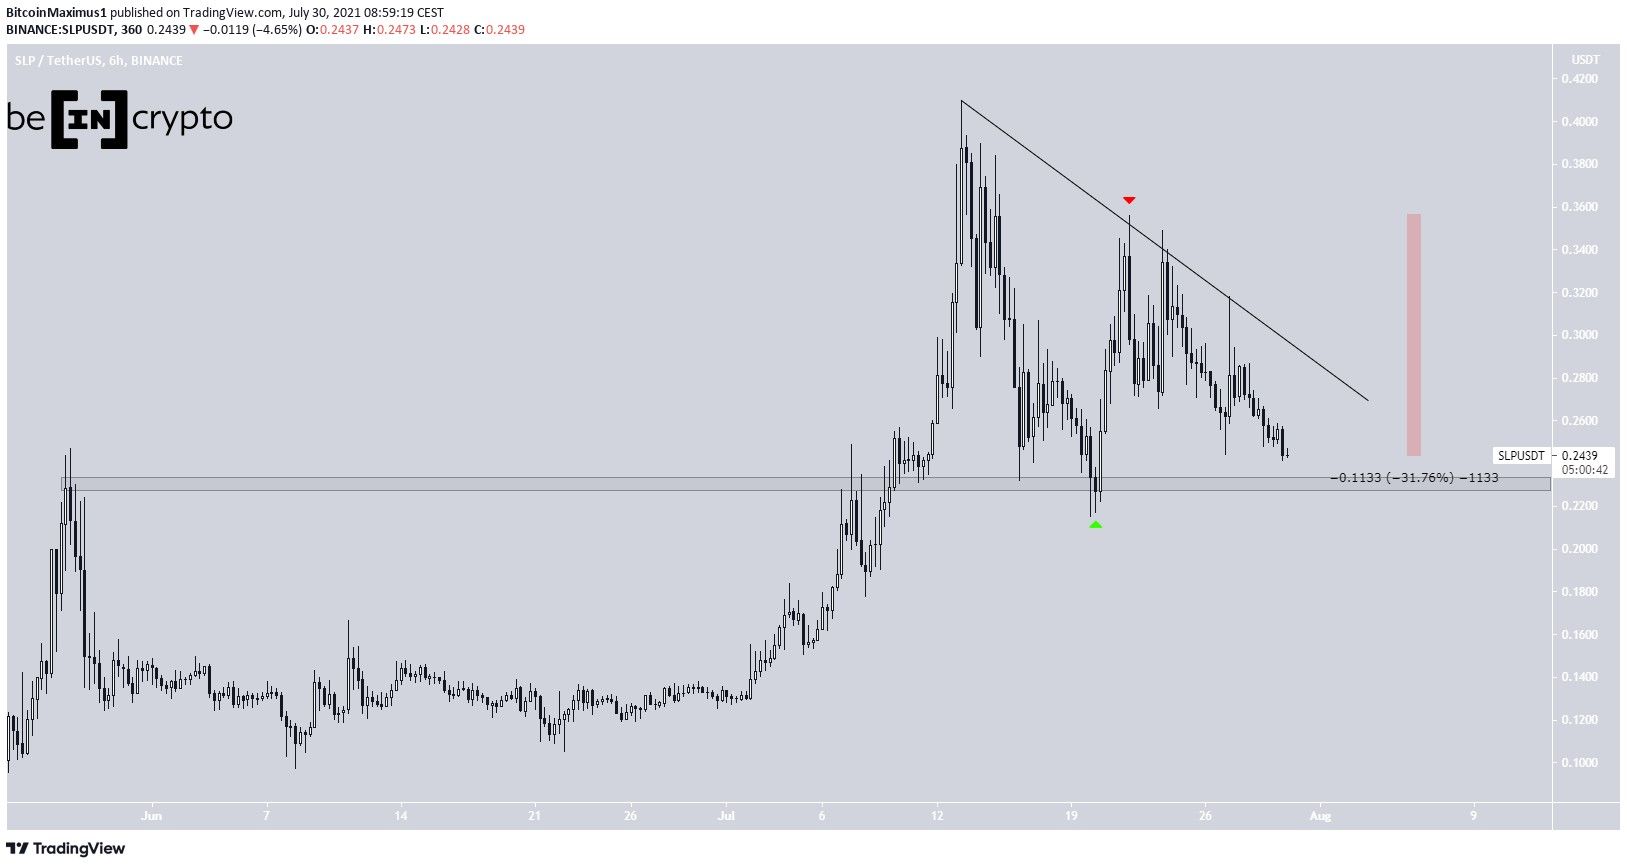
SLP
SLP reached a low of $0.21 on July 20 and bounced (green icon). The bounce validated the $0.23 horizontal level as support.
However, the token was rejected by a descending resistance line (red icon) two days later and has been moving downwards since. Since the rejection, it has dropped by 31.76%
It’s rapidly approaching the $0.23 horizontal level once again.
Whether SLP breaks out above the descending resistance line or breaks down below the horizontal support area will likely determine the direction of the future trend.
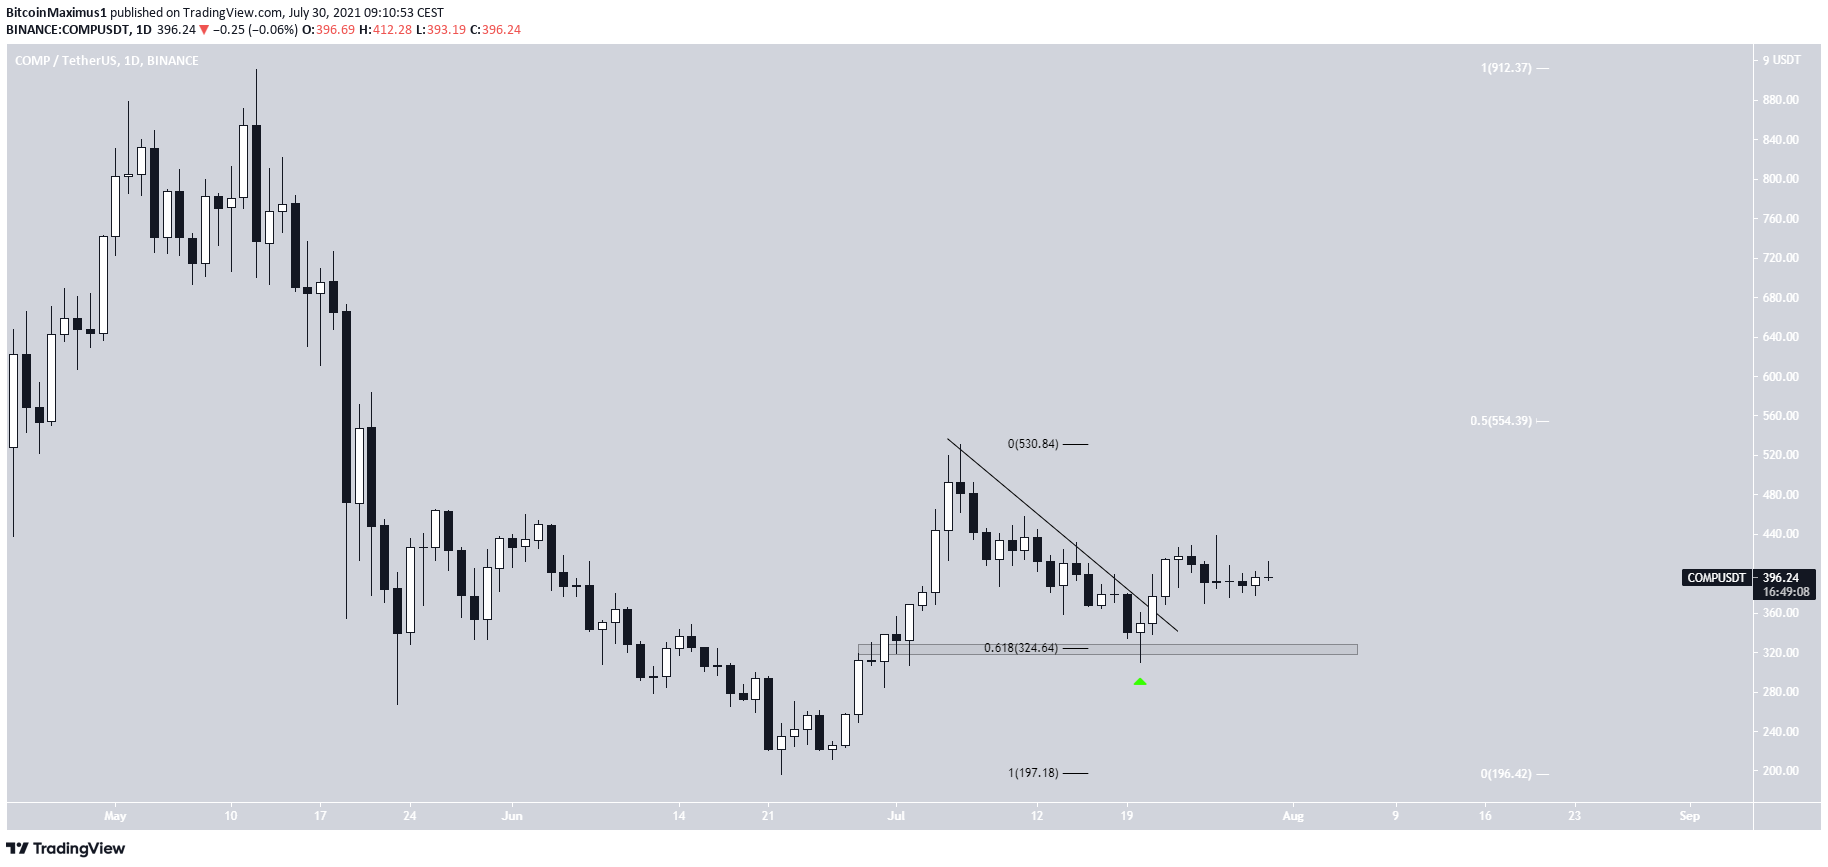
COMP
COMP had been decreasing underneath a descending resistance line since July 6. This led to a low of $310 on July 20.
COMP bounced after, validating the 0.618 Fib retracement level as support (green icon). As long as it’s trading above this level, the trend can be considered bullish.
The main resistance area is found at $554. This is the 0.5 Fib retracement resistance level (white) when measuring the entire downward move since May.
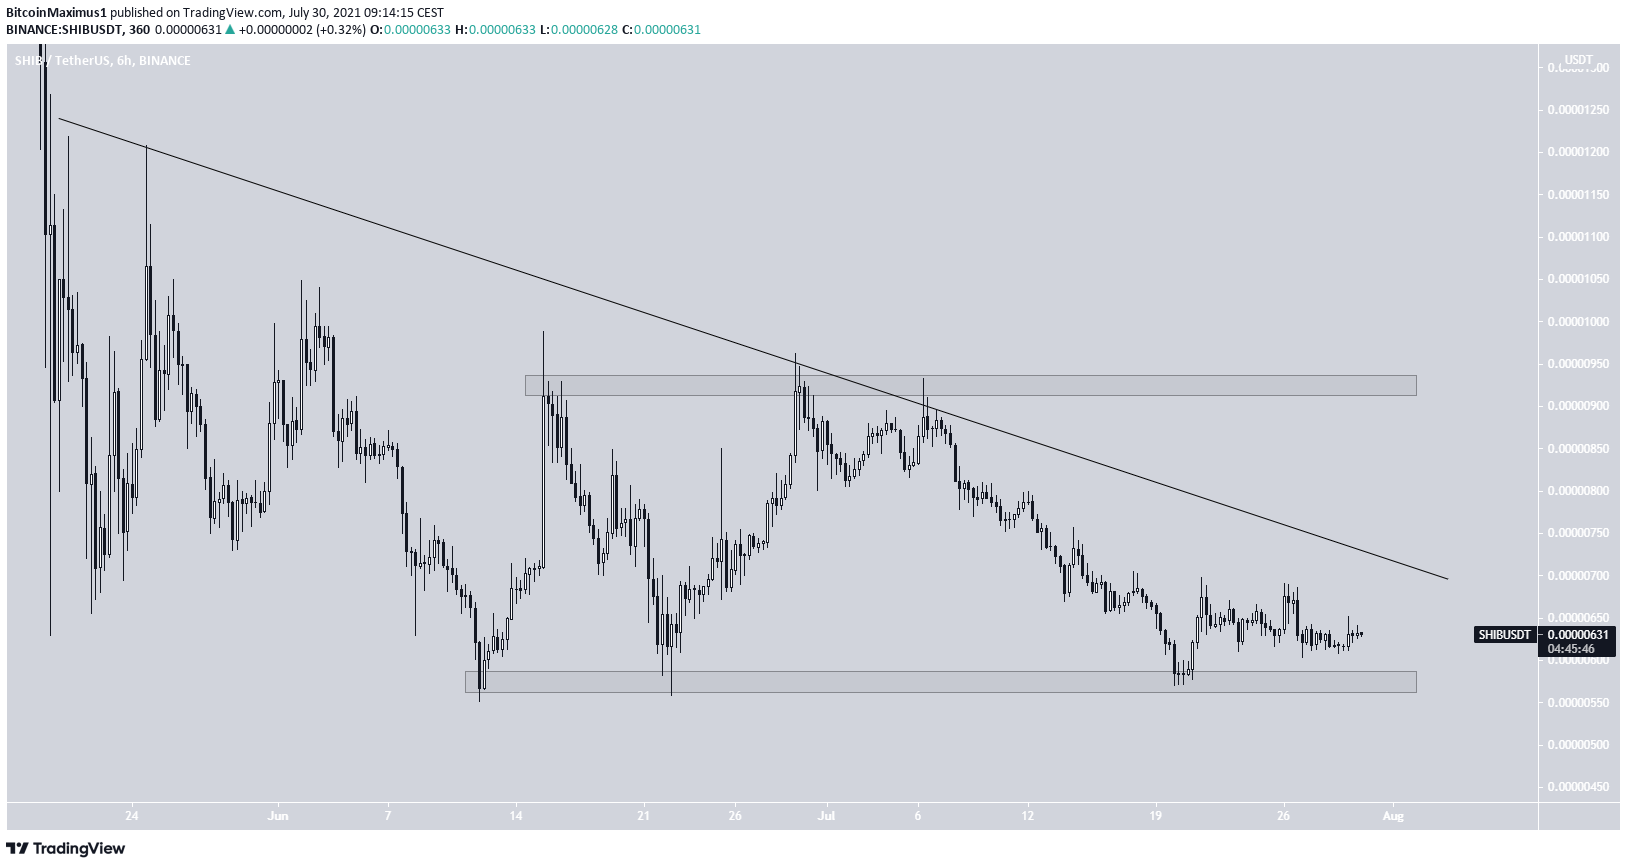
SHIB
SHIB has been decreasing alongside a descending resistance line since May 19. On June 12, it reached the $0.00000575 support area and bounced.
However, it returned to the same level two more times, on June 22 and July 20.
SHIB has failed to move above the aforementioned descending resistance line and was recently rejected by it on July 6.
A breakout above the line would likely take SHIB towards the $0.00000930 resistance area. Conversely, a breakdown below the current support area would likely take it to new lows.
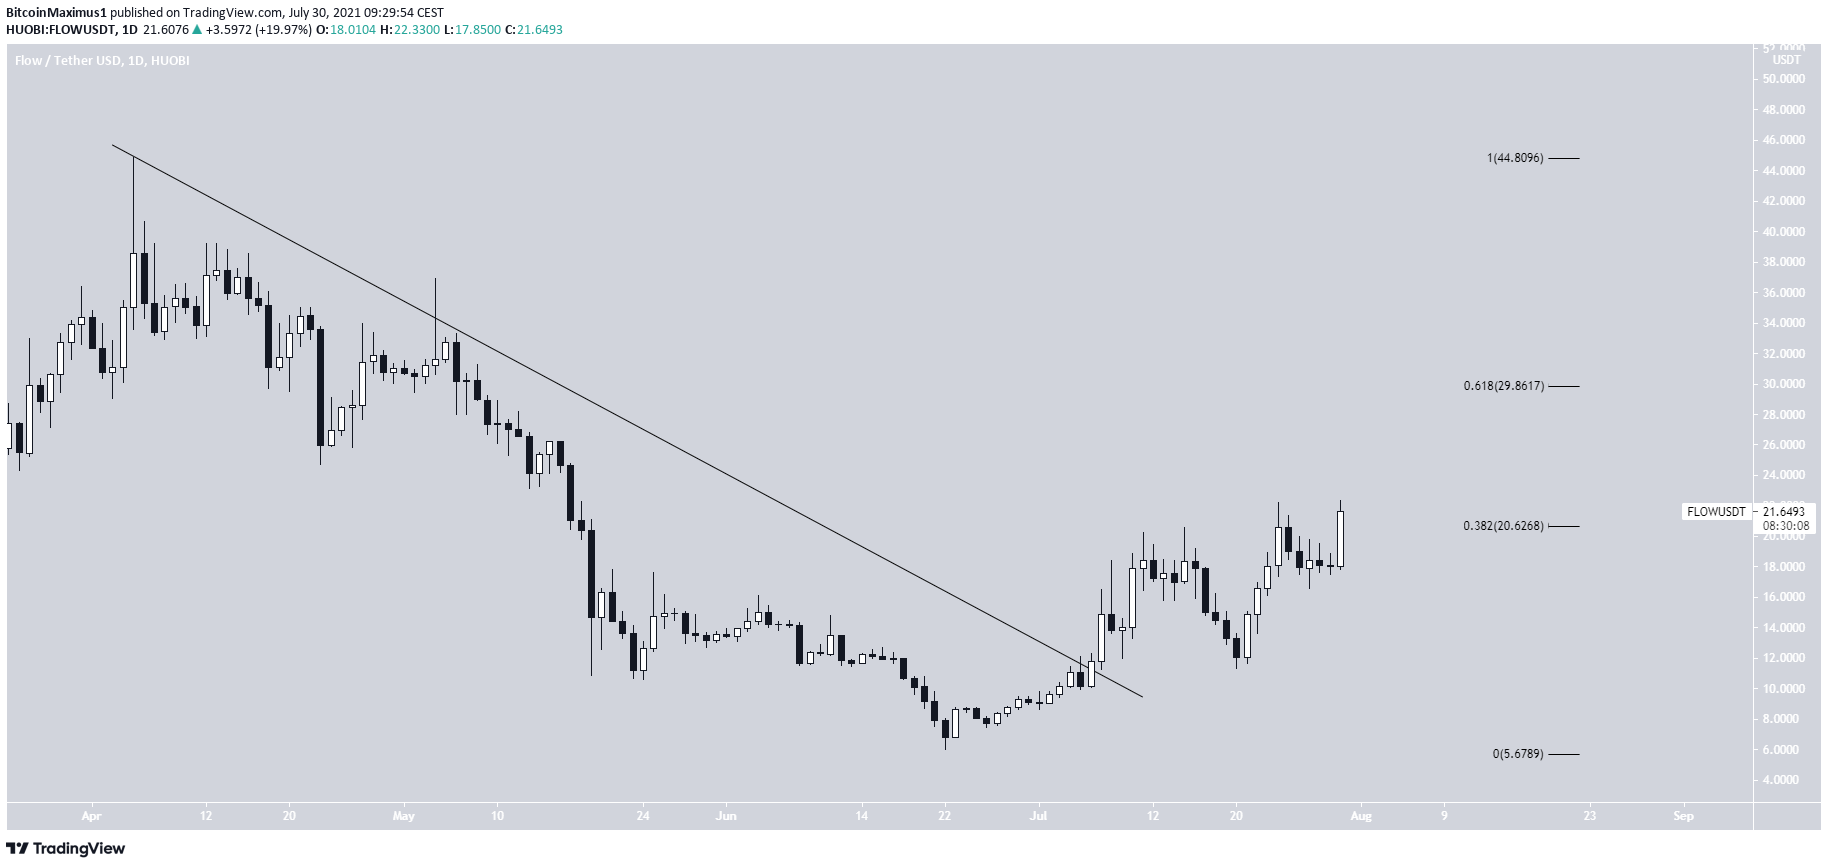
FLOW
On July 6, FLOW broke out from a descending resistance line and seemingly initiated an upward move.
However, it was rejected twice by the 0.382 Fib retracement resistance level of $20.62.
FLOW created a higher low on July 20 and moved upwards. It’s currently in the process of breaking out above the aforementioned resistance area at $20.62. If successful, it would likely trigger a sharp move toward $29.86.
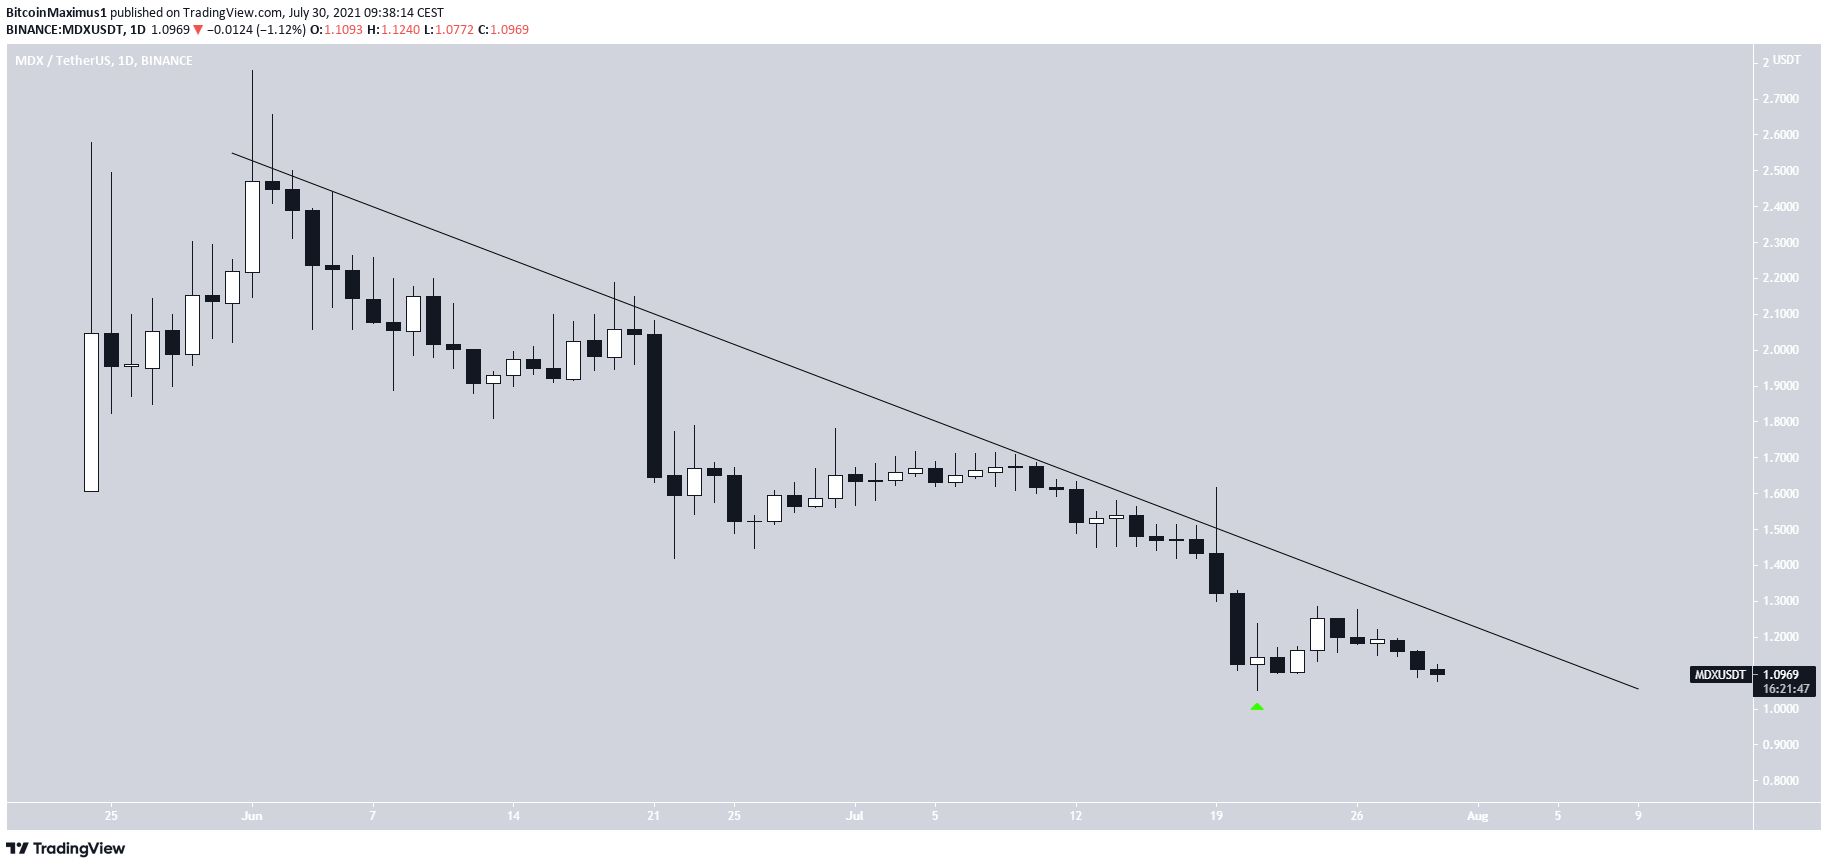
MDX
MDX has been decreasing under a descending resistance line since June 1. On July 21, it fell to a new all-time low price of $1.05.
The price bounced after this and approached $1.05 again. However, there are no bullish reversal signs in place, indicating that MDX could fall to a new all-time low soon.
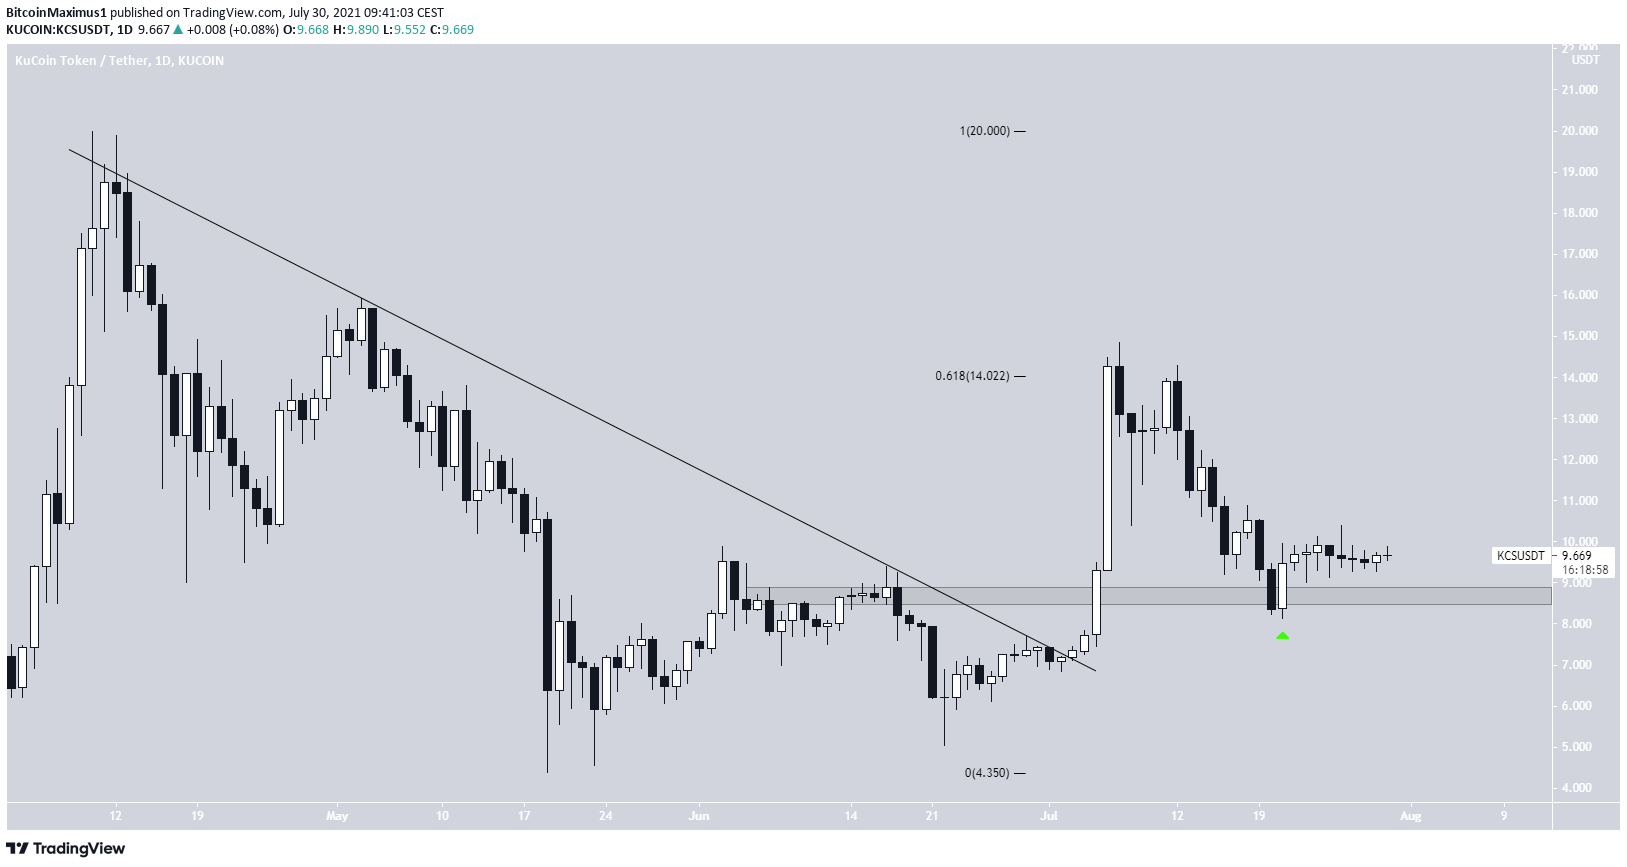
KCS
On July 3, KCS broke out from a descending resistance line. It proceeded to reach a high of $14.84 on July 7.
However, this caused a rejection from the 0.618 Fib retracement resistance level at $14.02 and led to a downward move that took KCS to the $8.50 horizontal support area.
As long as KCS is trading above this level, it’s likely to increase toward the $14.02 resistance area once again.
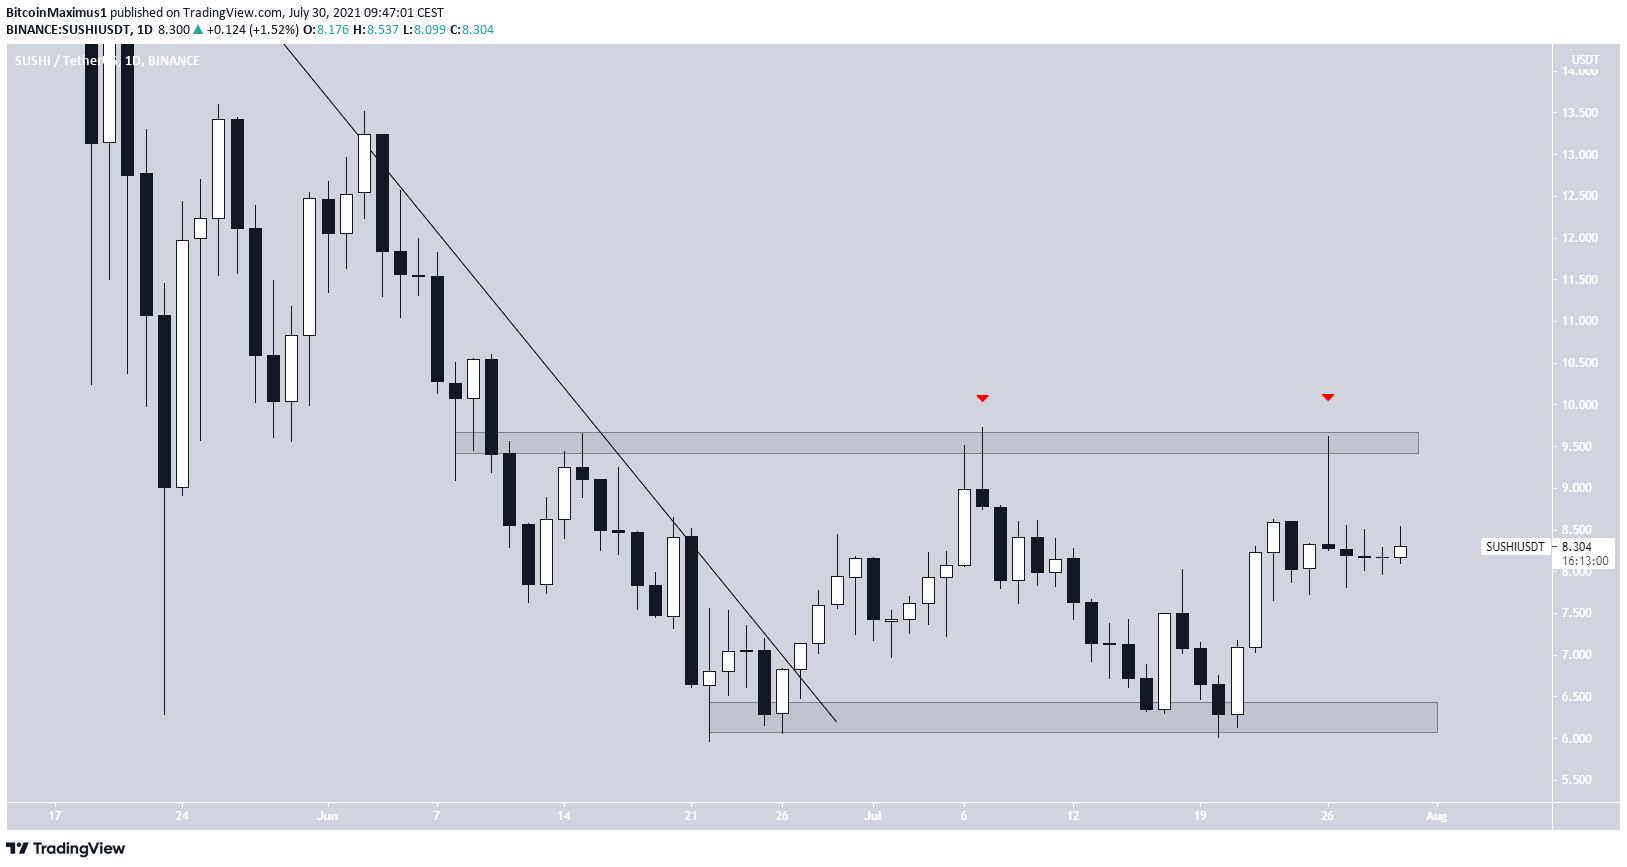
SUSHI
On June 27, SUSHI broke out from a descending resistance line. It proceeded to reach a high of $9.72 but created a long upper wick, validating the $9.60 area as resistance.
Following this, it bounced at the $6.25 support area only to make another failed attempt at moving above $9.60 and created another long upper wick (red icon).
SUSHI is now trading close to the middle of the $6.25-$9.60 trading range.
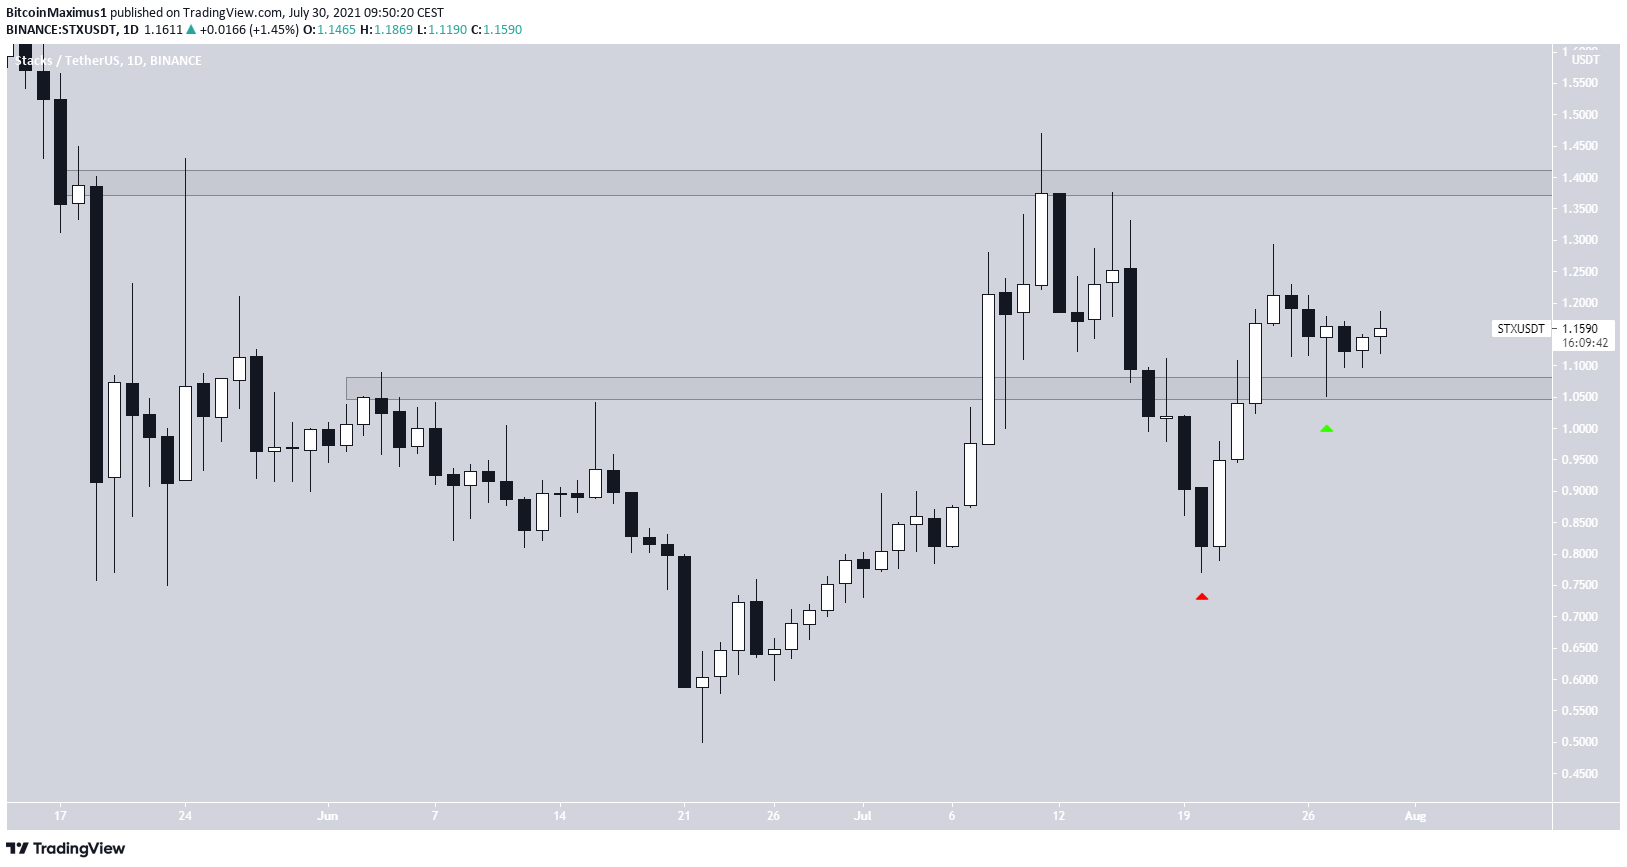
STX
STX began an upward move on June 22 and reached a high of $1.47 on July 11. After this, it was rejected by the $1.40 horizontal resistance area and began to move to the downside.
STX created a higher low on July 20 and initiated another upward move, reclaiming the $1.07 support area in the process.
It’s now trading in a range between $1.07 and $1.40.
For BeInCrypto’s latest bitcoin (BTC) analysis, click here.


