


Green Satoshi Token (GST) is trading inside a short-term bullish pattern, a breakout from which could also lead to a breakout from a longer-term descending resistance line.
GST is the in-game token of STEPN, the first move-to-earn NFT game in which players earn tokens by walking or running. The token was launched in Dec. 2021 and proceeded to reach an all-time high of $7.82 on April 29, 2022. But, it has been falling since and reached an all-time low price of $0.70 on June 1.
Measuring from the all-time high, the price has decreased by 88.50%.
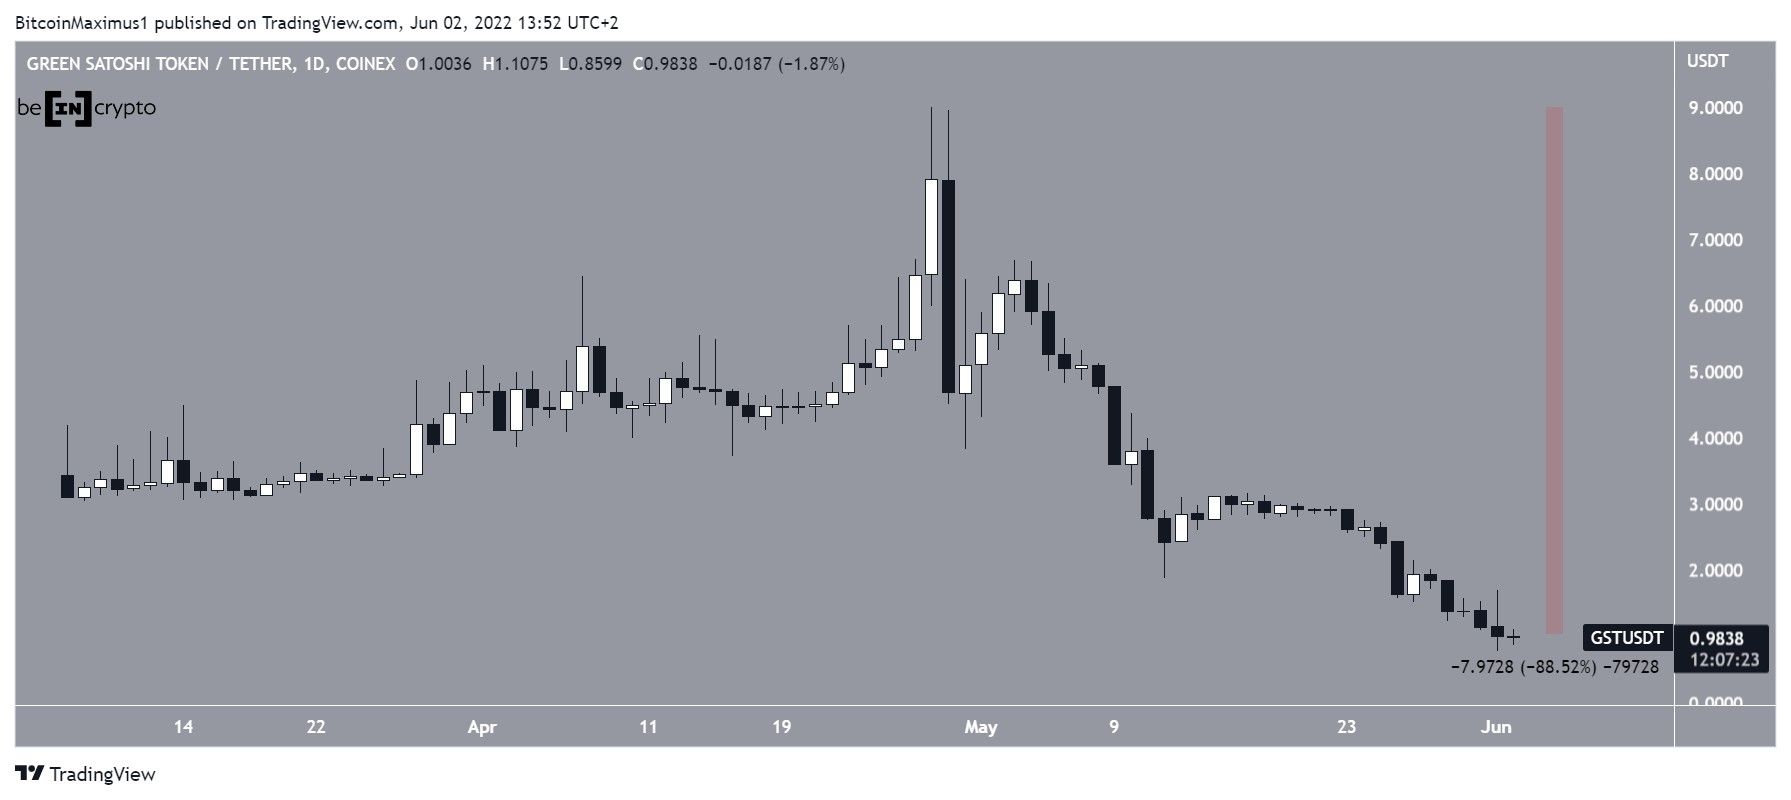
Ongoing GST decrease
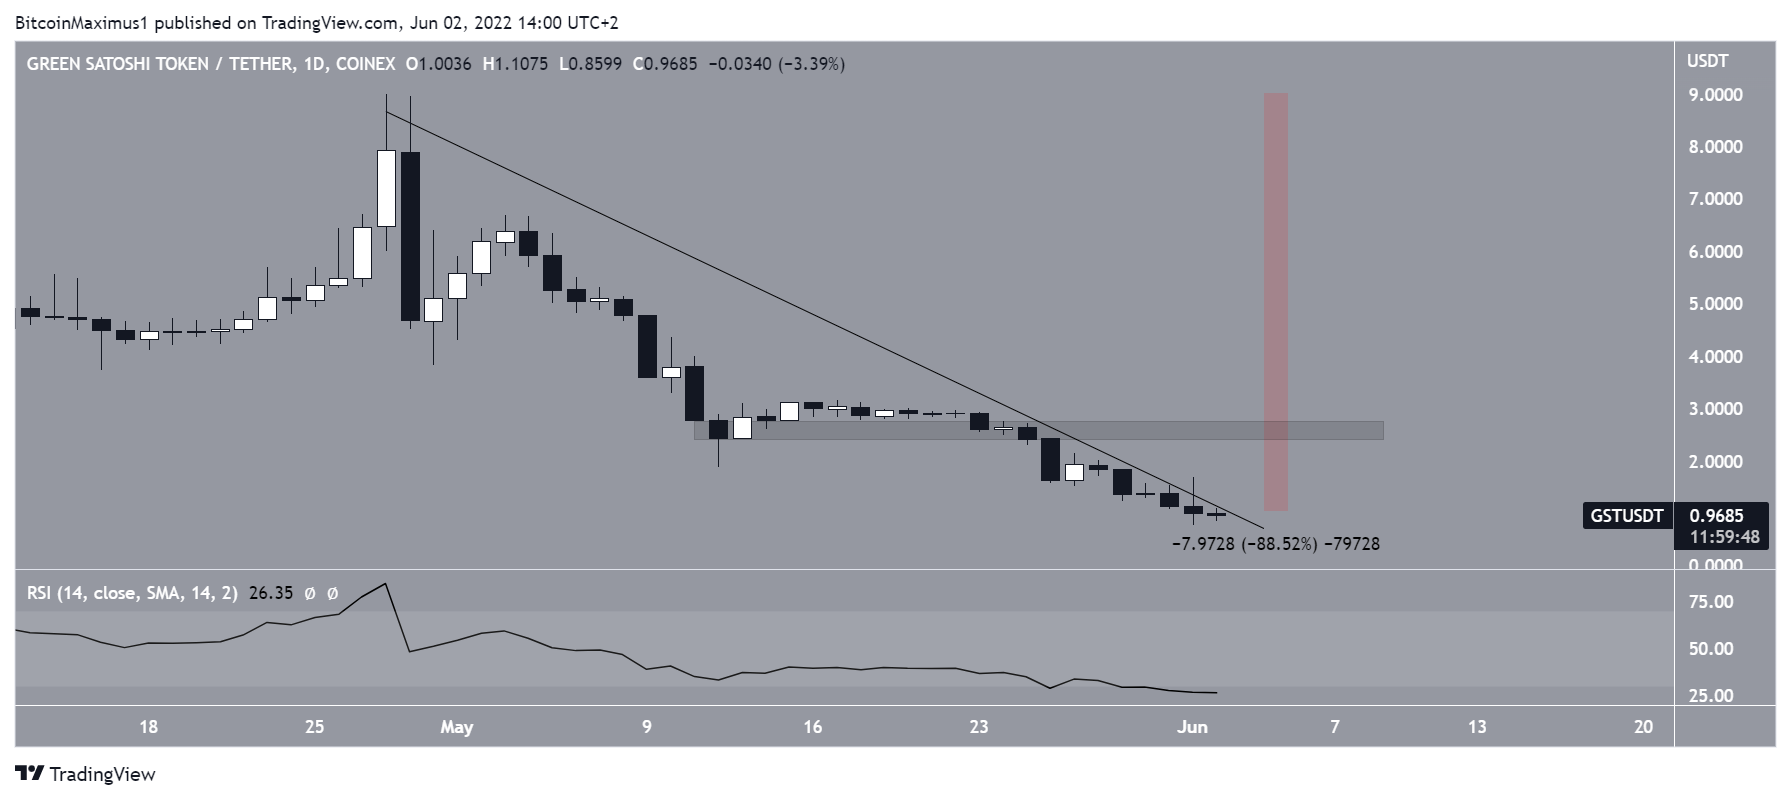
A closer look at the daily time frame shows that the price has been falling underneath a descending resistance line since the aforementioned all-time high. It has made numerous successive attempts at breaking out over the past ten days.
If it is successful in doing so, the closest resistance area would be at $2.60.
While the daily RSI is oversold, it has not yet generated any bullish divergence. This would be a sign that a breakout is forthcoming.
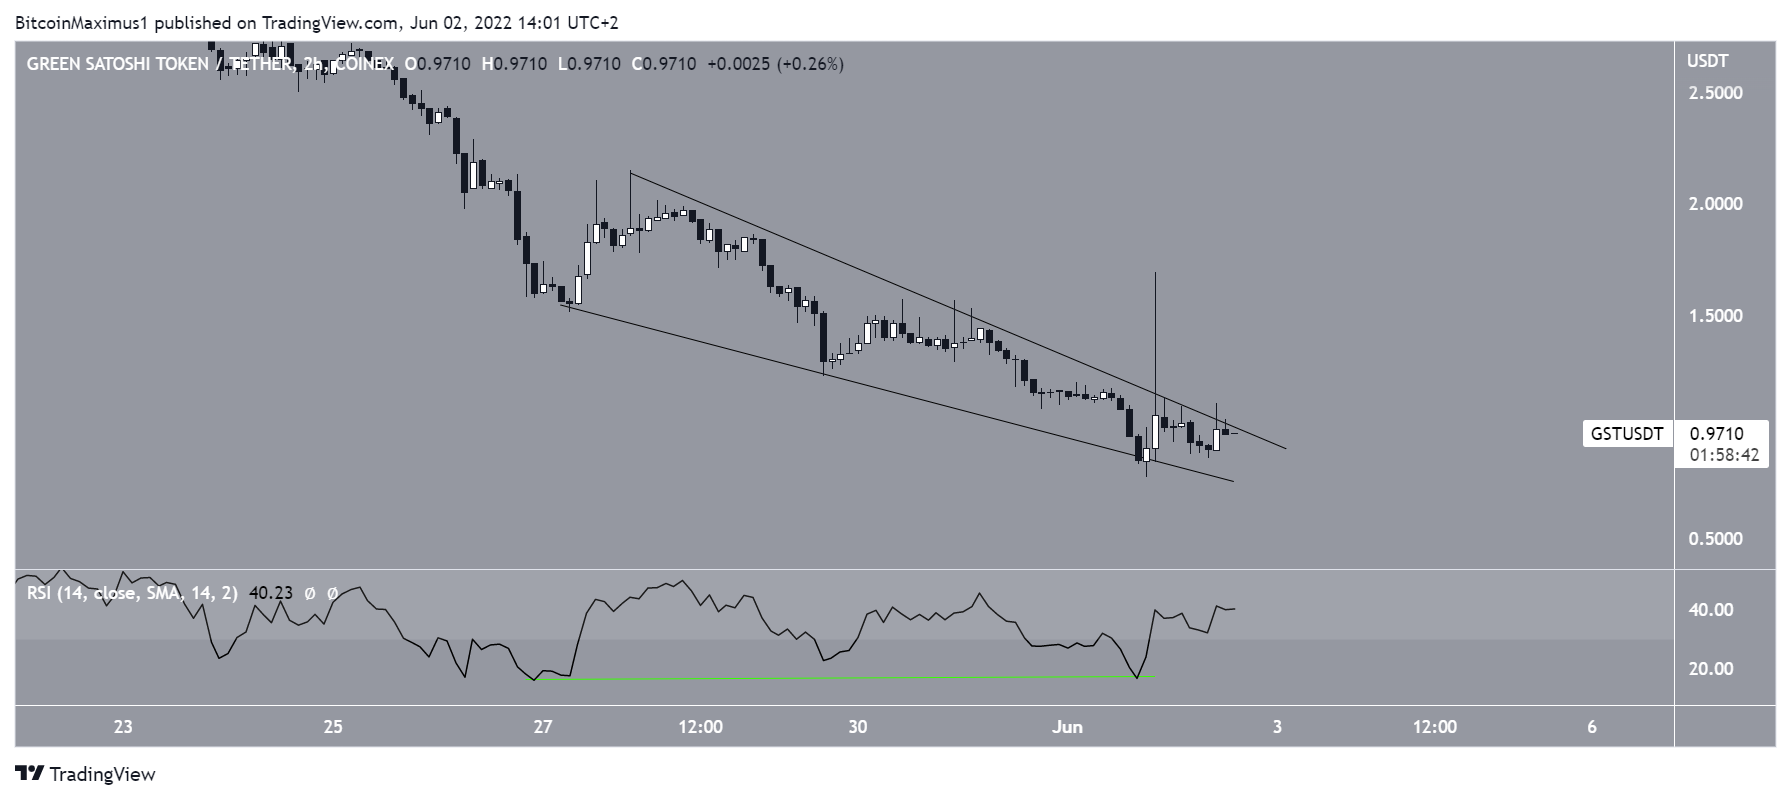
Finally, the two-hour chart shows that GST has been trading inside a descending wedge since May 27. The descending wedge is considered a bullish pattern, meaning that an eventual breakout from it would be expected.
So, this suggests that the price will also break out from the resistance line in the daily time frame, potentially setting up a movement toward the $2.60 resistance area.
GMT price movement
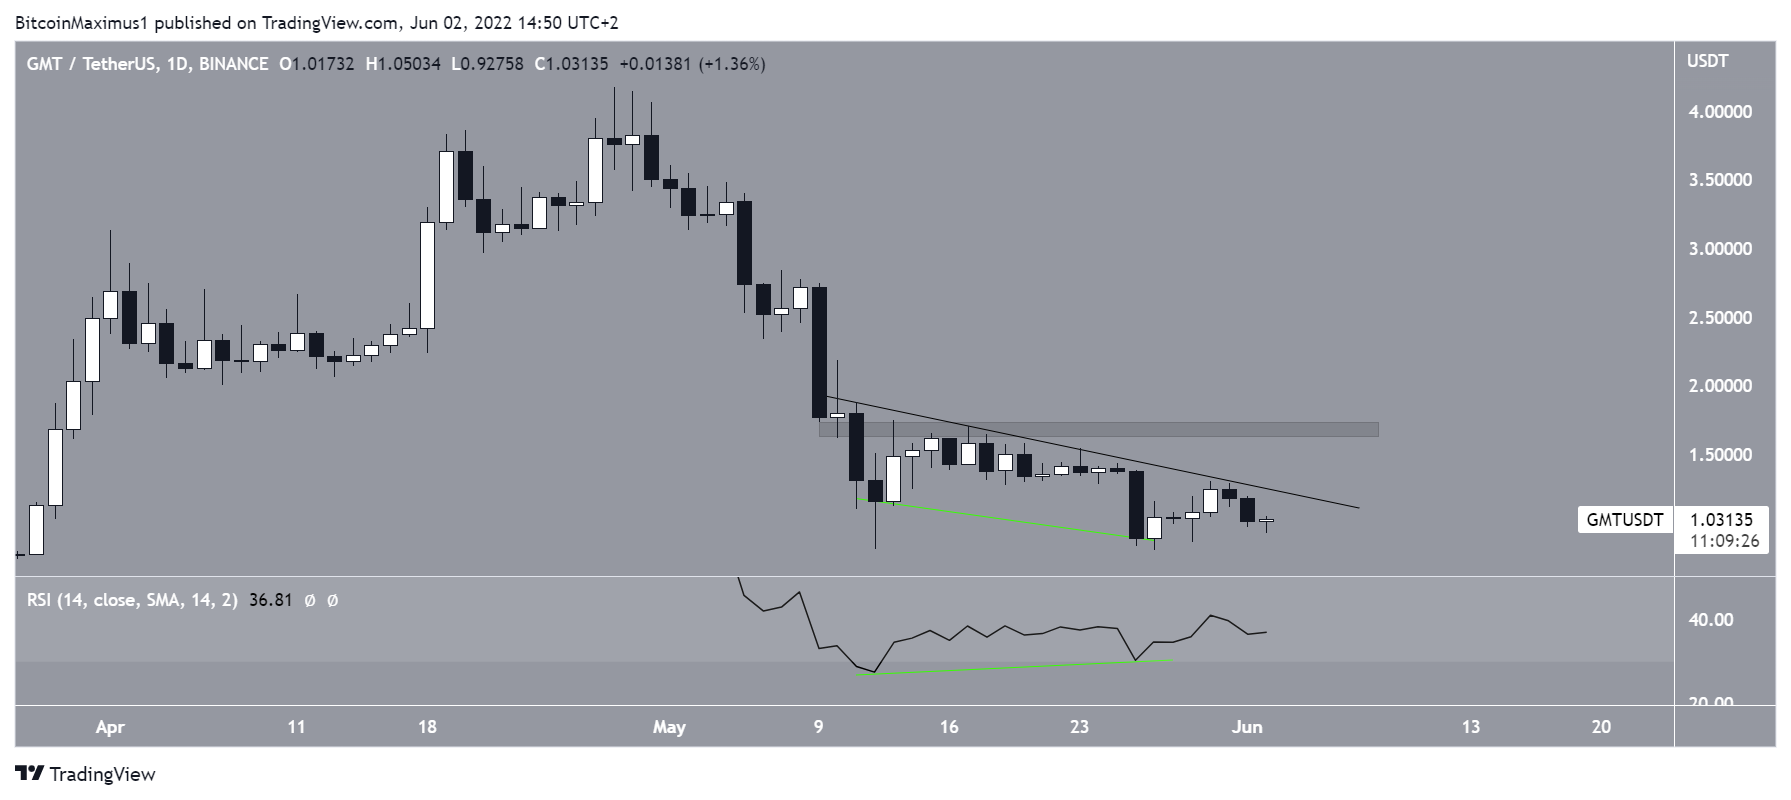
Since GST is the in-game token of GMT, it is worth taking look at the movement of the latter in order to determine if it might have an effect on GST.
GMT seems to have created a double bottom, which is considered a bullish reversal pattern. The pattern has also been combined with a bullish divergence in the RSI.
Currently, GMT is following a descending resistance line. If the pattern leads to a bullish trend reversal, it would cause a breakout from the line and take the price towards the $1.80 resistance area.
For Be[in]Crypto’s latest bitcoin (BTC) analysis, click here



