
Gala’s (GALA) price has trended within a horizontal channel since April 12, signaling a relative balance between buying and selling pressures.
As the token’s Market Value to Realised Value (MVRV) ratio flashes a buy signal, the token’s price might break above the upper line of the channel to extend current gains.
Gala Enjoys Bullish Bias
Gala’s (GALA) price has trended within a horizontal channel for the past two months, suggesting price consolidation within a range.
This channel is formed when a balance between an asset’s buying and selling pressures prevents the price from trending strongly in either direction.
The upper line of this channel forms resistance, while the lower line forms support. GALA continues to face resistance at $0.053, while it has formed support at $0.038.
At press time, GALA exchanged hands at $0.046, trending toward the upper line of this channel. The token may breach this resistance level if market participants adhere to the buying signals flashed by its MVRV ratio.
At the time of writing, GALA’s MVRV ratio, assessed using the 30-day and 365-day moving averages, was -21.69% and -71.57%, respectively.
Read More: How to Buy Gala (GALA) and Everything You Need to Know
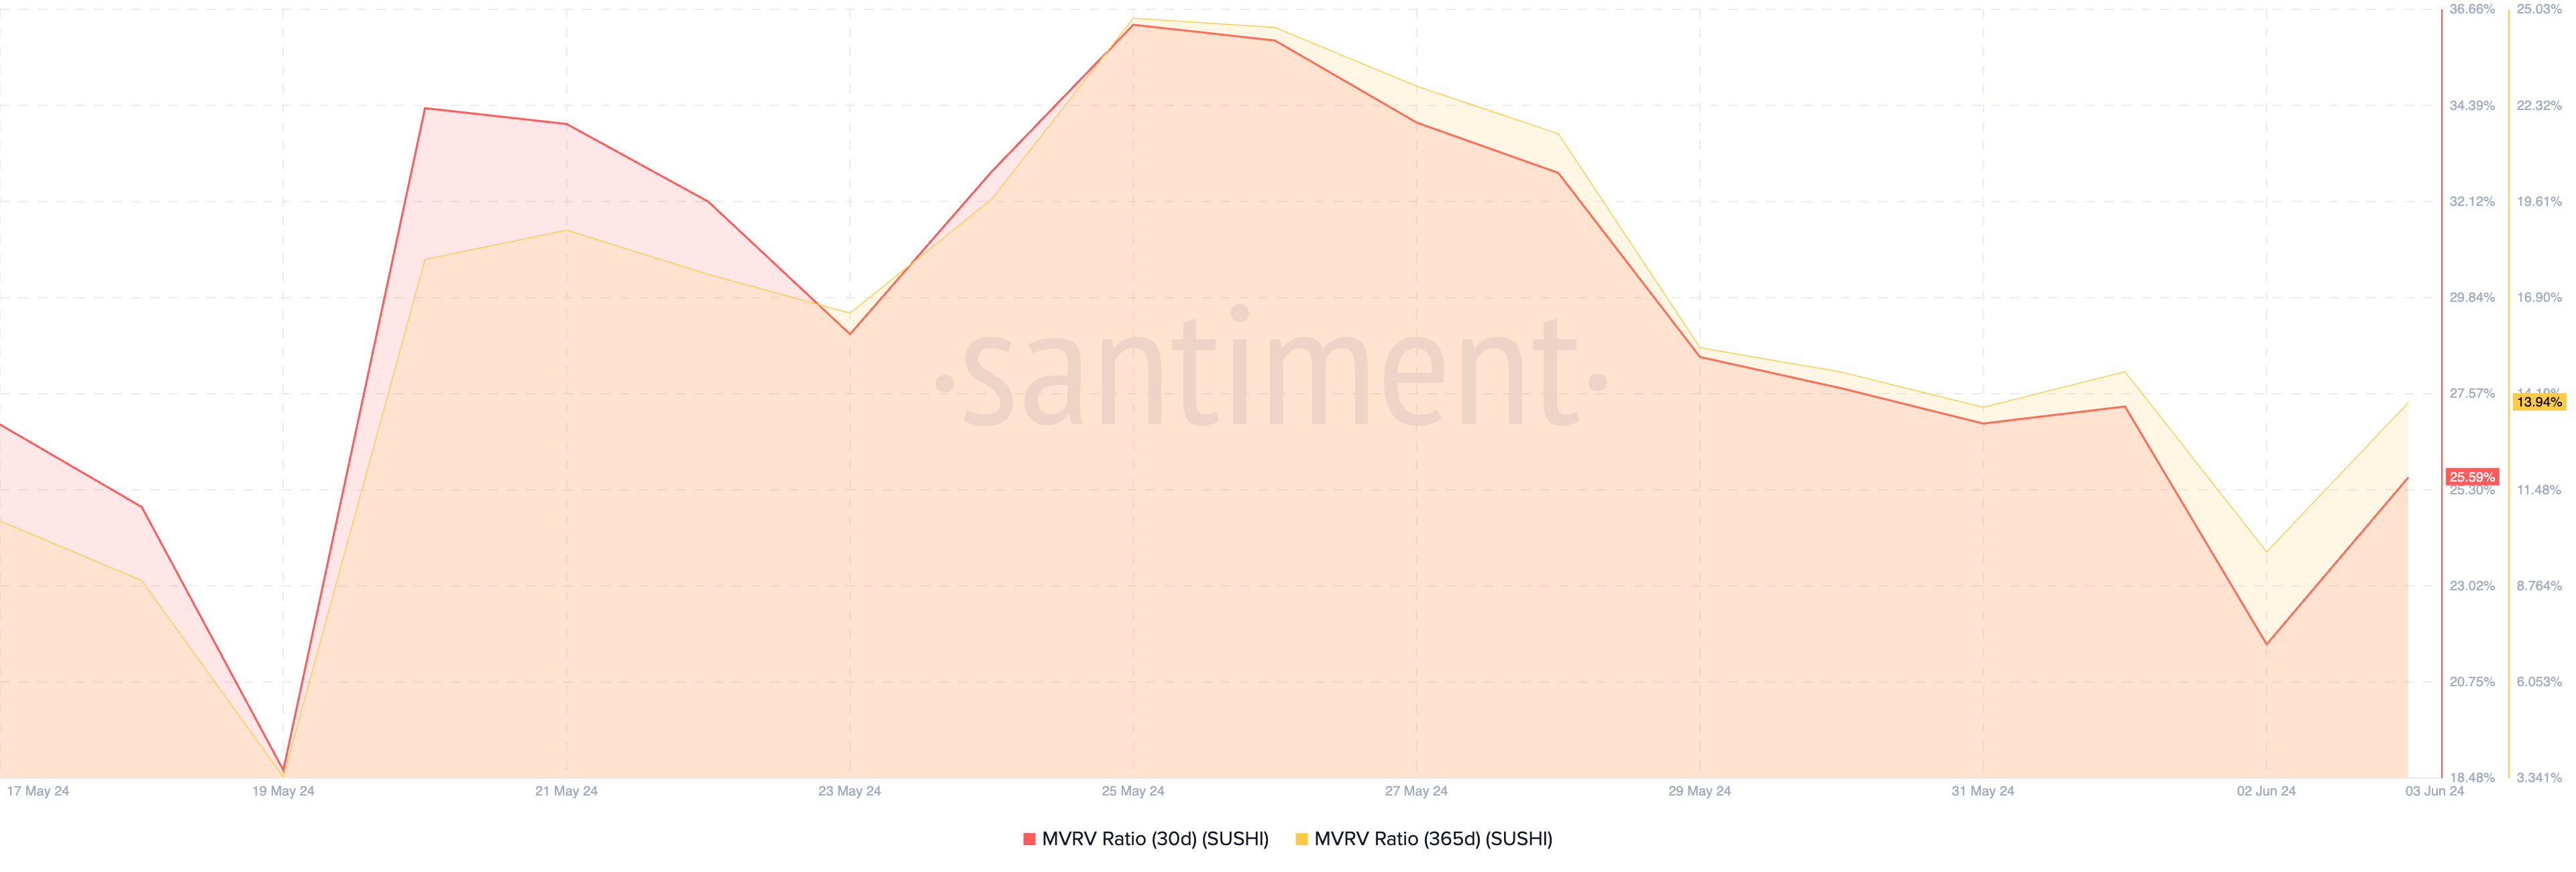
This metric tracks GALA’s current market price and the average price at which its tokens were acquired. When GALA’s MVRV ratio is positive and above one, analysts consider it overvalued. This means that the asset’s current market value is significantly higher than the price at which most investors acquired their holdings.
On the other hand, a negative MVRV ratio means the token is undervalued, as its market price is below the average purchase price of all its tokens in circulation.
A negative MVRV ratio presents a good buying opportunity because it means that the asset in question trades at a value lower than its historical cost basis.
Further, despite GALA’s oscillation within a tight range, its futures market participants have maintained a bullish outlook. This was gleaned from the token’s positive funding rate.
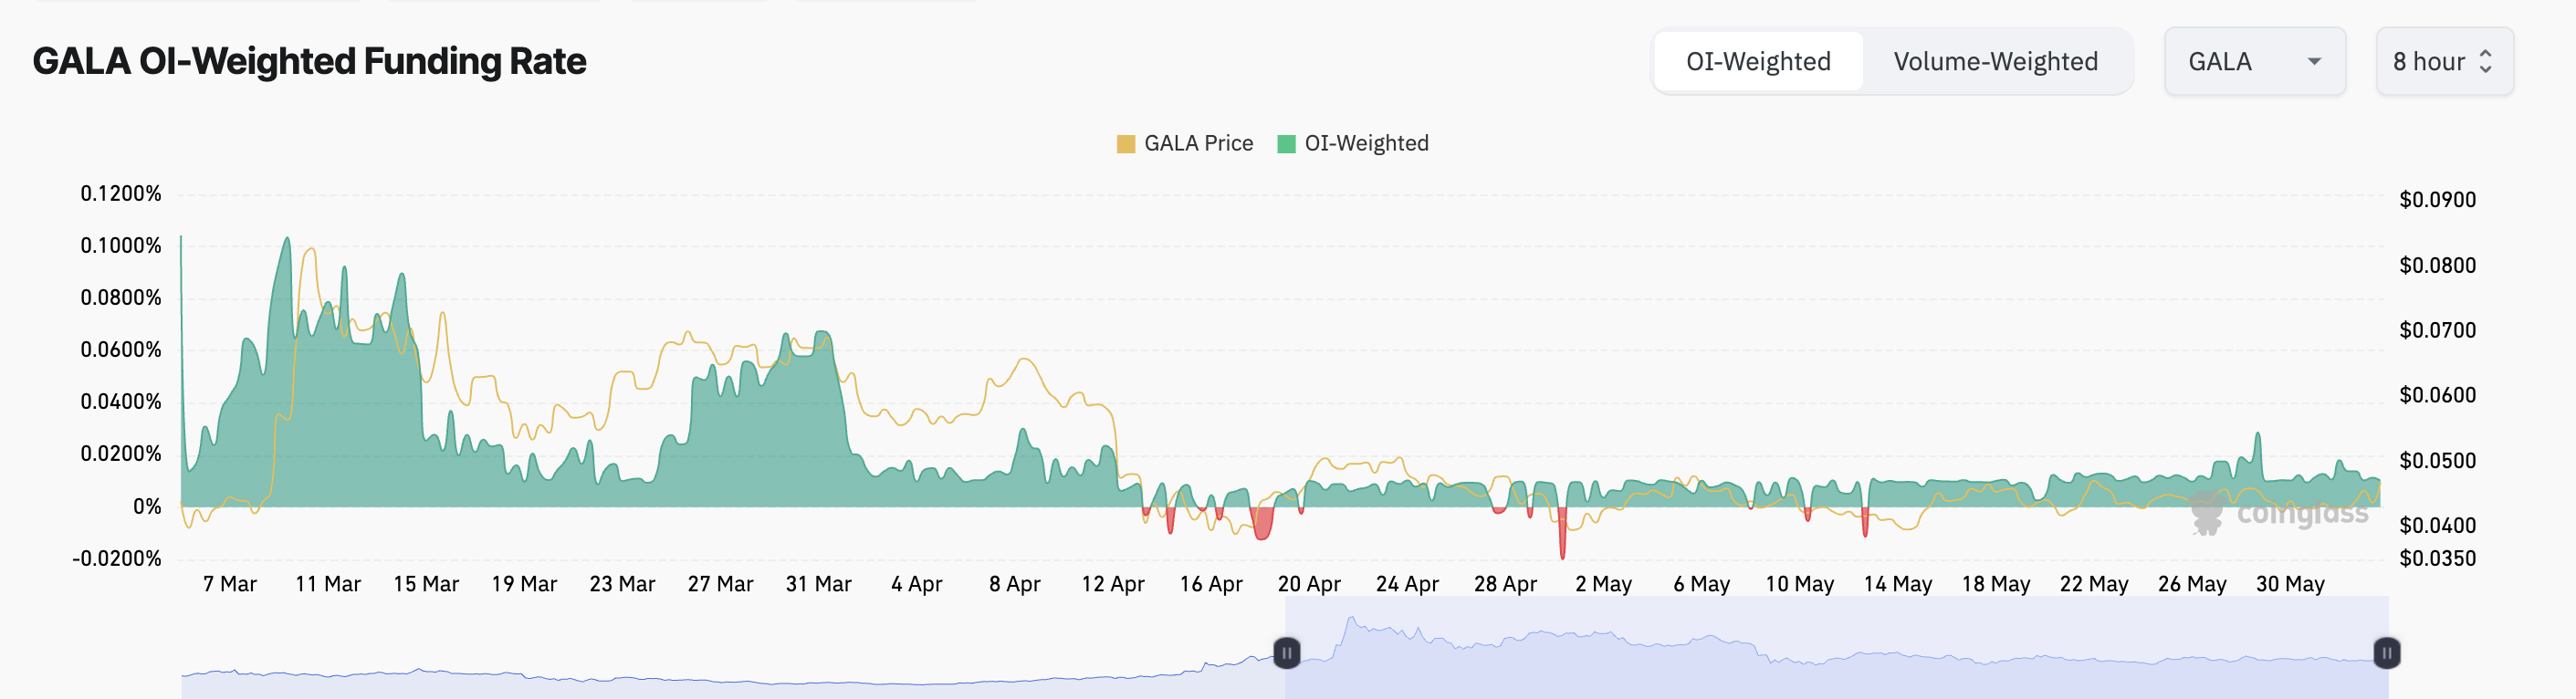
Funding rates are used in perpetual futures contracts to ensure the contract price stays close to the spot price.
When positive, it is a bullish signal, suggesting a strong demand for long positions. As of this writing, GALA’s funding rate was $0.011%.
GALA Price Prediction: The Bulls Have the Upper Hand
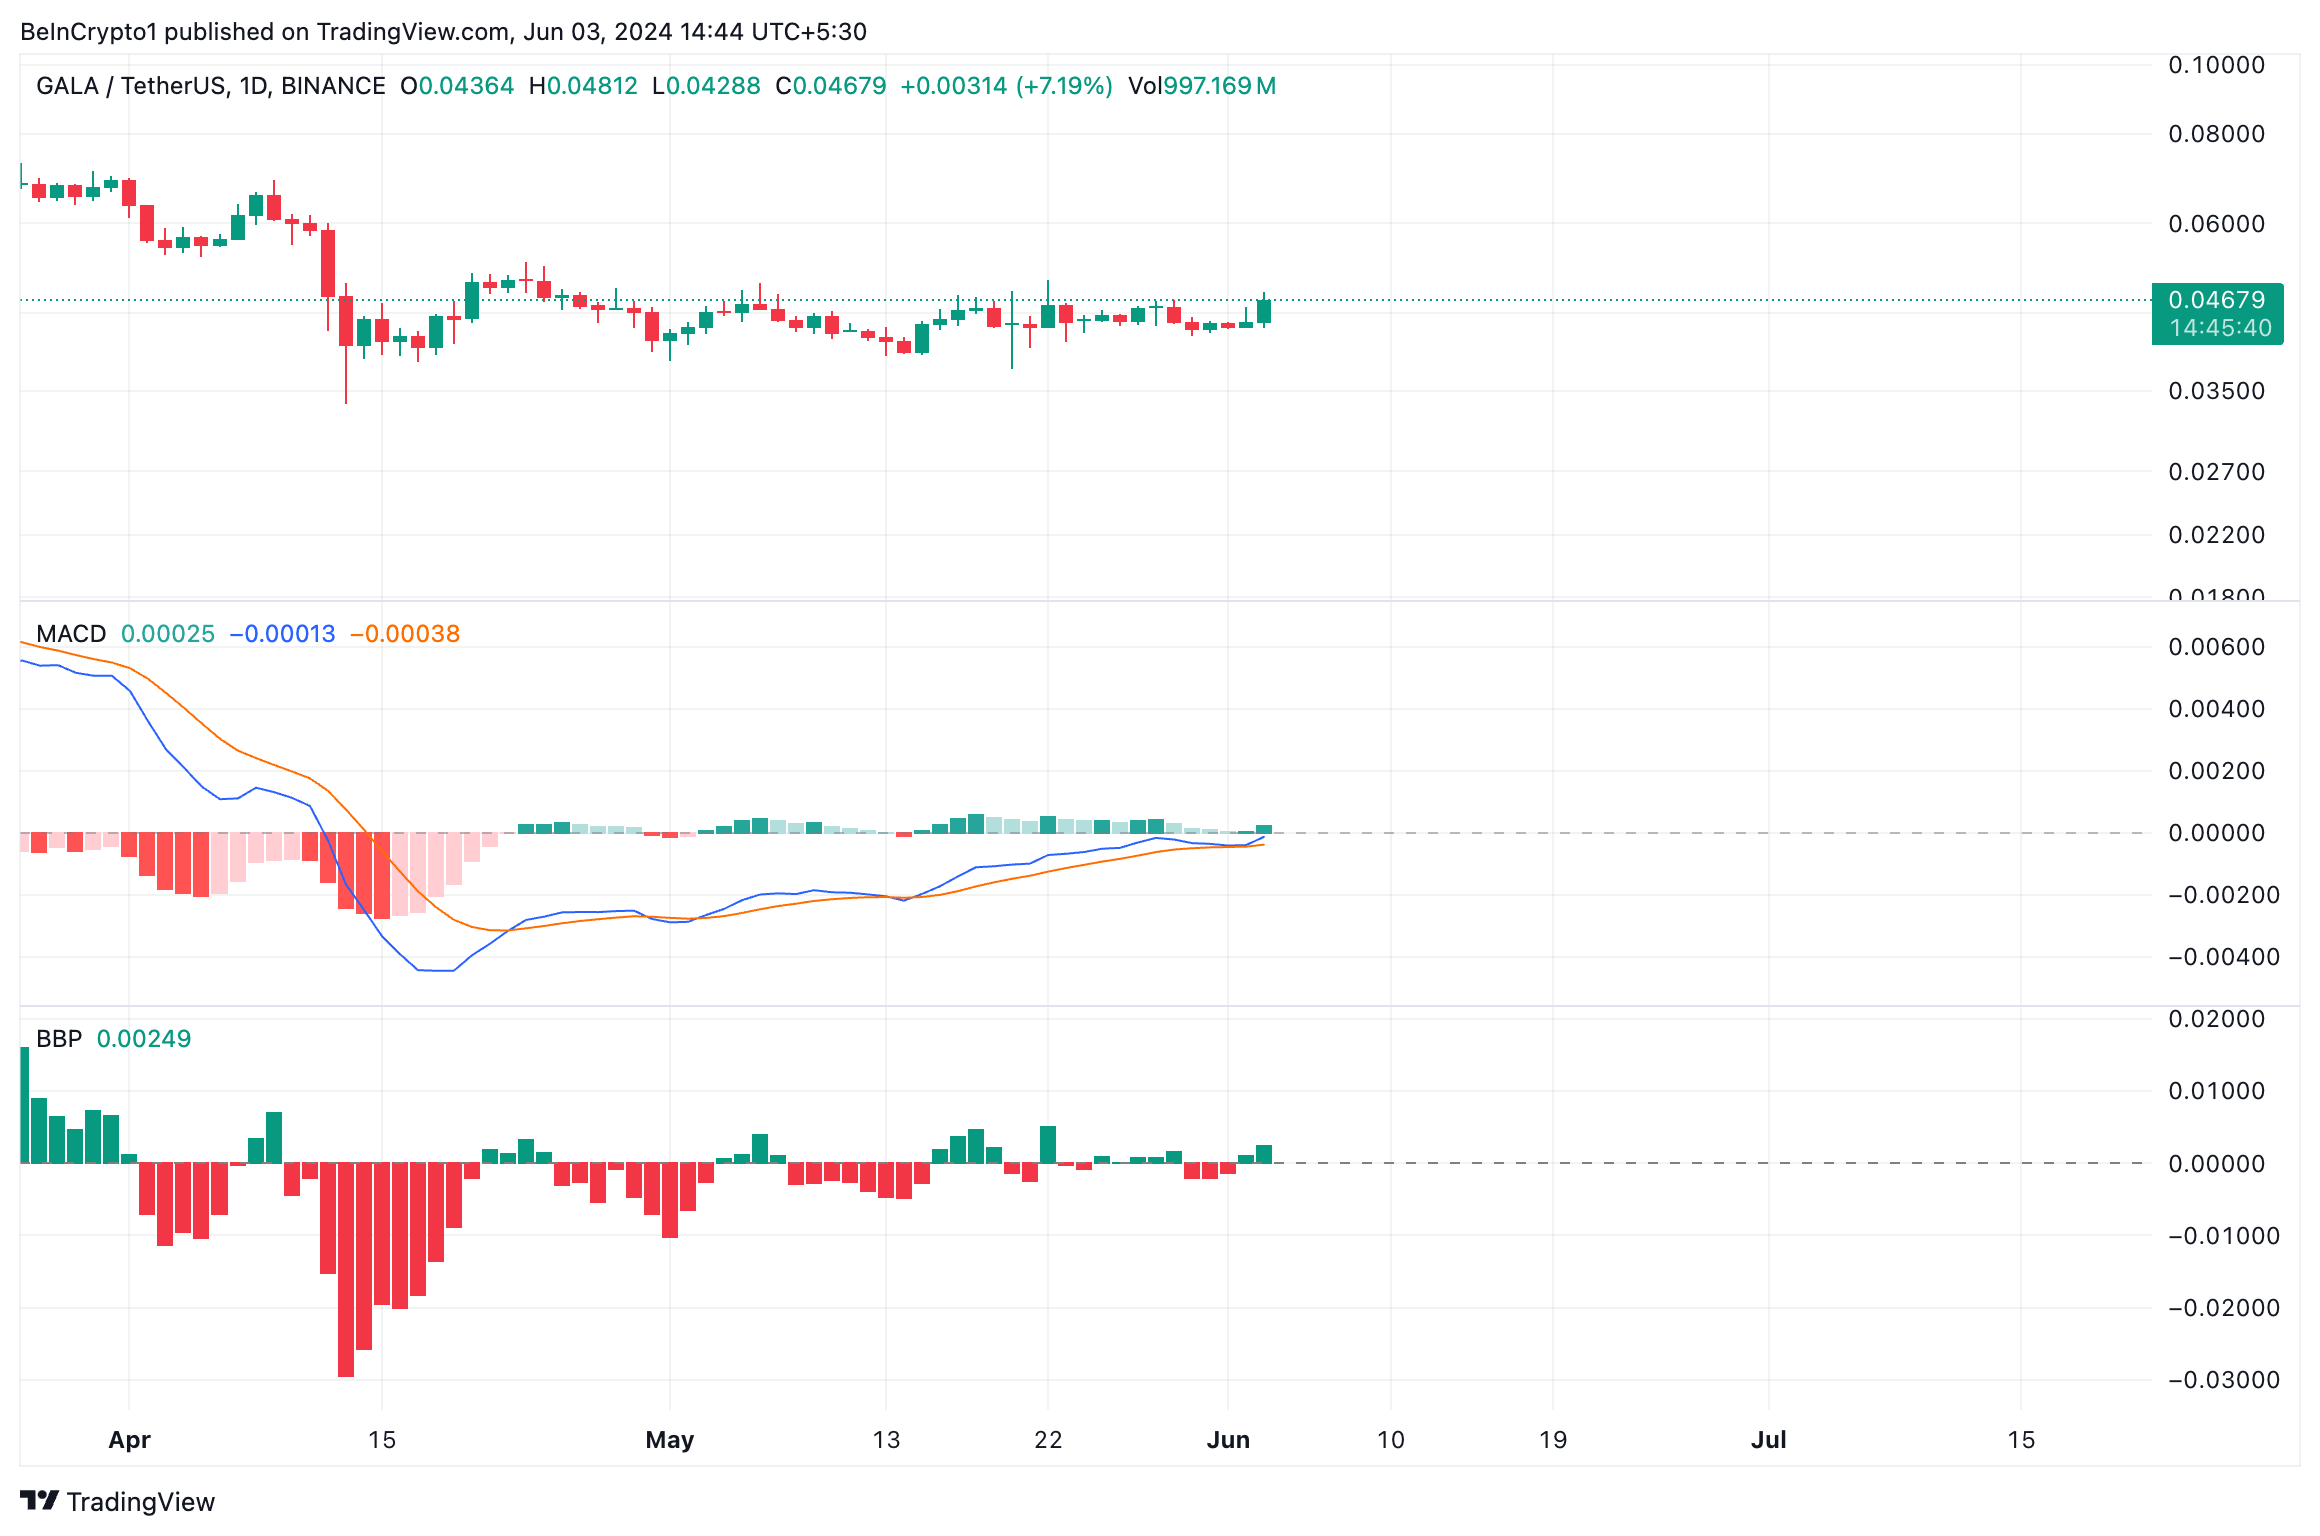
Confirming the growth in bullish bias toward GALA, readings from its Moving Average Convergence Divergence (MACD) indicator showed its MACD line (blue) poised to cross above its signal (orange) and zero lines.
When an asset’s MACD line aims to cross above the signal line, it suggests an increase in the price’s upward momentum. Traders view this as an indication that the asset’s price might increase.
The positive values GALA’s Elder-Ray Index returned lent credence to the position above. At press time, the indicator’s value was 0.0025.
This indicator measures the relationship between the strength of ETH’s buyers and sellers in the market. When its value is positive, bull power dominates the market.
If the bulls continue to dominate the GALA market, its price may rally toward $0.049.
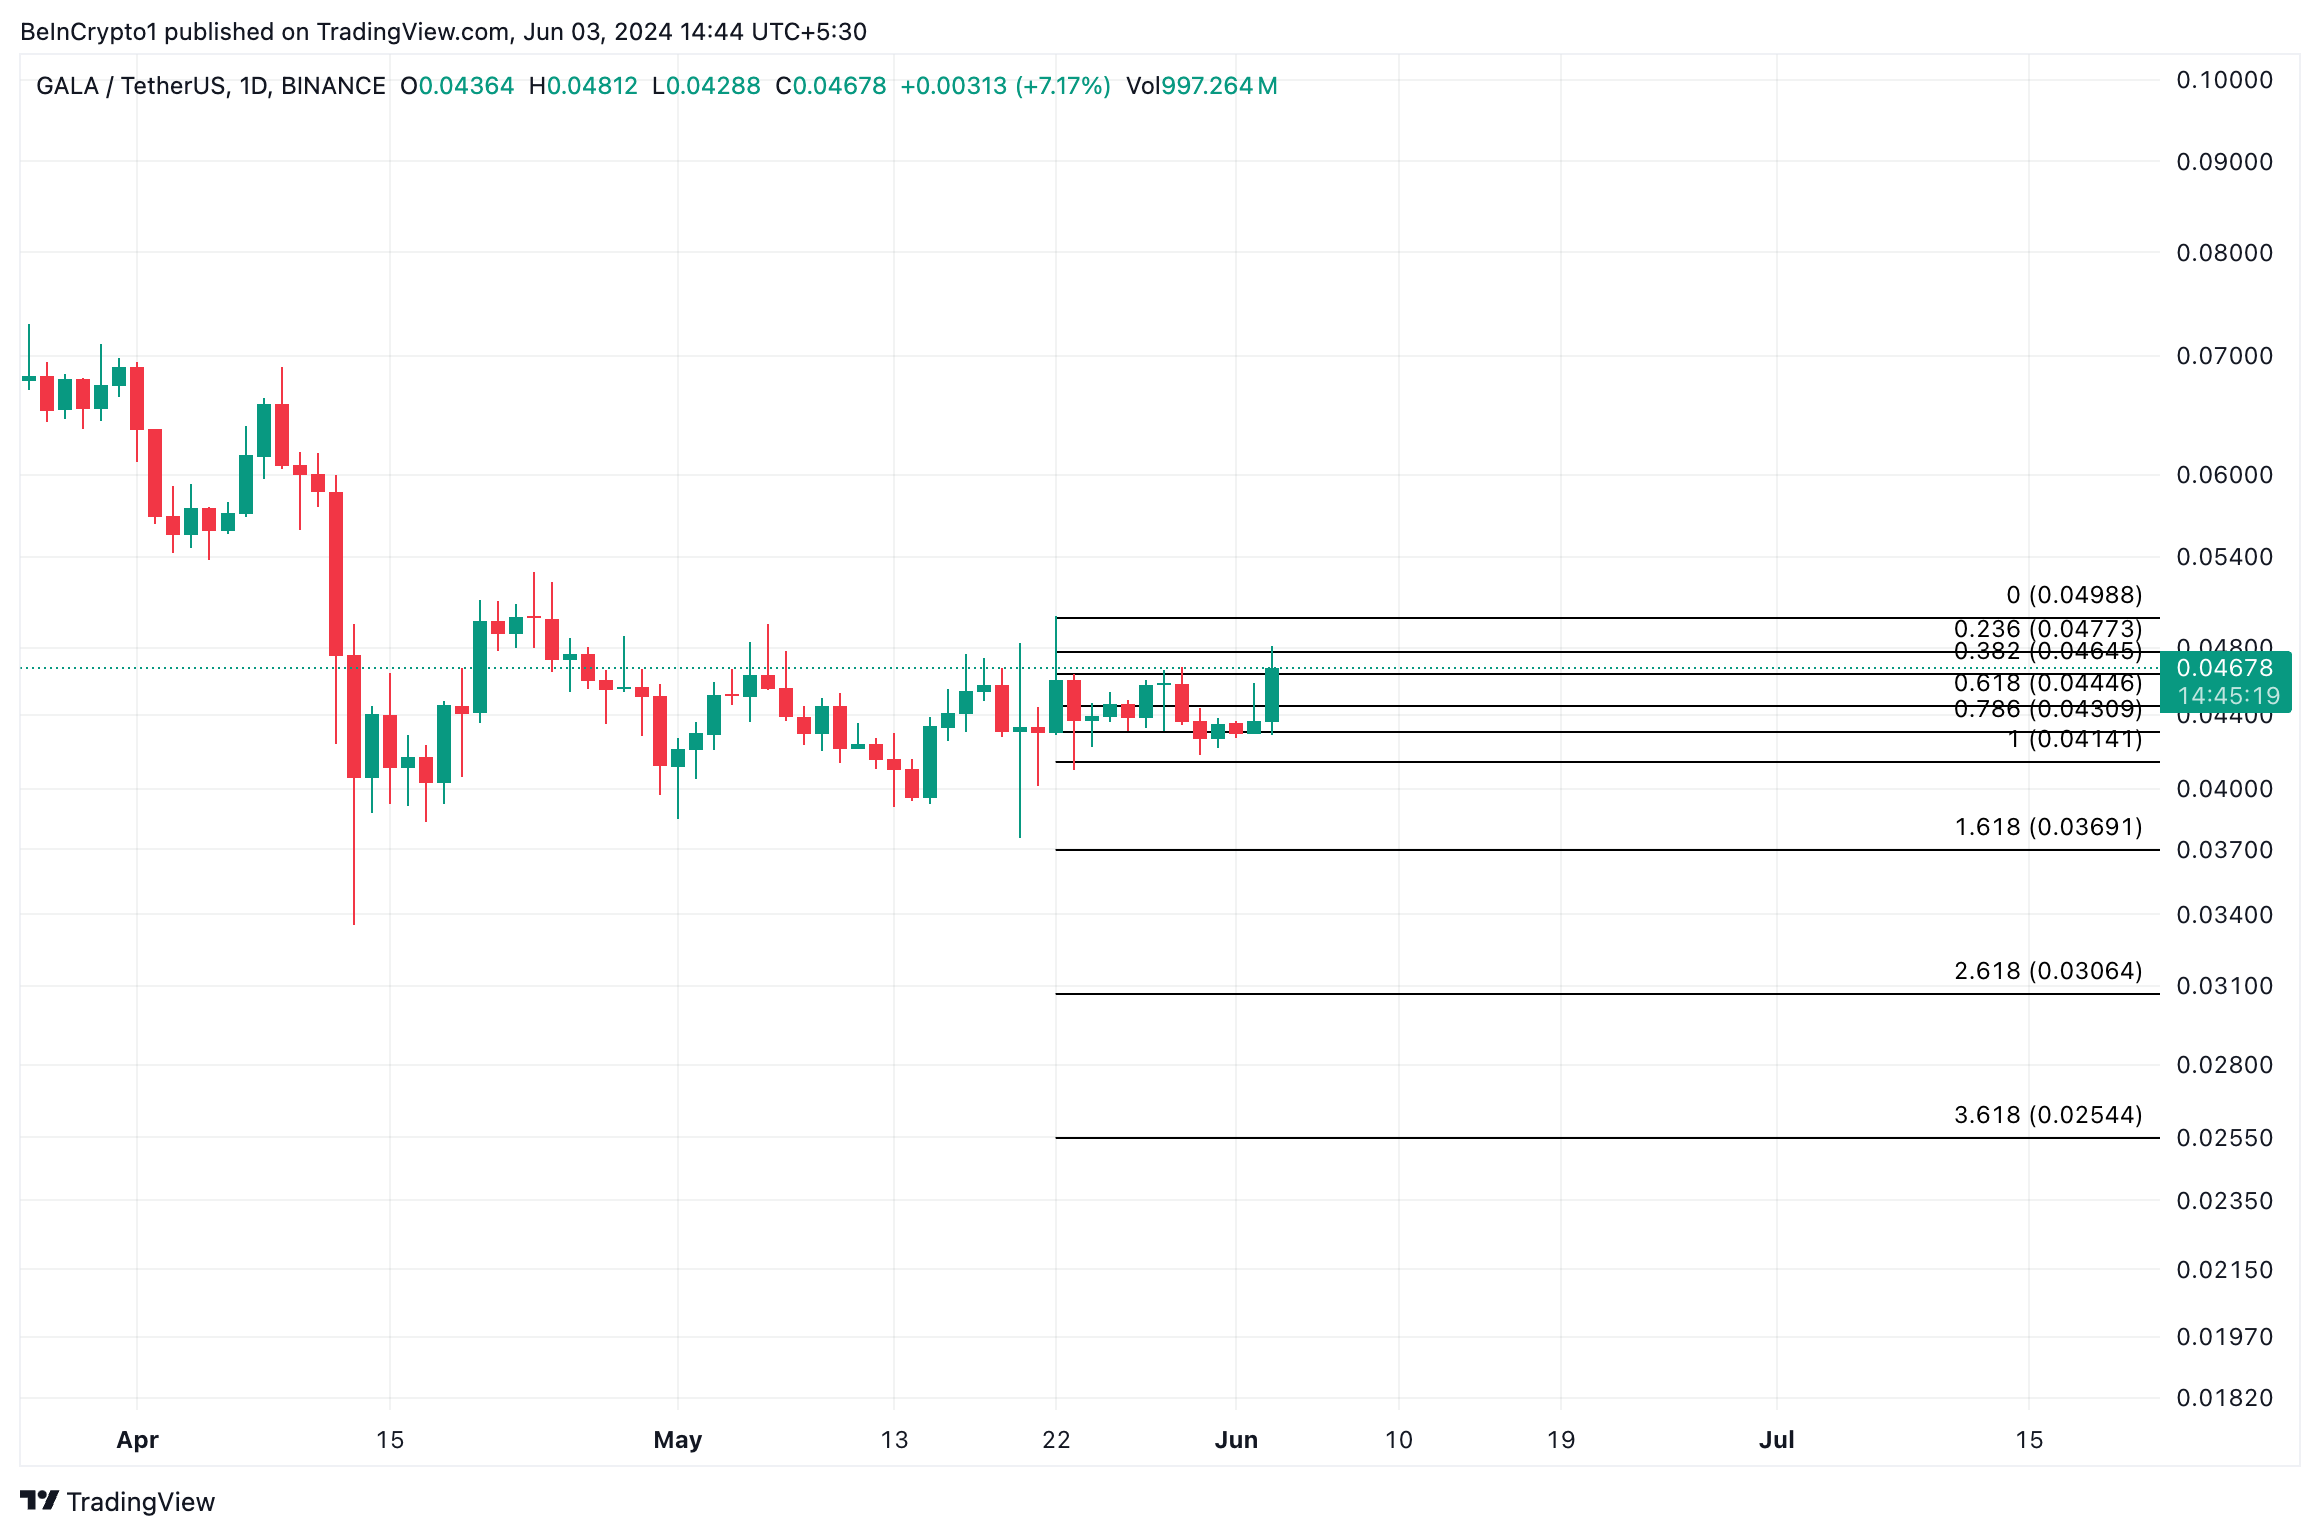
However, any surge in selling pressure might cause its price to plummet to support at $0.038.
