
Moving averages (MA) are often very significant in determining future price movements. The price of an asset, like Bitcoin, often reacts to its MAs — either using them for support or resistance.
The higher the number of times an asset reacts to an MA, the higher its significance — thus, the more likely it is for the price to react to it again.
A movement above/below a significant MA can rapidly accelerate the assets rate of increase/decrease.
For Bitcoin, one such important MA has been the 200-day one. The BTC price had traded above it since April 2019 before finally breaking down on September 24.
Cryptocurrency trader and analyst @filbfilb noted that the price is currently facing resistance by its 200-day MA.
https://twitter.com/filbfilb/status/1182265691589754880
Additionally, he offered two possibilities — the first bearish and the second bullish:
- A retrace to the level of the breakout at $8200.
- An increase towards the 0.618 Fibonacci level of the previous downward move.
Let’s look at them closely and see which is more likely while determining where the 0.618 level is.
Bitcoin Price: Throwback or Retrace?
Looking at a short-term timeframe, we can see that the price was rejected twice by the 200-day MA — which coincides with the 0.382 fib level of the previous move.
Once it reached it, the Bitcoin price made a double top — which is considered a bearish reversal pattern.
At the time of writing, it had decreased slightly below $8500.
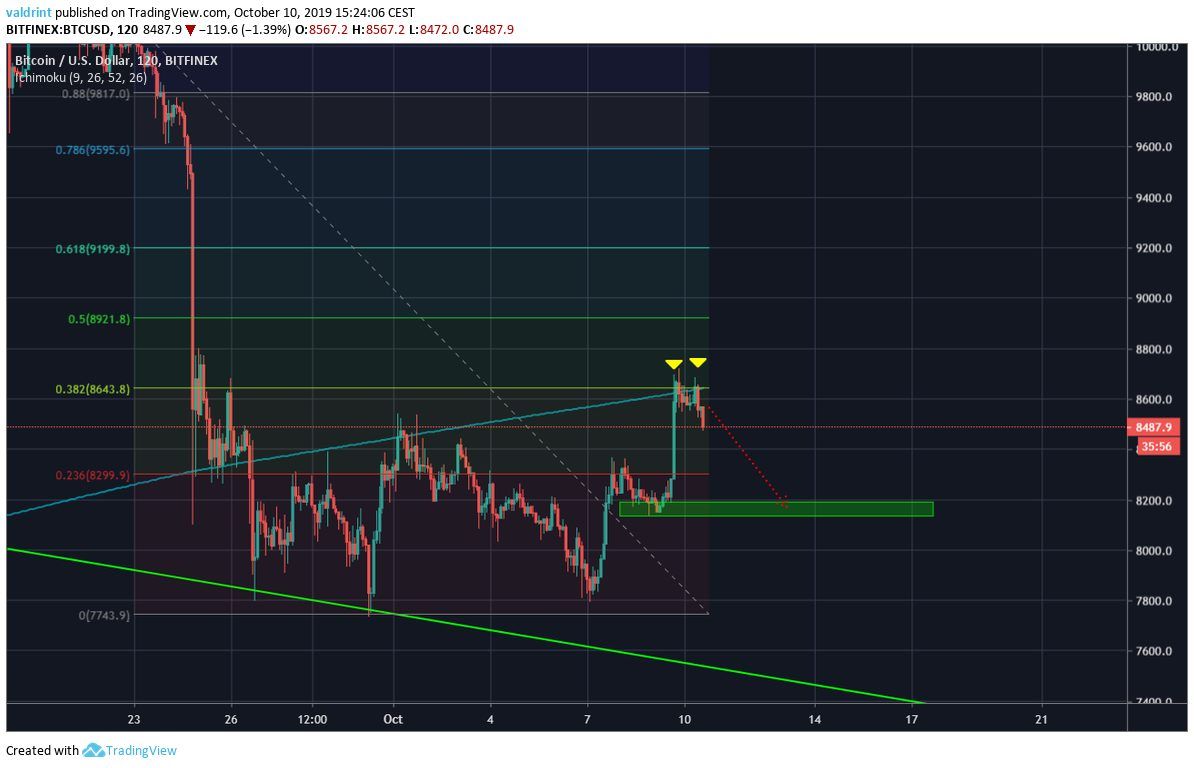
The first scenario laid out by filbfilb has us decreasing all the way to the breakout level near $8200. Since he stated that this should be the final part of a Wyckoff accumulation, what follows should be an upward move.
The second scenario has us directly going to the 0.618 fib level without decreasing to pre-breakout levels. However, since the price has already begun to decrease and has made a short-term bearish pattern, we are assuming that it will continue to decrease until it reaches the support area.
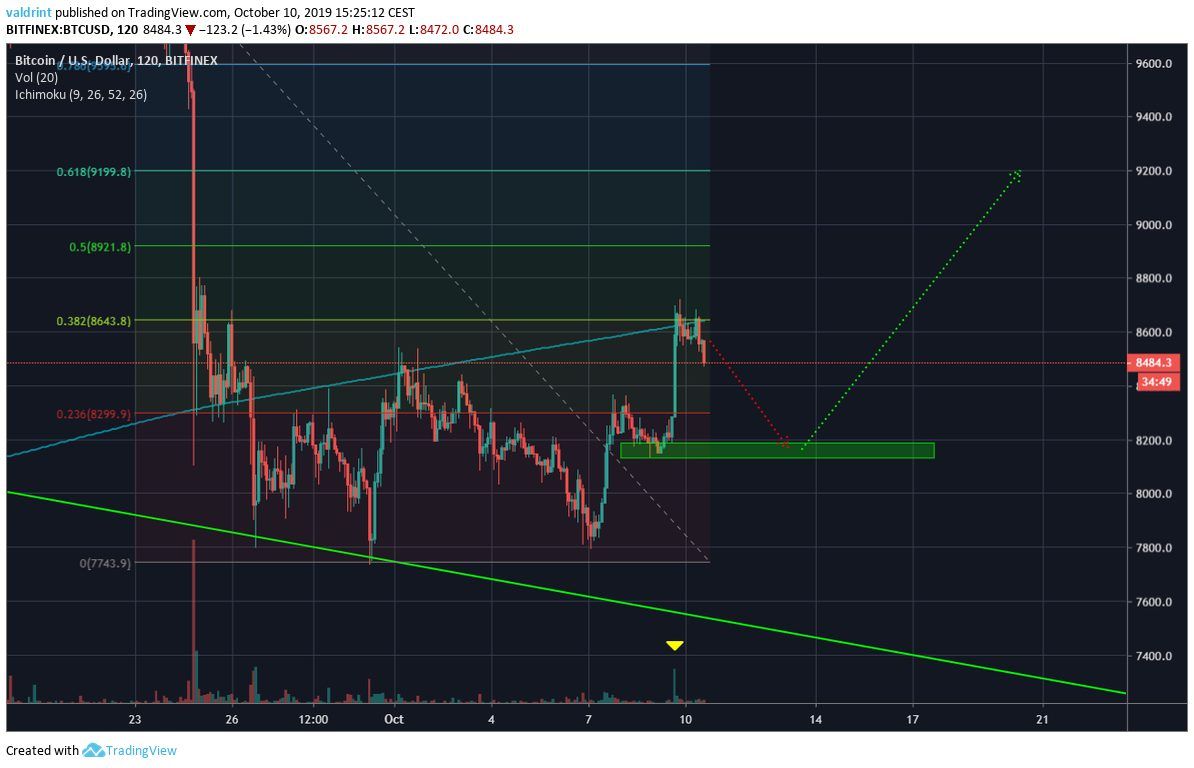
Therefore, after dropping to $8200, the price should pick up steam and move towards the 0.618 level — which is found at $9200.
In order for this to occur, however, the BTC price movement needs to have increased volume.
The breakout volume paled in comparison to that of the September 24 volume.
Additionally, in order to move above the 200-day MA — which has been extremely significant — we would likewise need much higher levels of volume.
Summary
The Bitcoin price has made a double top and has been rejected by the 200-day MA.
It is currently retracing towards the support area at $8200.
Afterward, it looks as if it will make an attempt to initiate an upward move towards $9200.
However, in order for this move to materialize and for the price to move above its 200-day MA, a decisive move with significant volume will most likely be required.
Do you think Bitcoin will reach $9200? If not, where will the next move take it? Let us know your thoughts in the comments below.
Disclaimer: This article is not trading advice and should not be construed as such. Always consult a trained financial professional before investing in cryptocurrencies, as the market is particularly volatile.
Images are courtesy of Shutterstock, TradingView, Twitter.
