


The Fetch.ai (FET) price has reached a long-term resistance level. But before it breaks out, an initial retracement could occur.
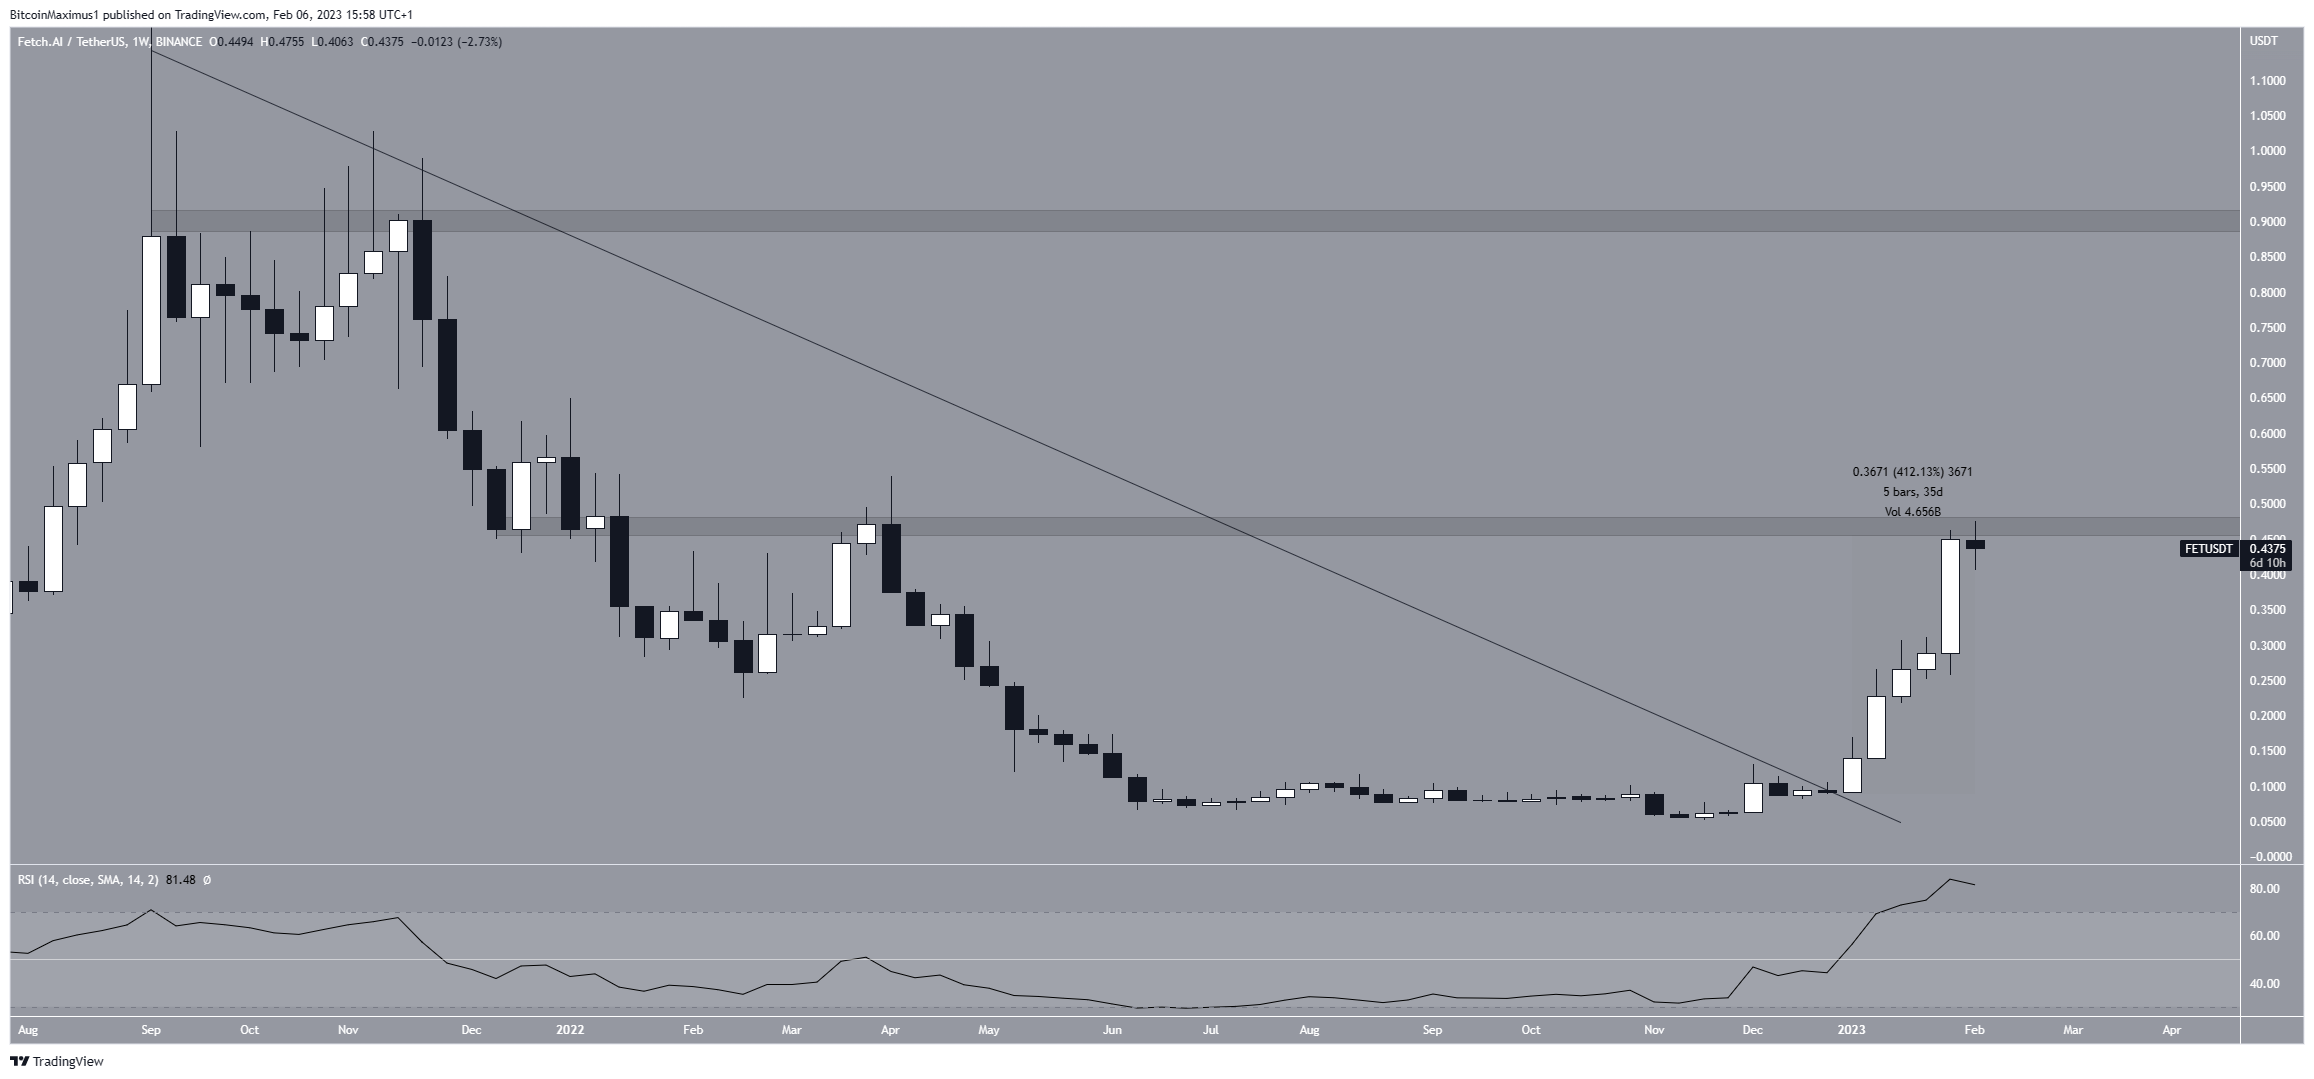
The FET price has increased at an accelerated rate since breaking out from a long-term descending resistance line at the beginning of the year. So far, it moved upward by 410%.
Currently, the price is trading inside the $0.47 resistance area. This is a crucial resistance since it is the final one before the $0.90 highs. So, a breakout above it could lead to a 100% price increase.
While the weekly RSI is overbought, it has not generated any bearish divergence yet. Therefore, it is possible that the upward movement will continue.
Fetch.ai Price Faces Possibility of Correction
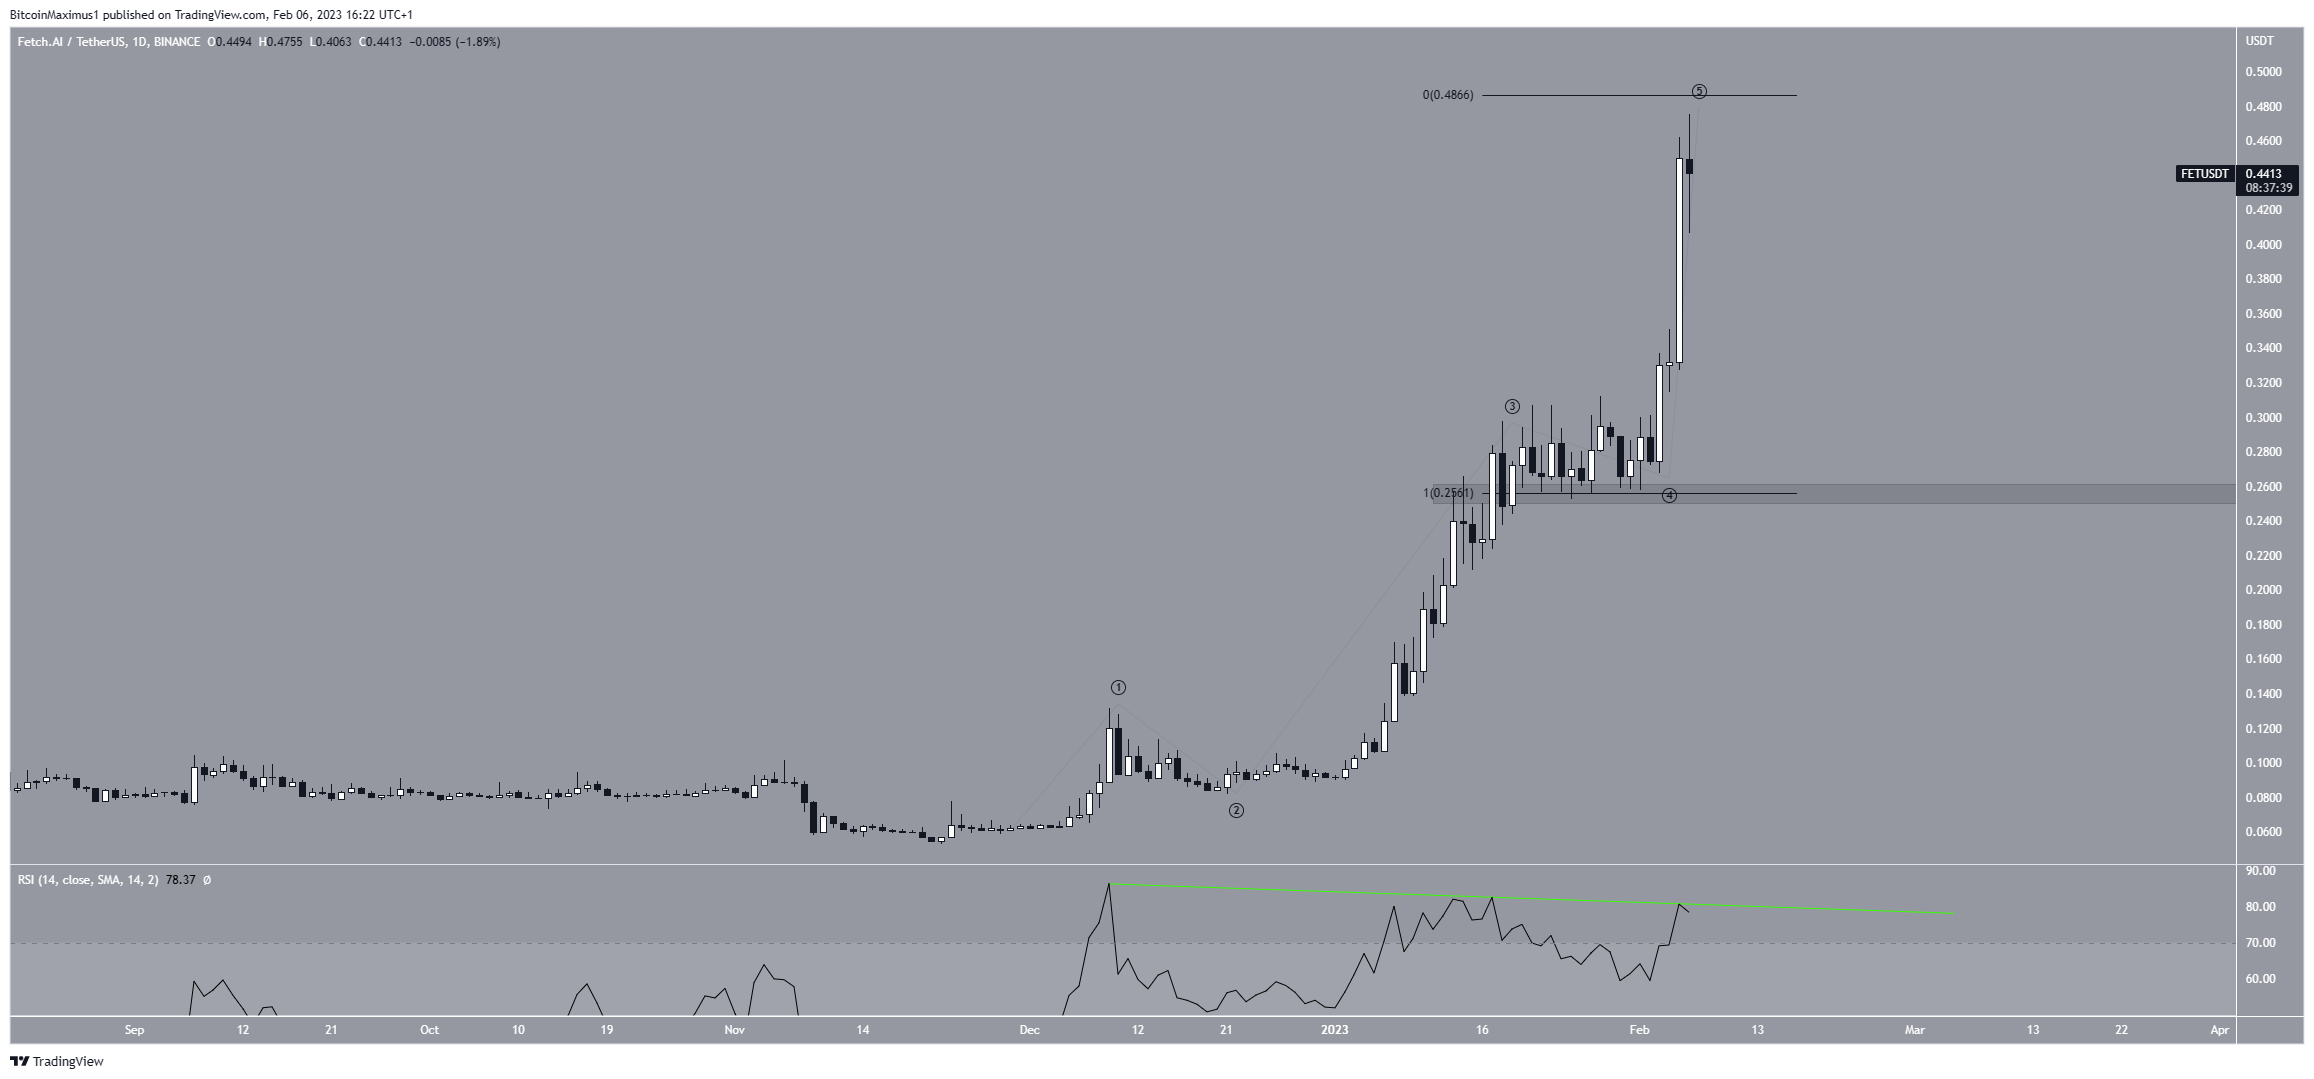
Despite the bullish outlook from the weekly time frame for FET, the daily one provides a bearish one. There are two main reasons for this.
Firstly, the daily RSI generated bearish divergence (green line). The indicator has created three lower highs, all signs that a downward movement could follow.
Secondly, the price has completed a five-wave upward movement. In it, waves three and five had a 1:1 ratio, common in such structures. So, combining these two facts with the long-term resistance at $0.47 makes a FET price decrease likely.
If one occurs, the FET token price could fall to the $0.25 support area.
On the other hand, a close above $0.47 would mean that the trend is still bullish. In that case, the price could increase to $0.90.
To conclude, the most likely Fetch.ai price forecast is a drop toward $0.25, followed by an eventual breakout from the $0.47 area. A weekly close above $0.47 would mean that the correction is complete, and the price can increase to $0.90.
For BeInCrypto’s latest crypto market analysis, click here.


