


The Fetch.ai (FET) price is likely correcting the entire increase from Jan. The correction could end near $0.27.
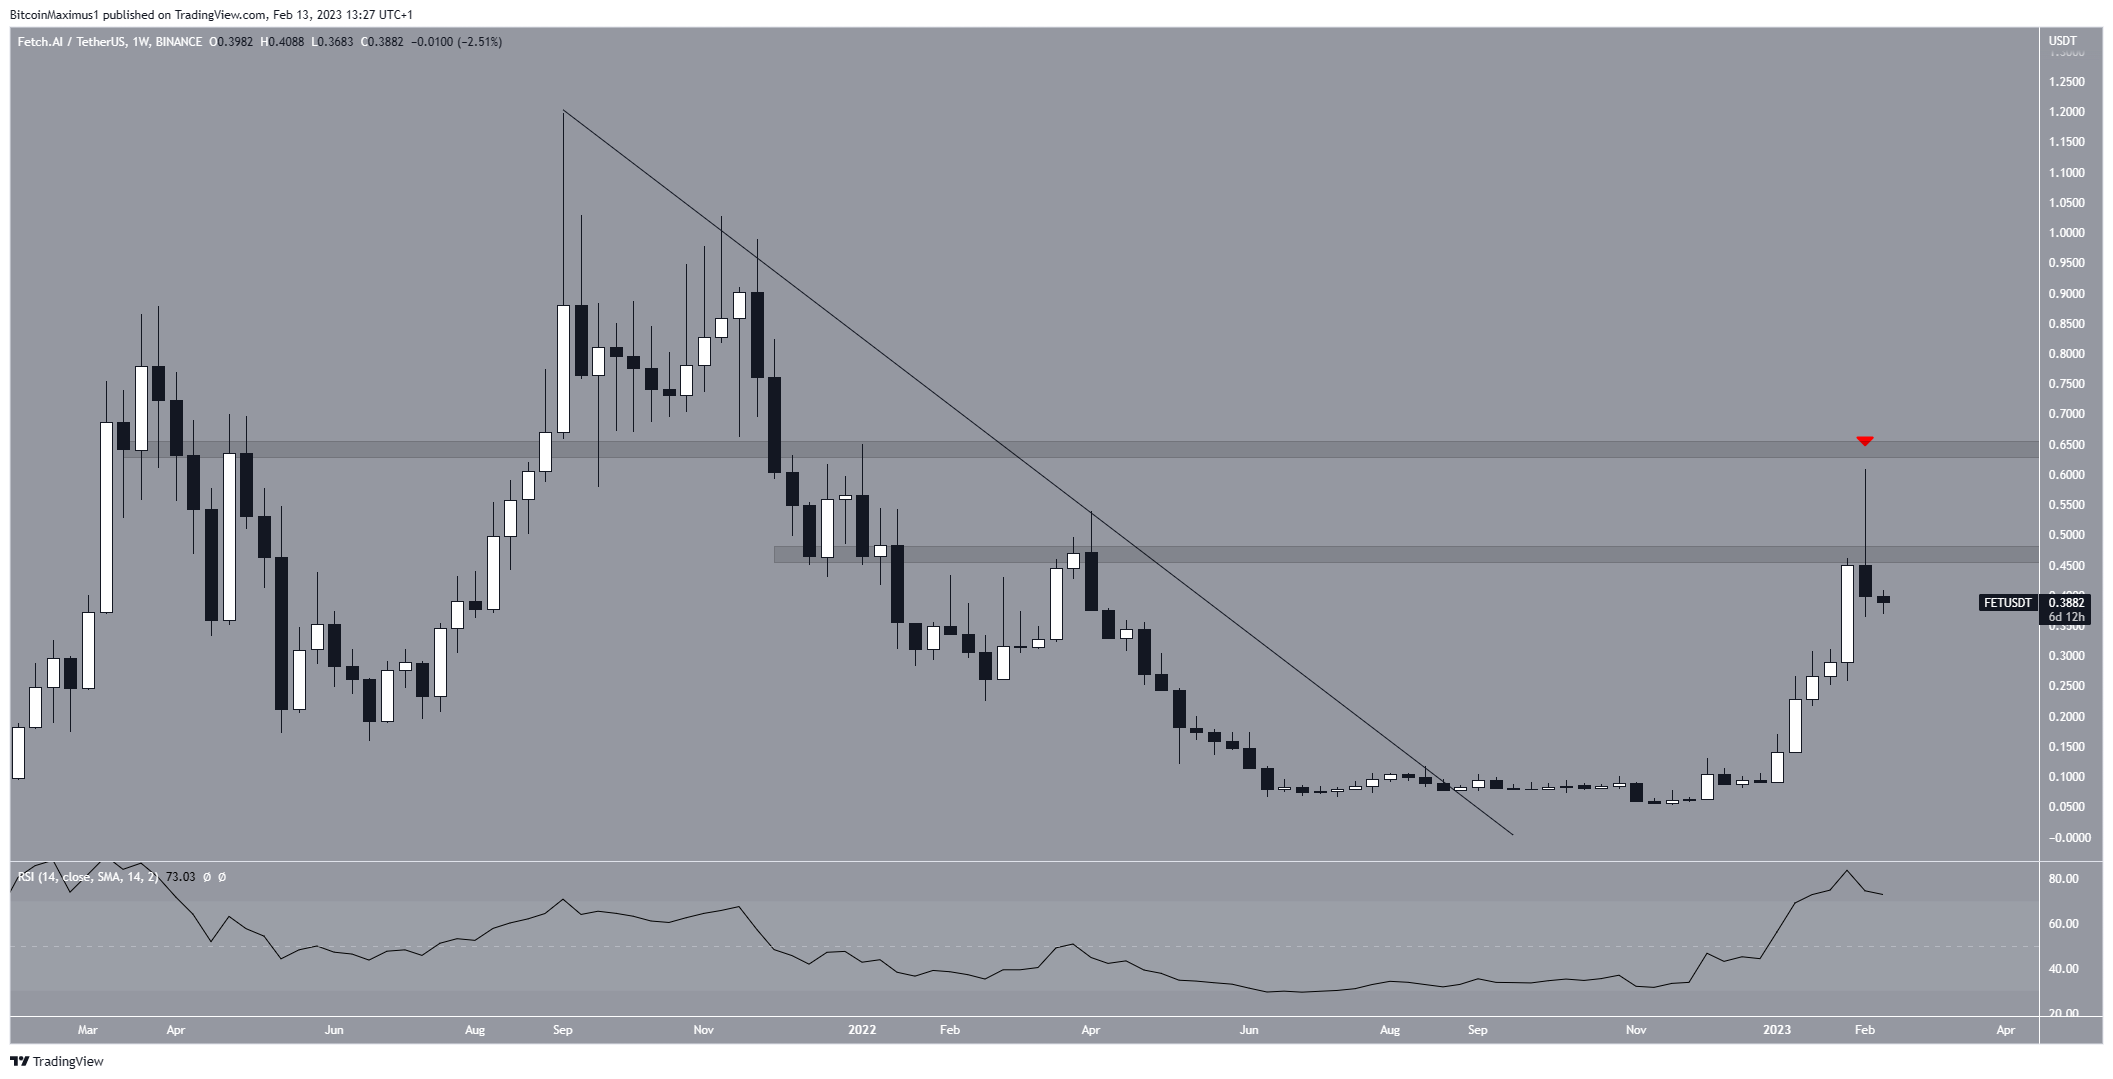
Since breaking out from a long-term descending resistance line, the FET coin price has increased at a rapid pace. It rose by 656% at one point, leading to a high of $0.61. However, the price has fallen since.
More importantly, the FET token failed to close above the $0.47 resistance area. Rather, it created a bearish shooting star candlestick (red icon), which is characterized by a very long upper wick (red icon). This is considered a sign of selling pressure. Moreover, the high was characterized by an overbought RSI reading.
Therefore, a downward movement may now follow. A weekly close above $0.61 would negate this bearish FET price forecast. This could lead to the continuation of the increase toward an average price of at least $0.65.
FET Price Count Predicts Corrective Rally
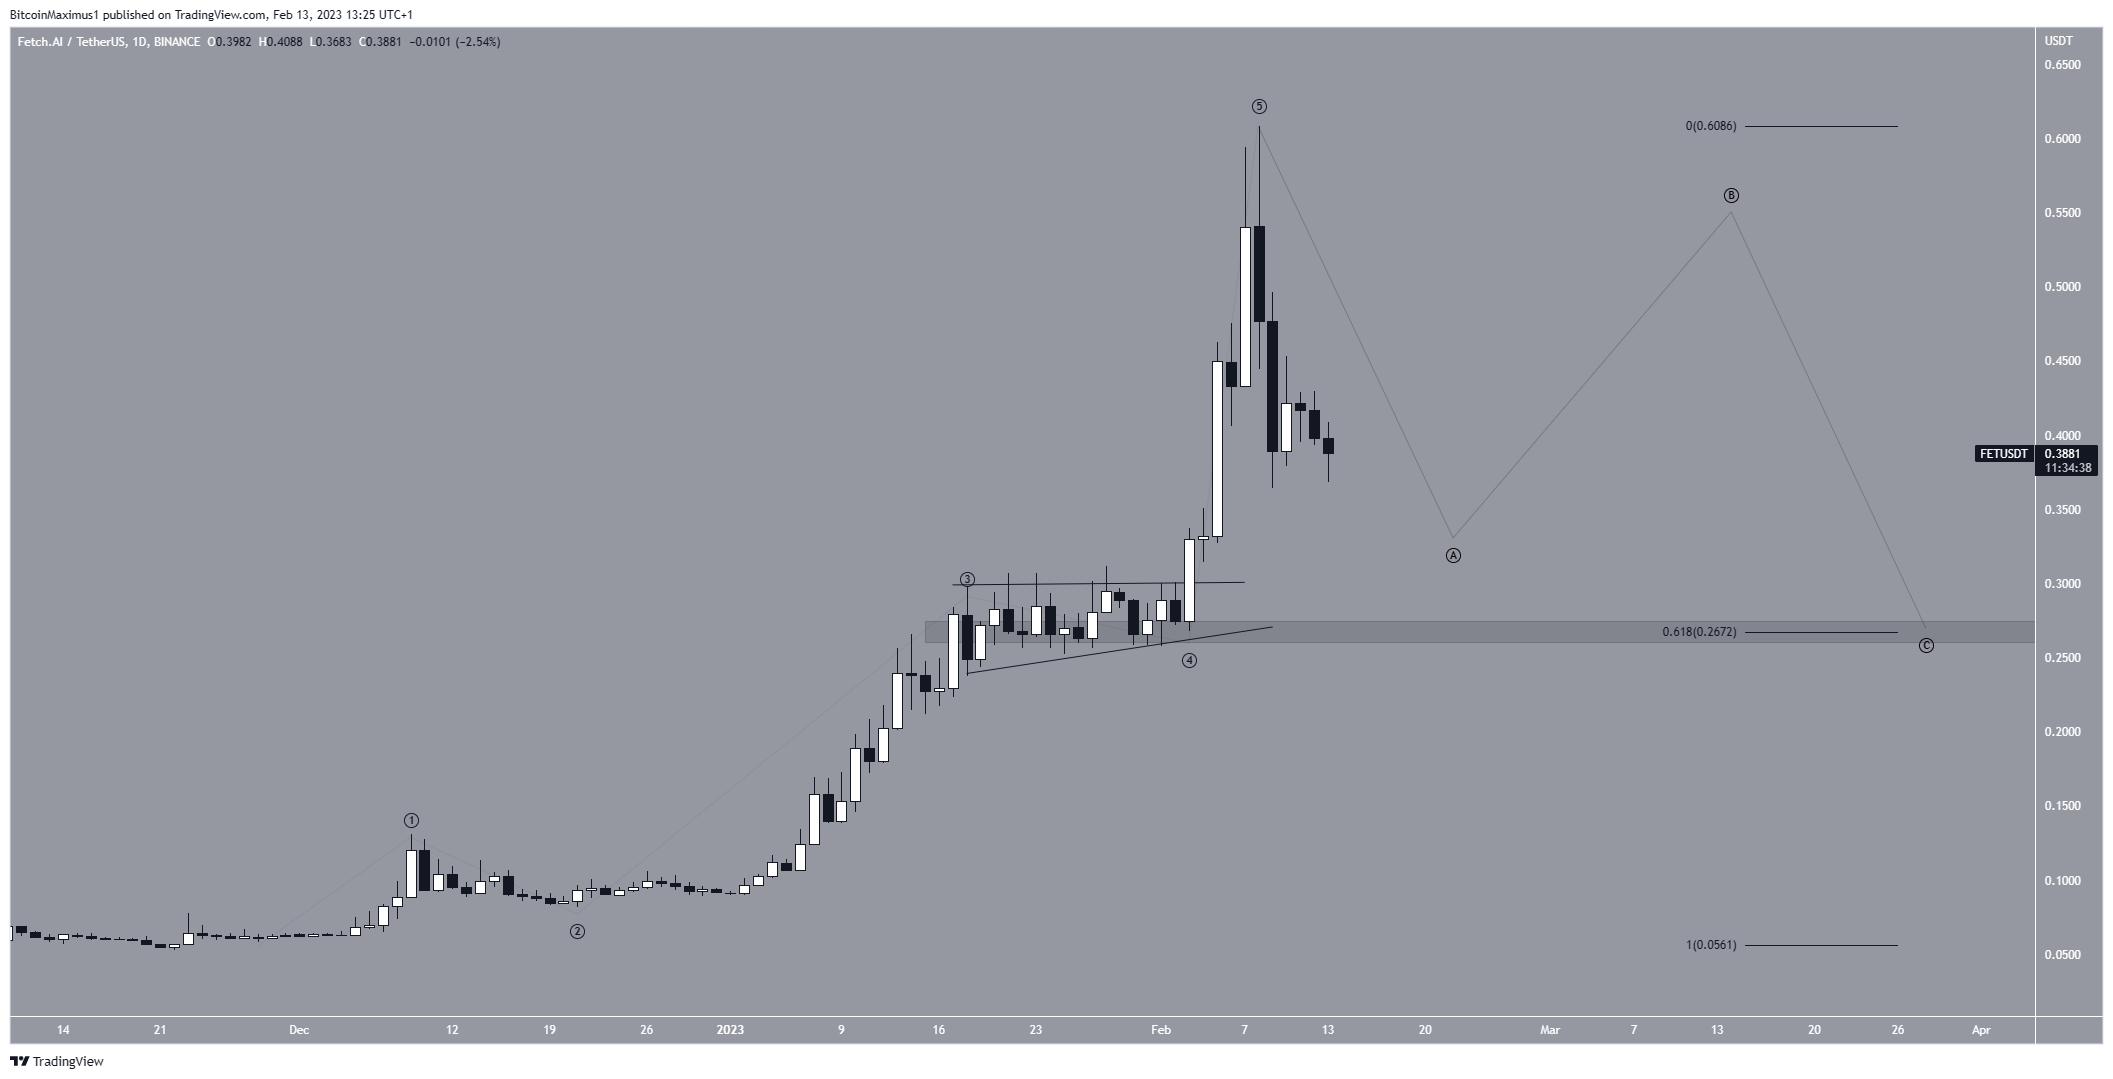
In addition to the weekly time frame’s bearish outlook, the daily time frame price action is bearish. The price has completed a five-wave increase, in which wave five was extended. The shape of the triangle in wave four and the ensuing decrease confirm that this is the correct count.
If so, the Fetch.ai price will likely decrease toward the 0.618 Fib retracement support level at $0.27. This is also a horizontal support area, coinciding with the lows of wave four.
On the other hand, an increase above the previous high of $0.61 would invalidate this bearish count. It would mean that the correction is already complete and could precede an increase toward $0.65.
To conclude, the FET price forecast suggests that the price will gradually correct toward $0.27. An increase above $0.61 would invalidate this bearish forecast and signal that the correction is complete. In that case, FET could pump toward $0.65 and possibly higher.


