Some months back, at the peak of the AI market boom, Artificial Superintelligence Alliance (FET) was trading at an impressive $3.10. Five months later, the token struggles to hold on to the $1 mark.
The decrease in the FET price can be linked to several factors. But as the day passes, the token shows a glimpse of a full return to the bear market. Wondering how? This on-chain analysis gives in-depth details of the project’s current position.
Artificial Superintelligence Alliance Future Uncertain as Indicators Turn Bearish
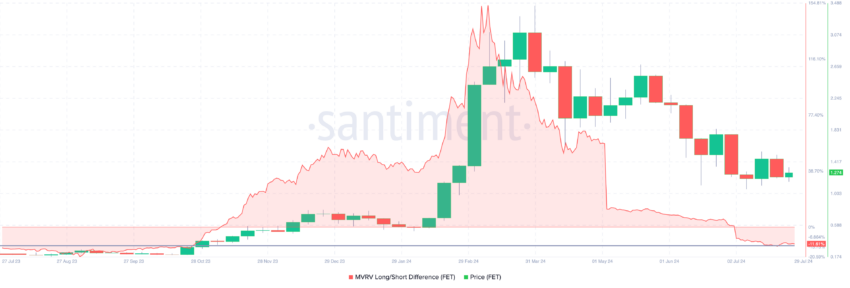
According to Santiment, FET’s Market Value to Realized Value (MVRV) Long/Short Difference is -11.61%. This difference shows whether long-term holders will realize more profits than short-term holders.
If the difference is positive, long-term holders will make more gains. However, since it is negative, it implies that short-term FET holders will likely realize more profits. Historically, this metric has been proven to spot the end of a bear cycle or the beginning of a bull market.
As seen below, the token exited the bear market around October 2023. At that time, FET’s price was $0.39. However, the prolonged increase in price bolstered the investment of its holders until March this year.
Read more: Top 9 Artificial Intelligence (AI) Cryptocurrencies in 2024

Since then, FET, which is set to complete the ASI merger, has experienced a more than 20% fall. The price decline has ensured that the MVRV Long/Short Difference is at a similar level before the bull run began in late 2023.
Should the cryptocurrency’s price continue to decline, the Artificial Superintelligence Alliance may not have the optimism around the merger to protect it. Instead, it could plunge into a full-blown bear phase.
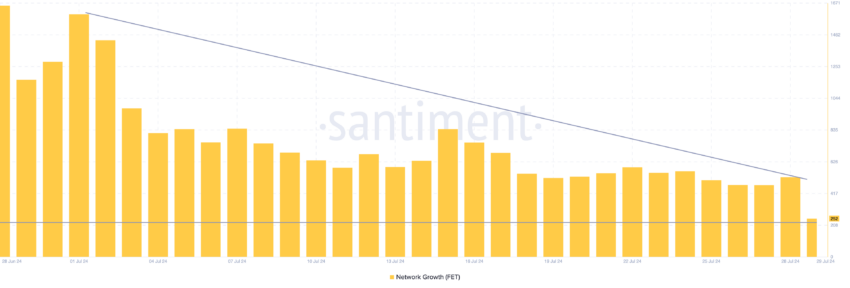
In addition, the project’s Network Growth has been declining. Network Growth tracks the number of new addresses making their first transaction on a blockchain.

An increase in this metric suggests a rise in traction. However, since the number fell, it implies that FET struggles to attract adoption from new market participants.
If this remains the same, FET’s price risks dropping below $1.Should this happen, it could get the token very close to another bear market phase.
FET Price Prediction: A Decrease Lies Ahead
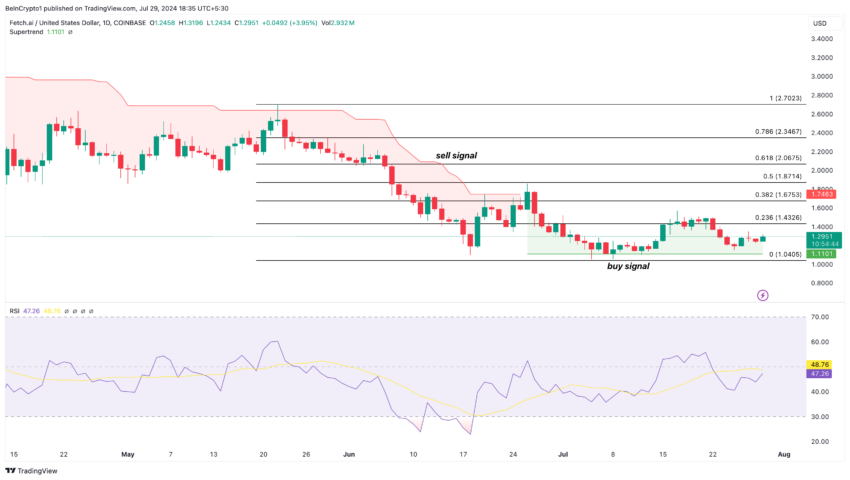
As of this writing, FET trades at $1.29, and the Supertrend shows that the token may have presented a buy signal at $1.11. The Supertrend indicator analyzes price movement in a downtrend or uptrend.
If the green segment of the indicator is below the price, it is a buy signal. However, if the red part is above the price, it is a sell signal and leads to a price decrease. Furthermore, the signs shown by FET on the daily chart suggest that the path to a higher price is unclear.
However, the cryptocurrency may still decline, especially as it faces resistance around $1.34. If FET gets rejected at this point, the next level to reach may be around $1.04. The Relative Strength Index (RSI), which is below the neutral region, supports this move.
Read more: How To Invest in Artificial Intelligence (AI) Cryptocurrencies?

If buying pressure increases, this prediction may be invalidated. If that happens, FET’s price may rebound to $1.43 and subsequently $1.67.
Disclaimer
In line with the Trust Project guidelines, this price analysis article is for informational purposes only and should not be considered financial or investment advice. BeInCrypto is committed to accurate, unbiased reporting, but market conditions are subject to change without notice. Always conduct your own research and consult with a professional before making any financial decisions. Please note that our Terms and Conditions, Privacy Policy, and Disclaimers have been updated.


