


In today’s analysis, BeInCrypto takes a look at the famous Fear and Greed Index, which has returned to neutral levels after 9 months. The end of a long period of extremely negative market sentiment is another argument for the completion of the downward cycle in the cryptocurrency market.
The Fear and Greed Index was in a range of fear (orange, 26-45) and extreme fear (red, 0-25) for the vast majority of 2022. The previous day when the index was above the 50 level (blue line) was April 5. At that time, the Bitcoin price was at $45,500.
Then a steep decline began in the BTC price and the correlated chart of the Fear and Greed Index. The index fell particularly sharply after the crash of the Terra (LUNA) ecosystem in May-June 2022. Meanwhile, the November FTX collapse took the index to low of 20.
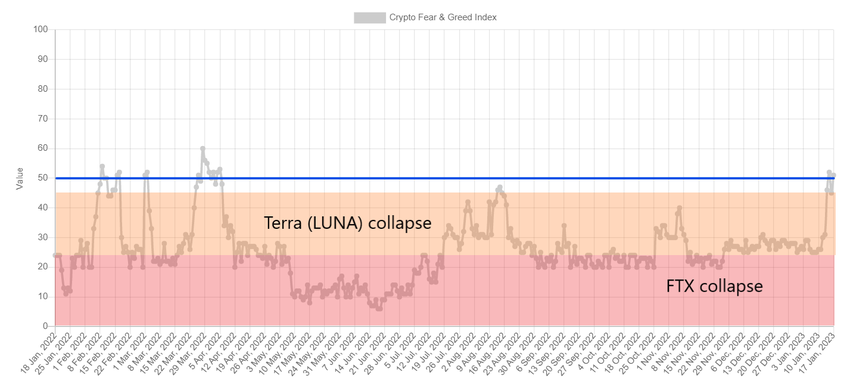
Fear and Greed Index vs. Bitcoin price
Today, the index gives a reading of 51. In recent days, it has returned to neutral territory (46-54) for the first time in 9 months. The price of Bitcoin is consolidating around $21,000.
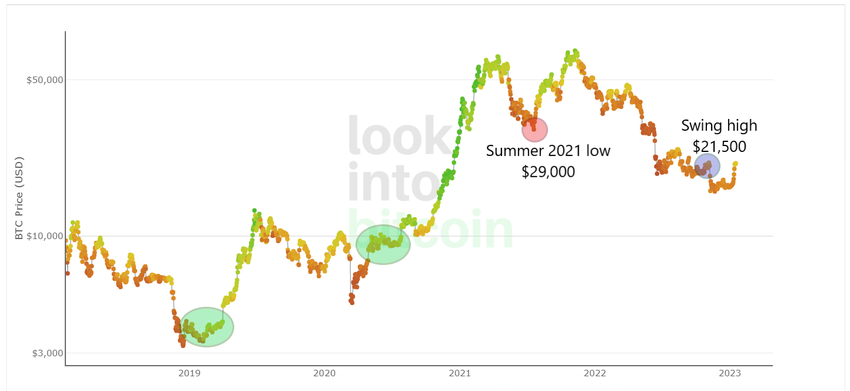
If we look at the long-term chart of Bitcoin color-coded according to the readings from the Fear and Greed Index, we can see the first signals of a potential trend reversal. Firstly, we see a bullish divergence between the period of the collapse of the Terra ecosystem (LUNA) and the FTX exchange. The latter event drove the price of BTC to lower lows. However, the Fear and Greed Index did not record as low levels as it did with the first crash.
Secondly, the index is giving neutral readings today for the first time since the collapse of the macrostructure of the previous bull market. The May drop of Bitcoin price below the summer 2021 low at $29,000 (red circle) confirmed a long-term bearish trend reversal. Now there is a chance for an opposite signal. This will happen if the BTC price manages to break out above the November “swing high” at $21,500 (blue circle).
Thirdly, in the previous two cases of extreme lows of the Bitcoin price in 2019 and 2020, the return of the indicator to the neutral area was a signal of the end of the accumulation period. The start of an uptrend followed about 1-2 months after this event (green areas).
Moving averages and EMO cross
Cryptocurrency investor and market analyst @AtomowyInvestor has tweeted an update to his moving averages (SMA) chart of the Fear and Greed Index. He takes into account 3 curves: quarterly (91D SMA, yellow), semi-annual (182D SMA, red) and annual (365D SMA, green).
In his opinion, key moments on this chart occur when the yellow (quarterly) moving average breaks above the two longer averages – red and green. The analyst calls this event an “EMO cross” (white circle).
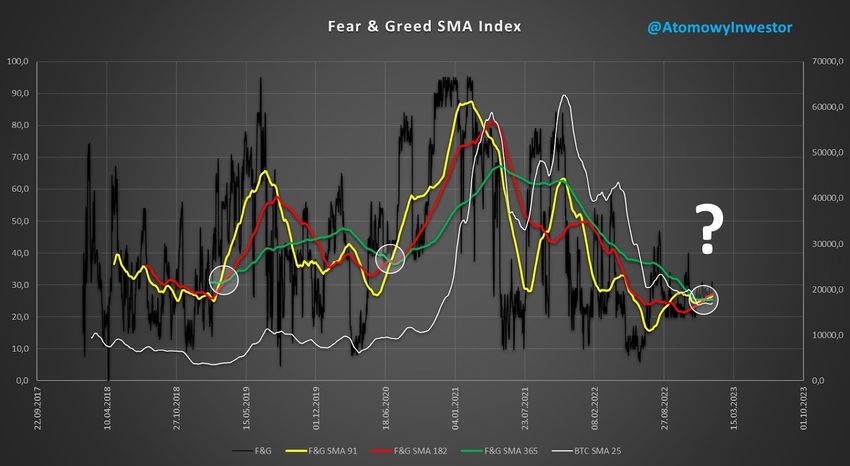
In the chart above, we see two situations in which an EMO cross occurred. The first was in early 2019, after the previous bear market ended. While the second occurred in June 2020, after Bitcoin recovered from the COVID-19 crash of March 2022. In both cases, the EMO cross was a signal of imminent increases in the BTC price.
A potential third case of EMO cross is observed today. A few days ago, the yellow (quarterly) curve broke out above the green (annual) curve. However, it is still below the red one (six-month), so the signal is not confirmed. The analyst stated:
“I do not see the demand and strong euphoria that was typical in previous EMO crosses.”
In conclusion, it should be said that the analysis of the Fear and Greed Index provides the first signals of a bullish trend reversal in the cryptocurrency market. However, these are still early signals that are more indicative of an ongoing accumulation phase than the start of an uptrend. If neutral sentiment remains in the market for another few weeks, there is a chance of an imminent return of the bull market.
For BeInCrypto’s latest crypto market analysis, click here.


