


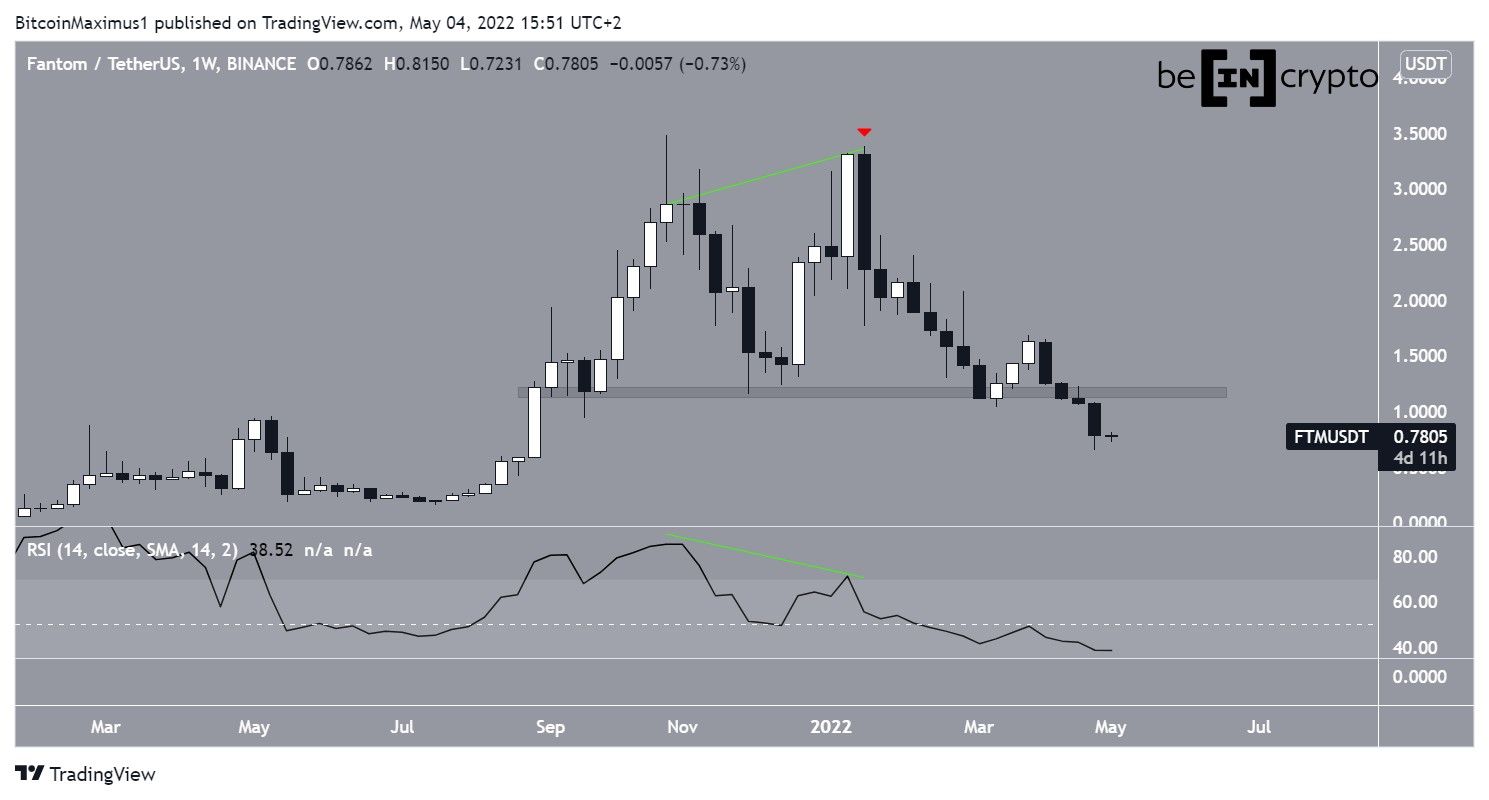
Fantom (FTM) has broken down from a support area that had been in place since Sept. 2021. It has yet to show any signs that it might have reached a bottom.
FTM has been falling since reaching an all-time high price of $3.48 on Oct. 25, 2021. In Jan. 2022, it reached a slightly lower high (red icon), effectively creating a double top. The double top is a bearish pattern that often leads to bearish trend reversals.
Additionally, the pattern was combined with bearish divergence (green line) in the RSI. This further increased the significance of the bearish pattern.
FTM has been decreasing at an accelerated rate since. While it briefly bounced at the $1.18 horizontal support area, which had been in place since Sept. 2021, it broke down in April and has so far reached a low of $0.65.
The breakout was also combined with an RSI drop below 50, confirming its validity.
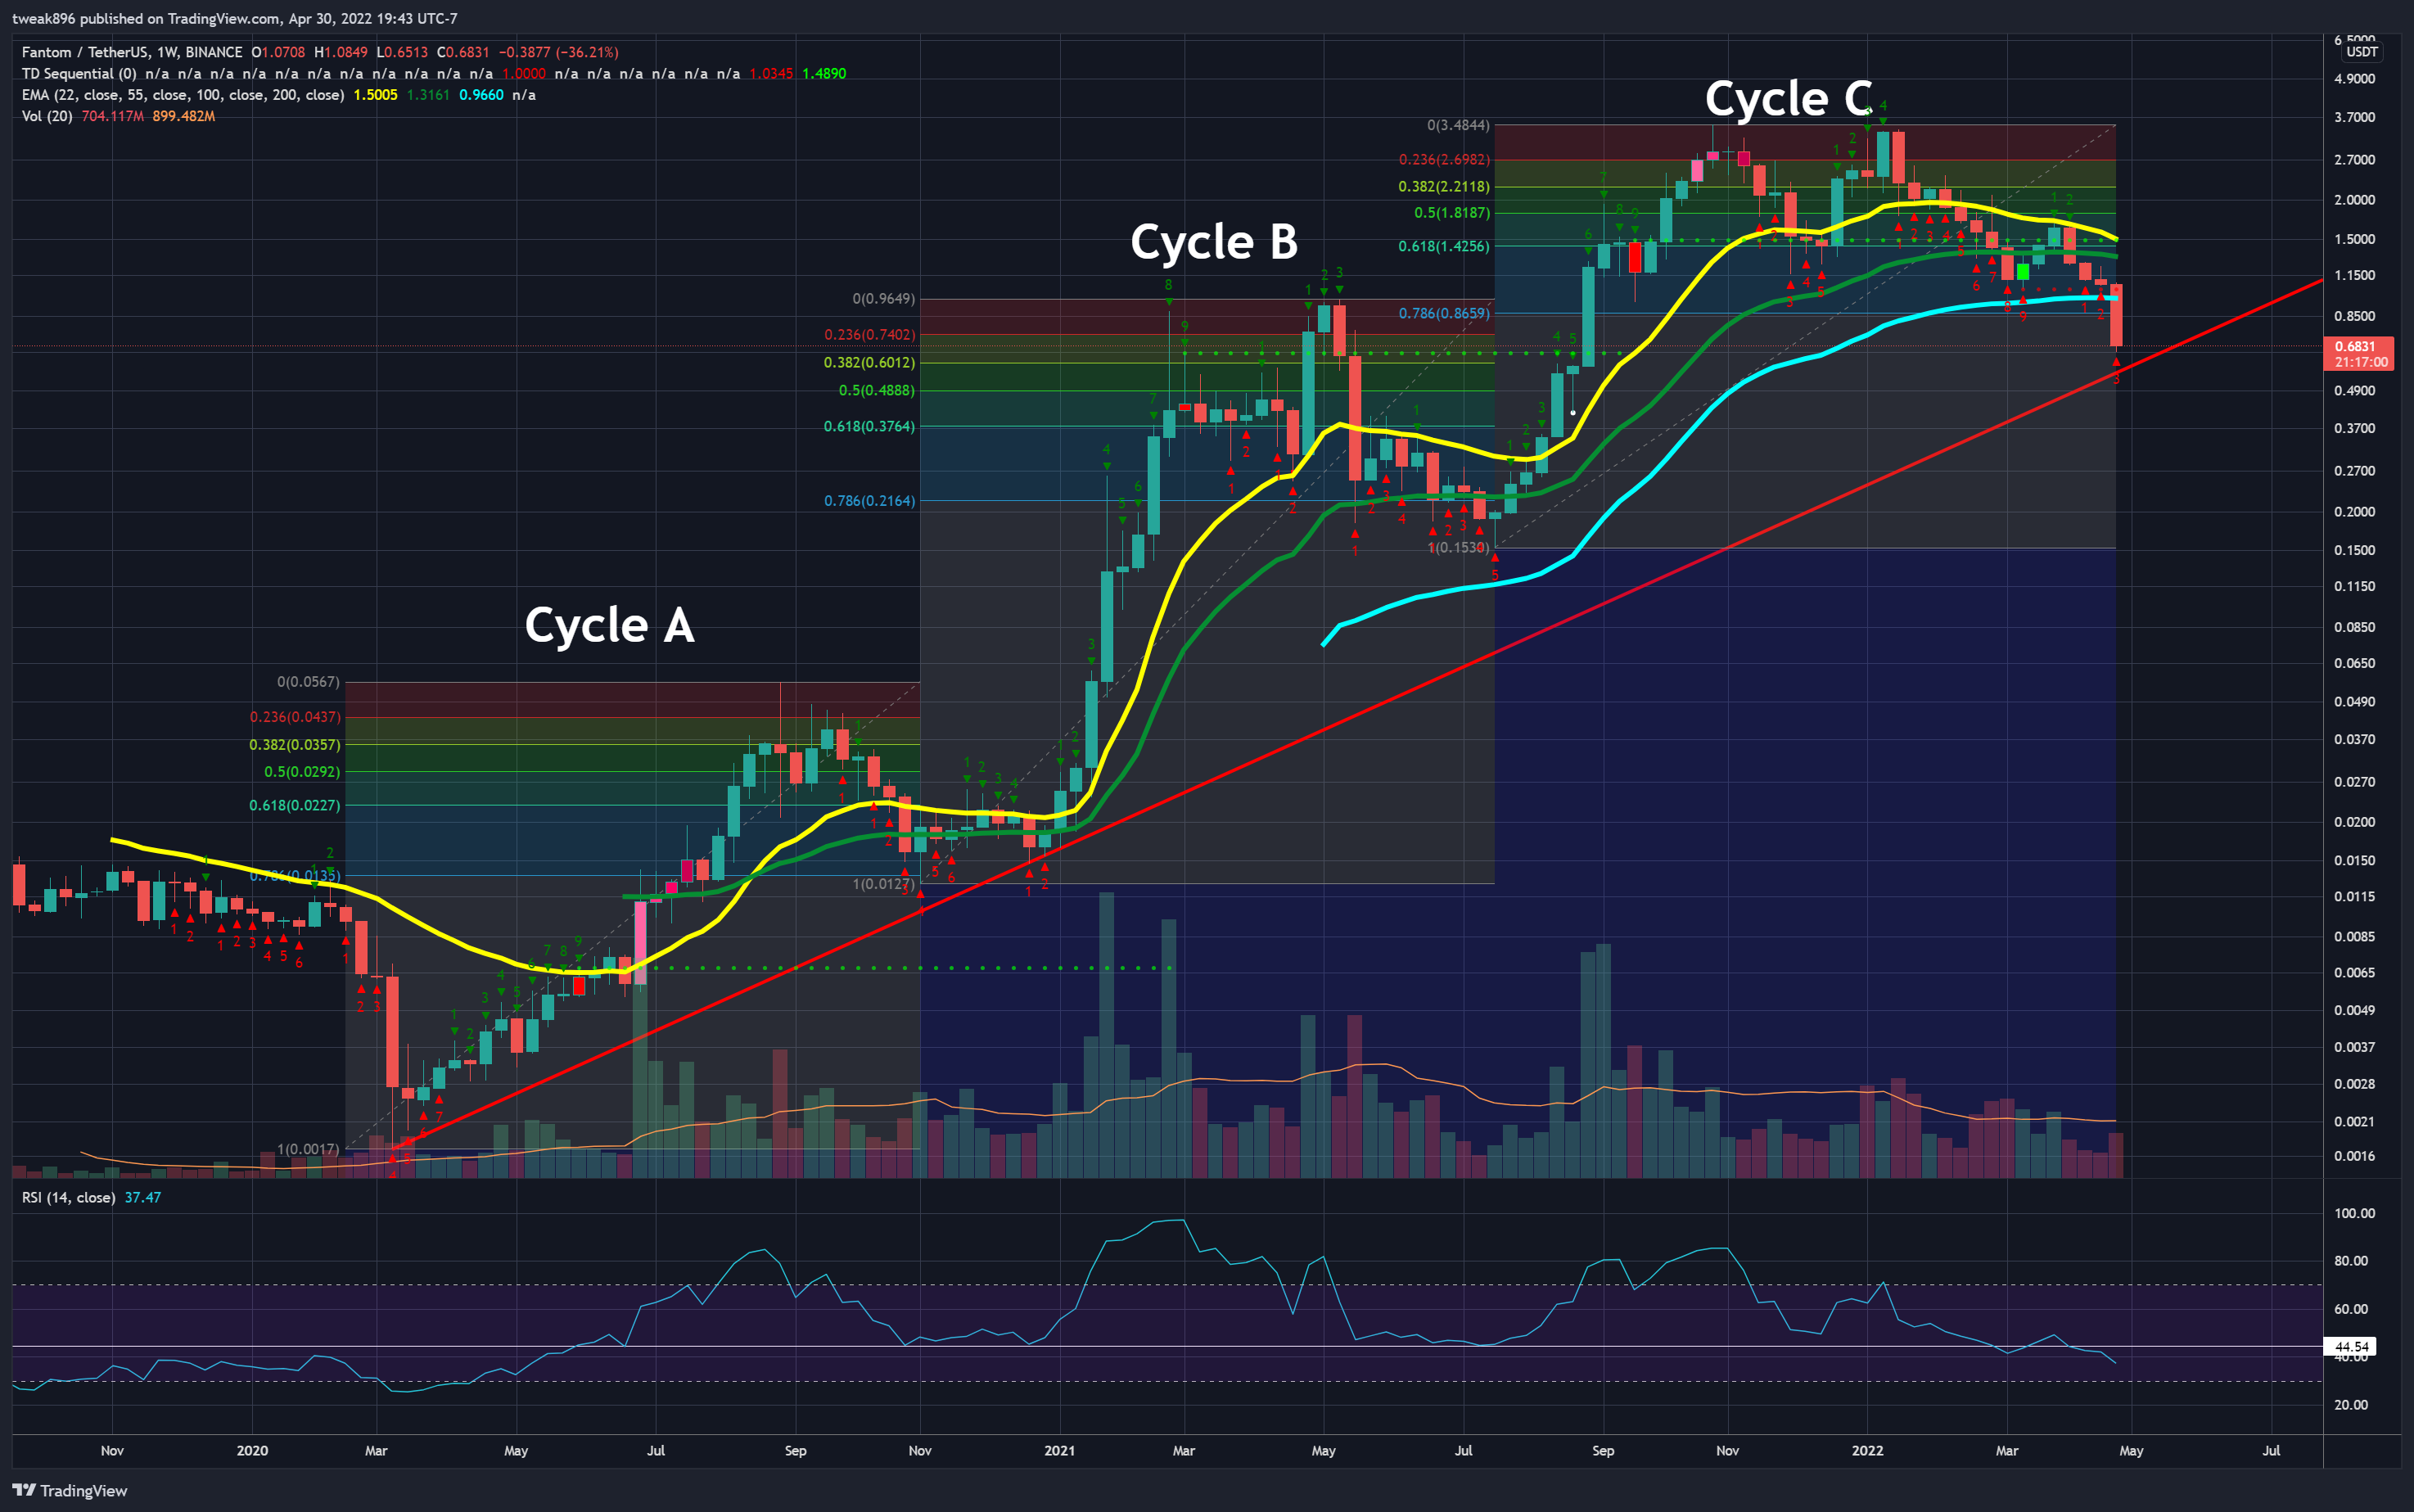
Cryptocurrency trader @Tweak896 tweeted a chart of FTM, stating that the third corrective cycle is now complete.
Due to the aforementioned bearish signs, a closer look at lower time frames is required in order to determine if FTM has bottomed.
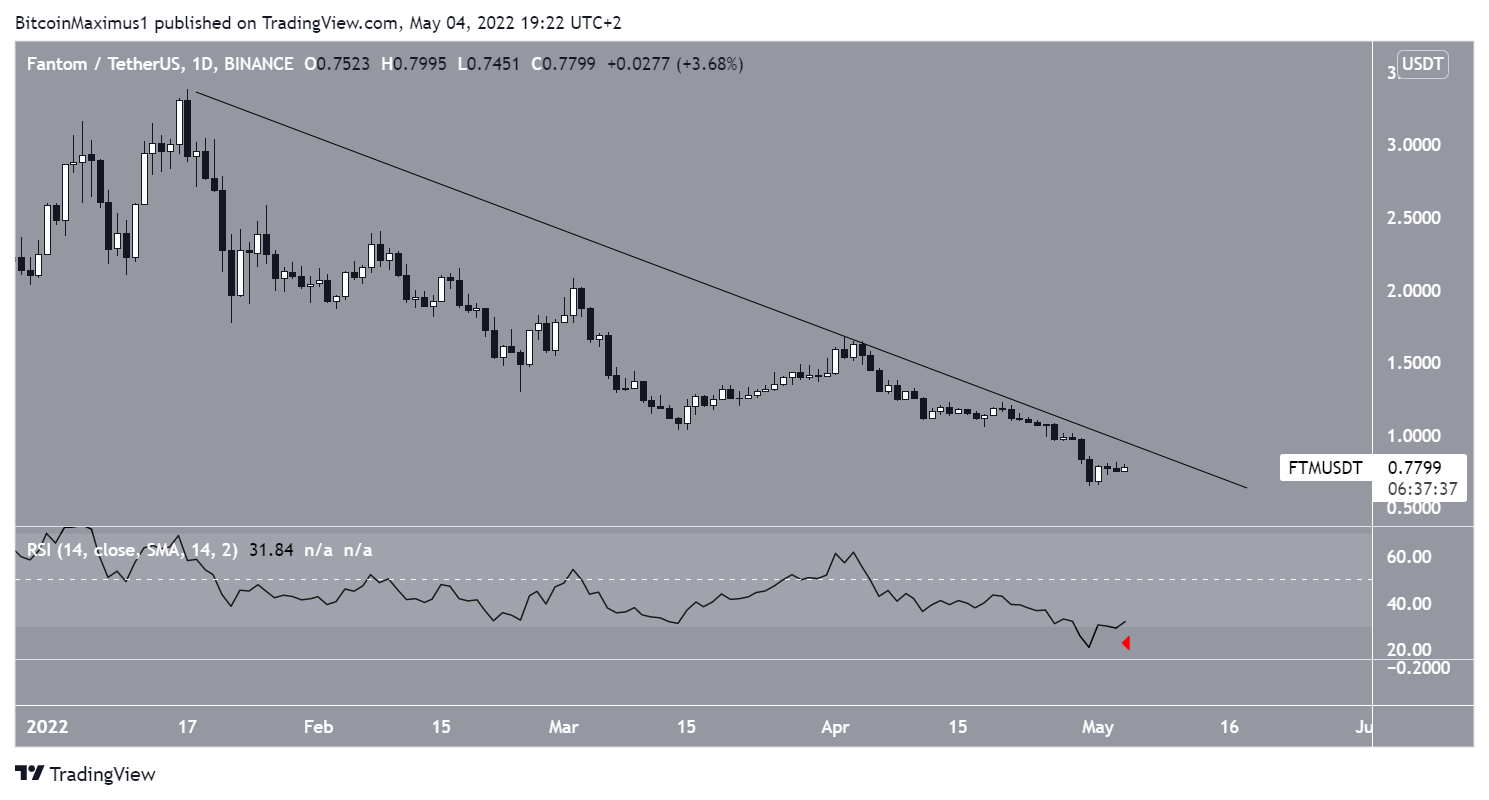
Lowest RSI in two years
Similarly to the weekly time frame, the daily one does not show any signs of a bullish reversal. While the RSI is at its lowest level since March 2020, it has yet to show any potential signs of a bullish reversal. Additionally, there are no signs of a bullish structure at all.
To the contrary, FTM seems to be following a descending resistance line in place since the Jan. highs. A breakout from it would be required in order for the trend to be considered bullish.
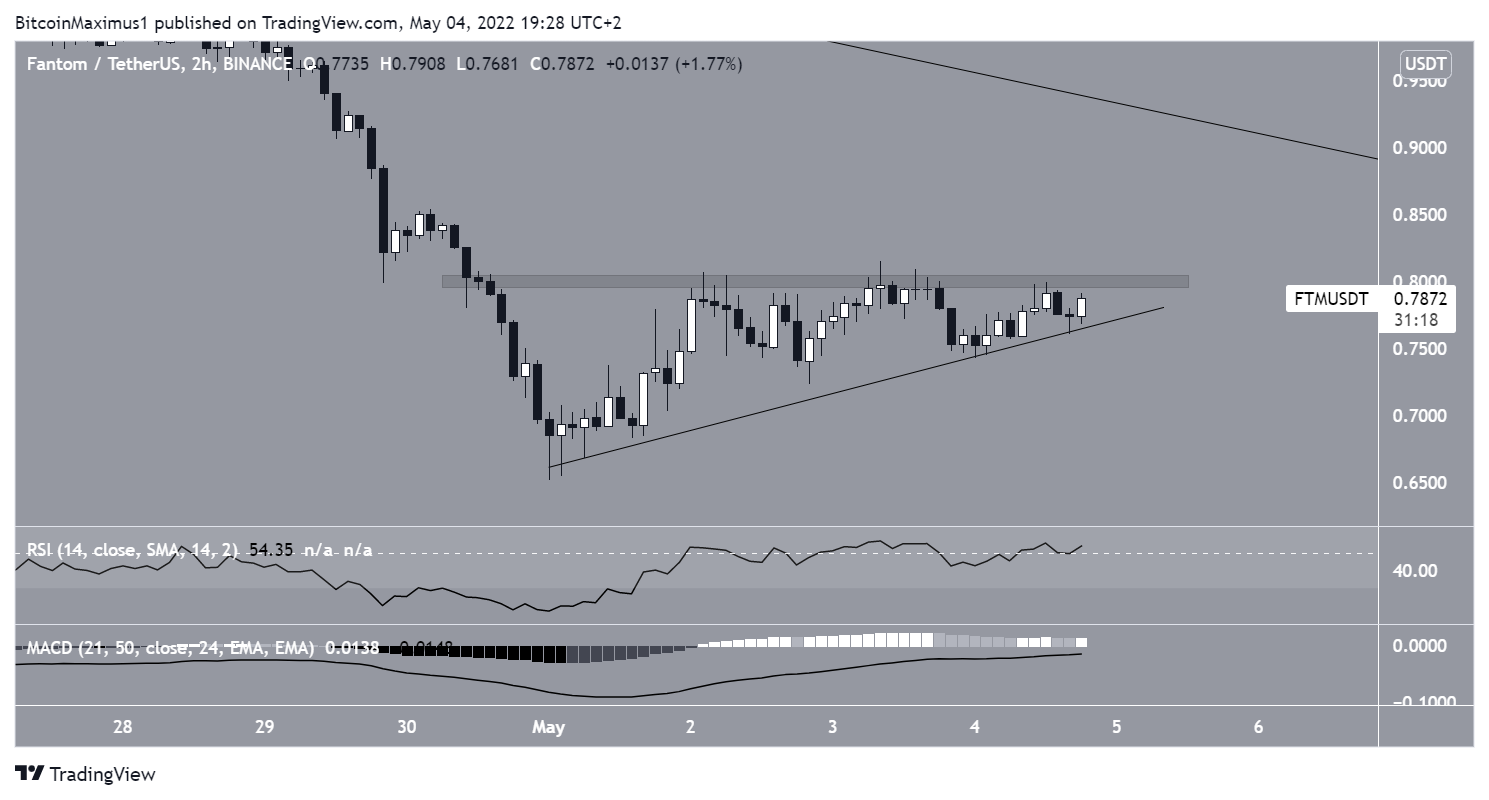
While the weekly and daily time frames are bearish, the two-hour one suggests that a short-term breakout might occur.
The reason for this is that FTM seems to be trading inside a short-term ascending triangle since the beginning of May. Such triangles usually lead to breakouts.
However, even if the price breakouts, this would likely only lead to a re-test of the aforementioned descending resistance line prior to another drop.
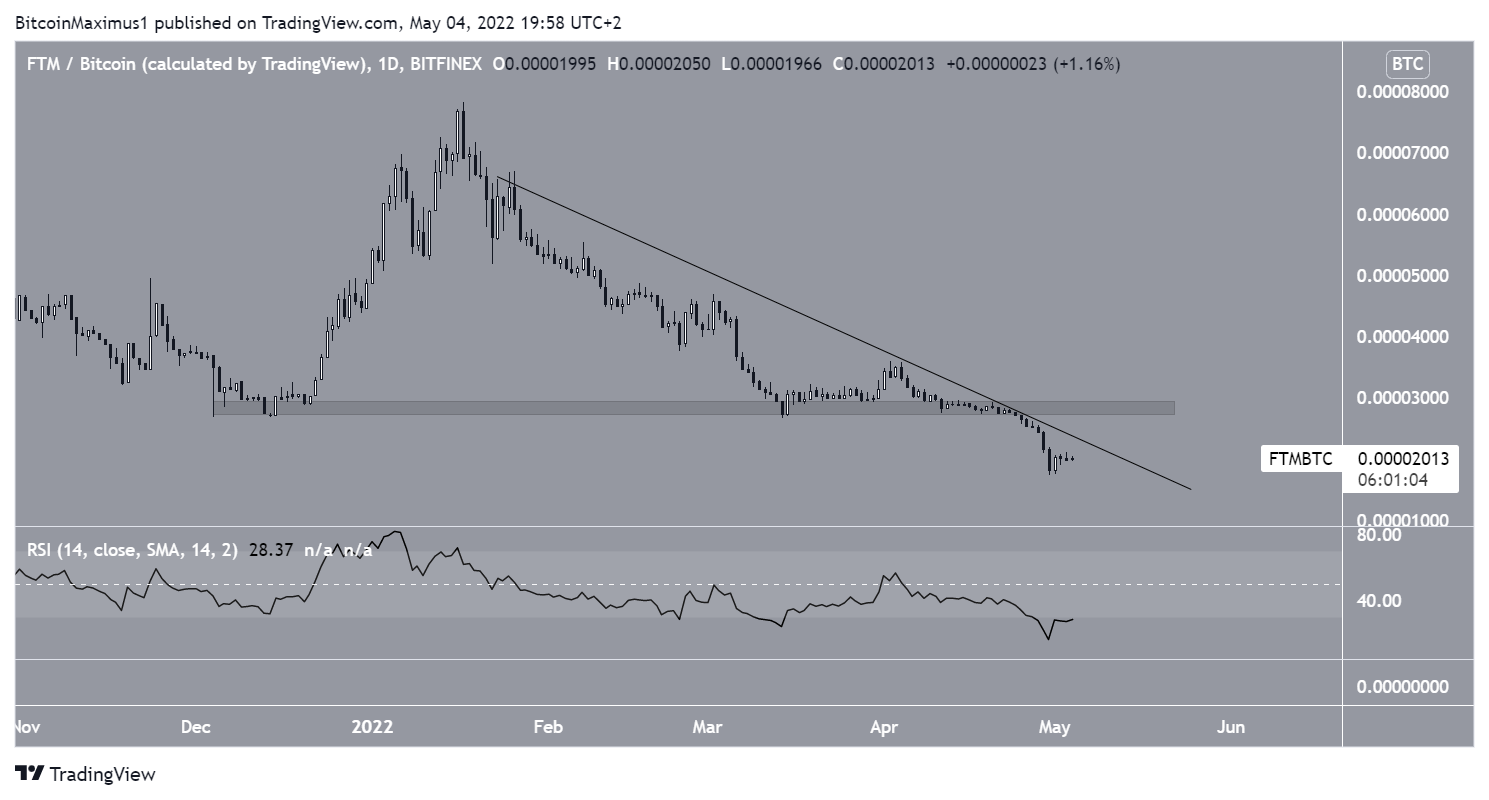
FTM/BTC
Similarly to the USD pair, the price action for FTM/BTC is bearish. The price has been decreasing alongside a descending resistance line and broke down from the 2900 satoshi support area on April 25.
Besides the oversold RSI, there are no signs of a potential bullish reversal.
For BeInCrypto’s latest Bitcoin (BTC) analysis, click here


