Fantom (FTM) increased considerably in December. A breakout above $2.65 would likely lead to a new all-time high price.
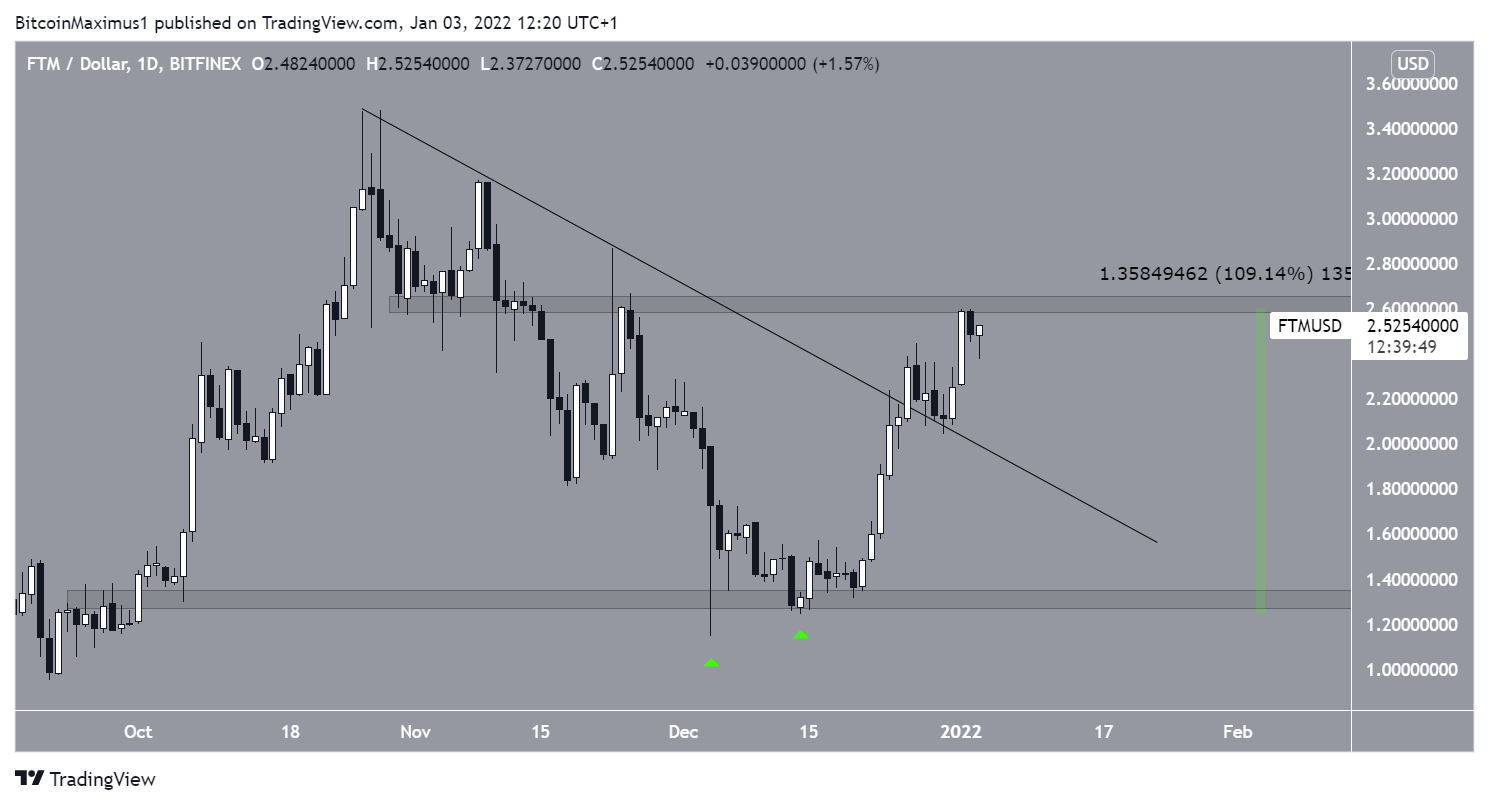
FTM has been increasing since reaching a low of $1.14 on Dec 4. The same day, it created a very long lower wick, which is considered a sign of buying pressure (green icon). On Dec 14, the token created a higher low and resumed its upward movement at an even more accelerated rate. So far, it has increased by 110%, leading to a high of $2.59 on Jan 1.
On Dec 26, FTM broke out from a descending resistance line that had been in place since the Oct 26 all-time high. This confirmed that the correction is complete.
The main resistance area is at $2.65. A breakout above it would likely lead to a new all-time high price.
Cryptocurrency trader @AltcoinSherpa tweeted an FTM chart, stating that the token is likely to increase towards $2.4.
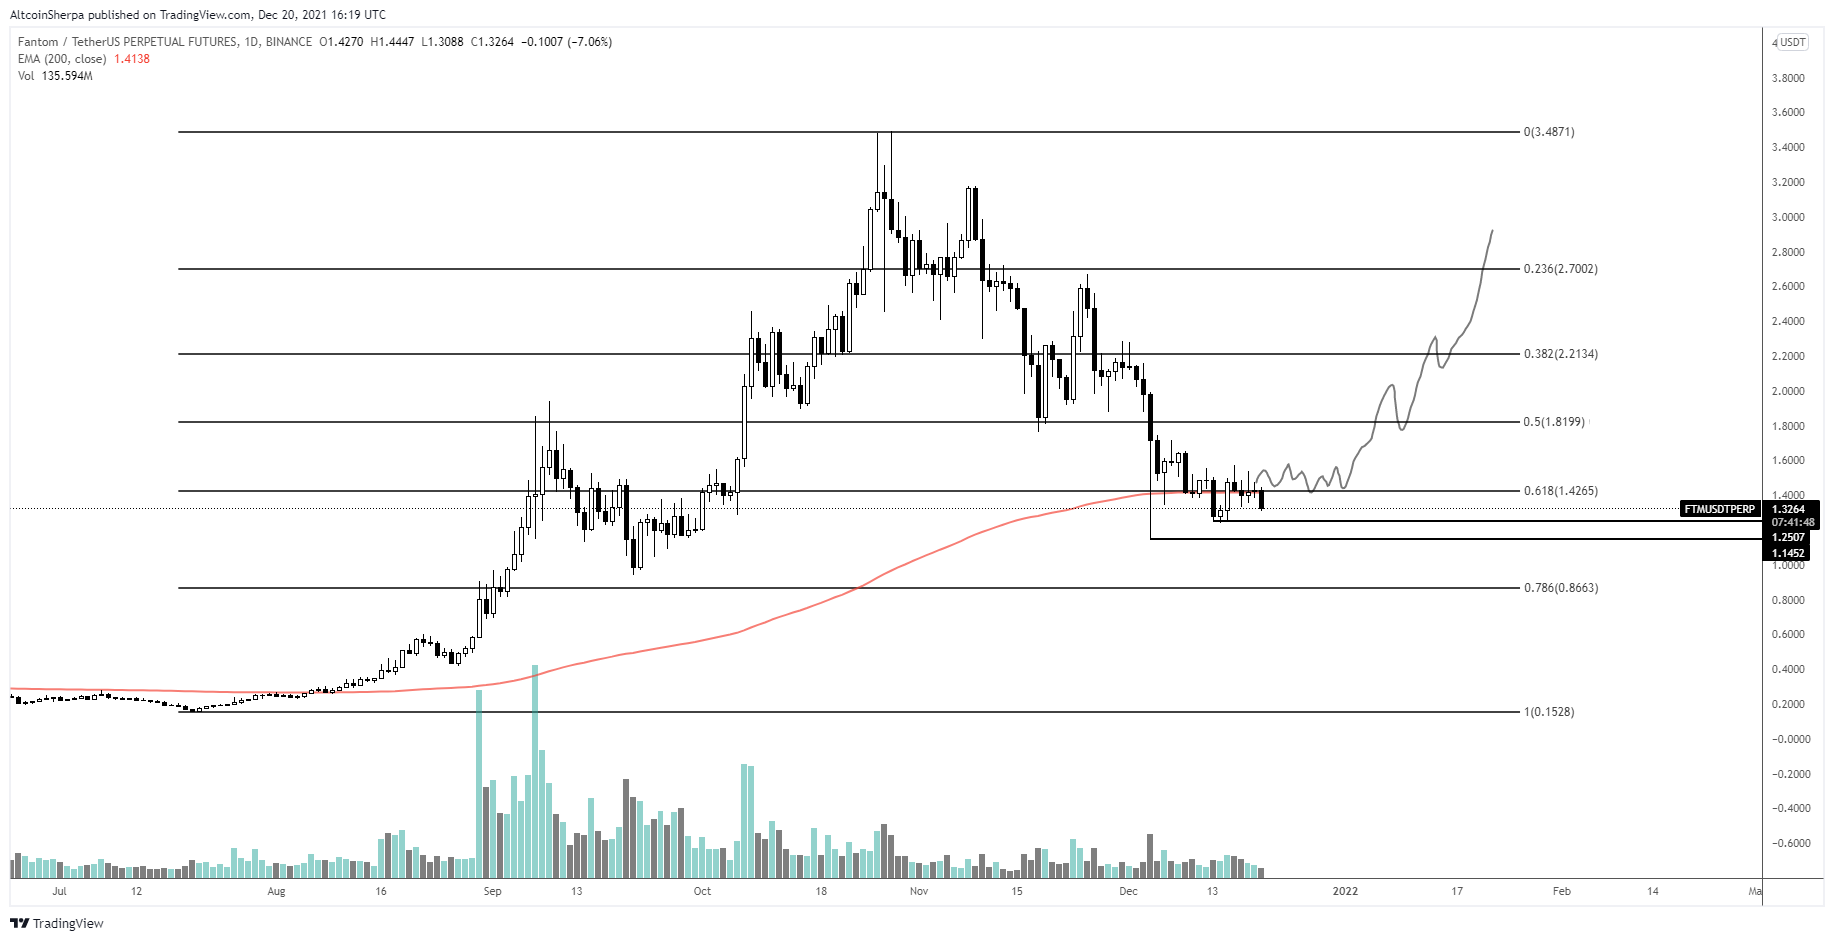
Since the tweet, the token has already reached this level, and is now attempting to break out.
Current movement
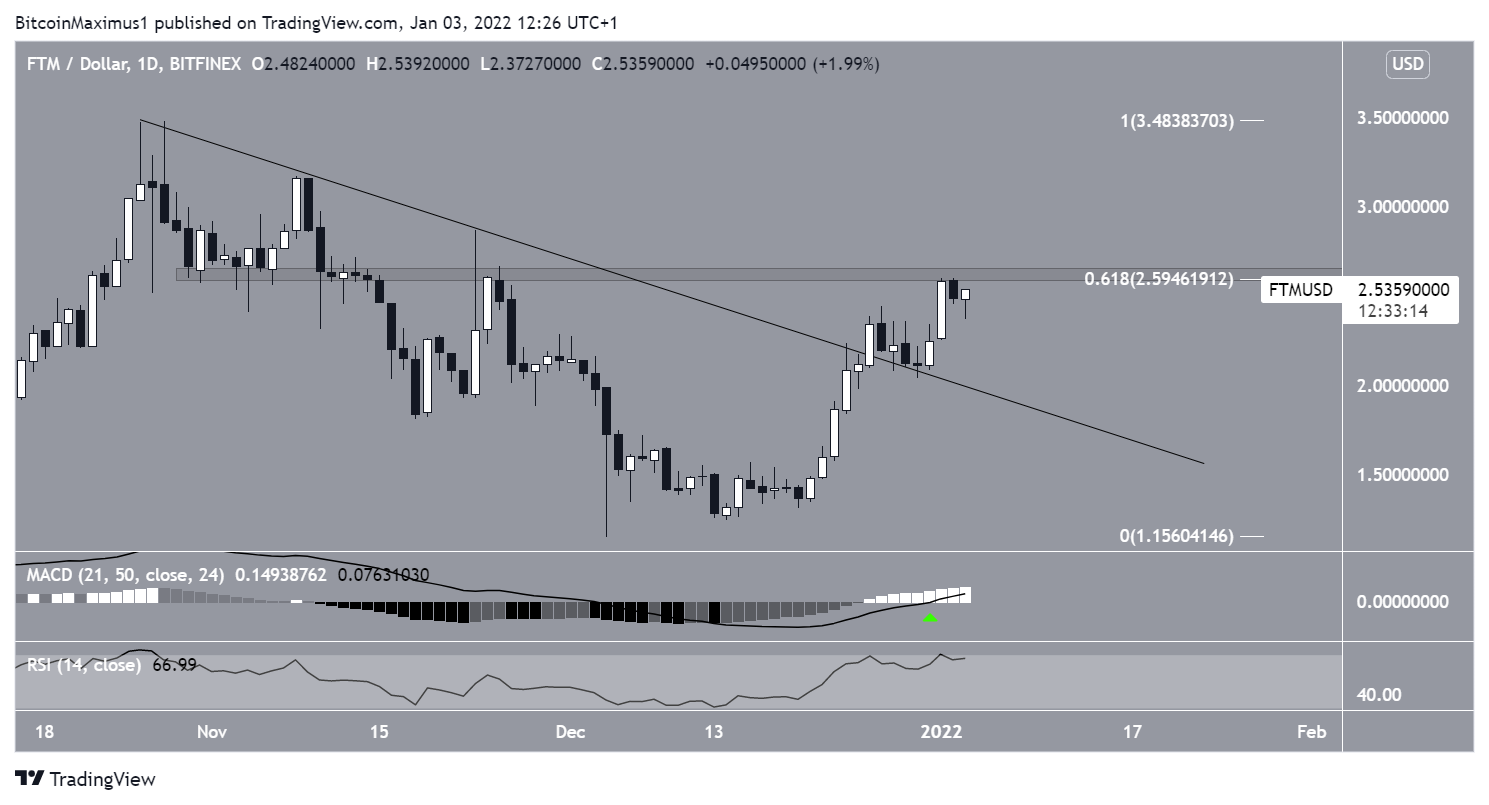
Technical indicators for FTM in the daily time-frame also support the continuation of the upward movement.
The MACD, which is created by a short- and a long-term moving average (MA), is increasing and has crossed into positive territory (green icon). This means that the short-term MA is faster than the long-term one, and supports the continuation of the upward movement.
The RSI, which is a momentum indicator, is increasing and is nearly above 70. This is also a sign that a breakout is likely.
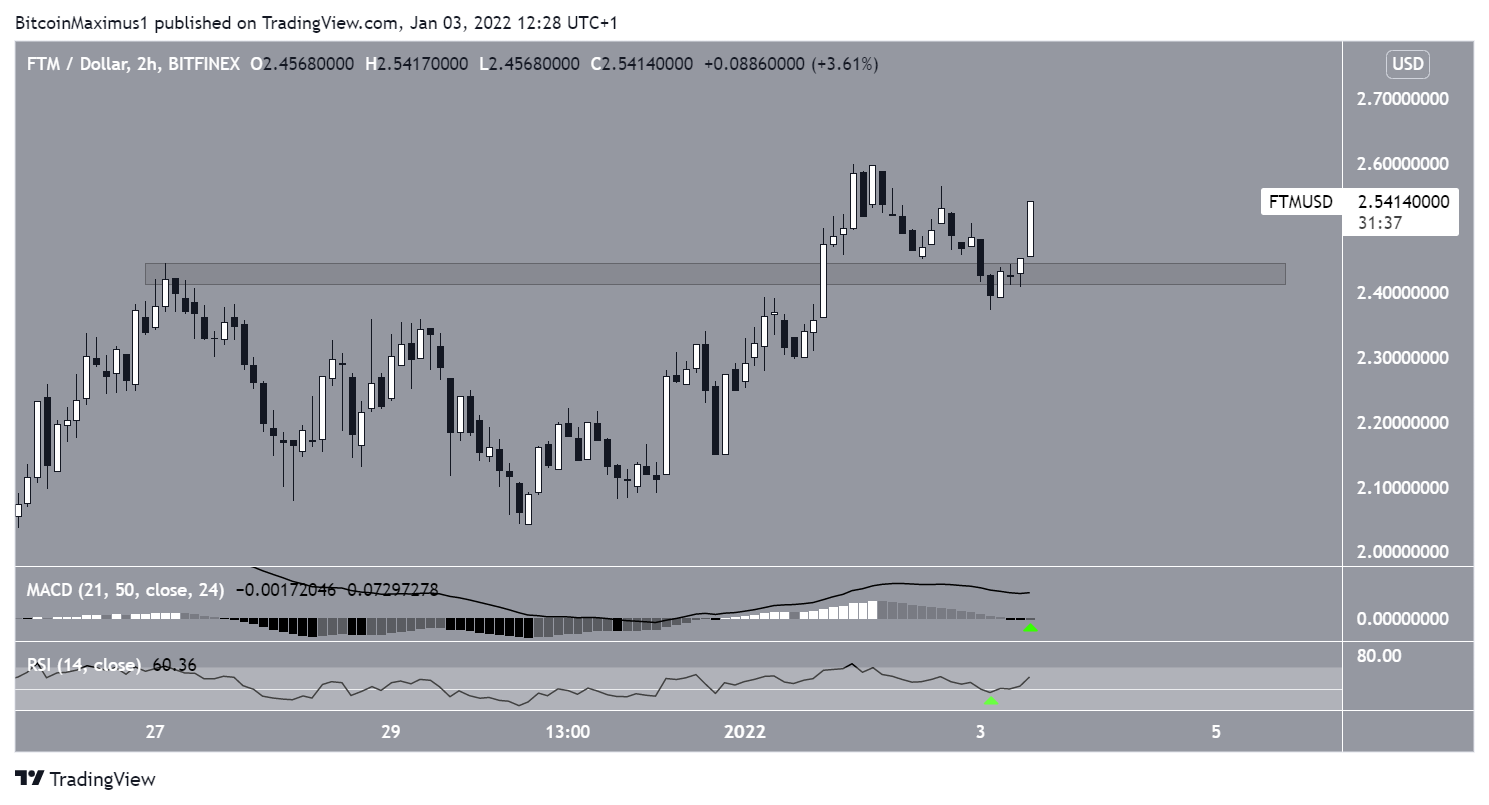
The two-hour chart supports these findings.
FTM has reclaimed the $2.45 area, which previously acted as resistance. Afterwards, it bounced above it on Jan 3, validating it as support.
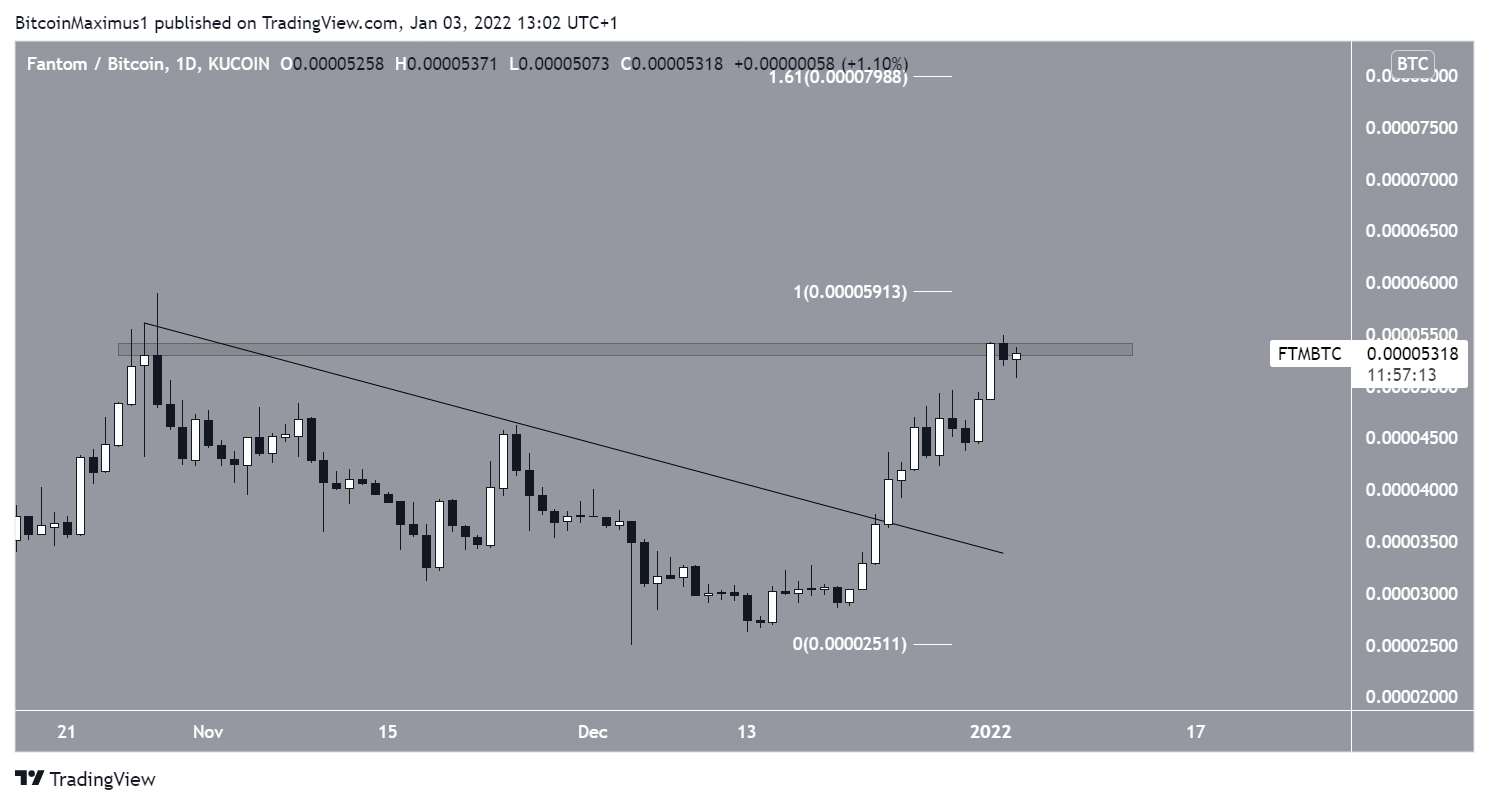
FTM/BTC
Similarly, the FTM/BTC pair has been increasing since breaking out from a descending resistance line on Dec 24. While it did not reach a new all-time high, the Jan 1 close (green icon) was the highest daily close in history.
Once it manages to move above the 5400 satoshi resistance area, FTM is likely to go to a new all-time high price.
The next resistance area would be at 8000 satoshis, created by the 1.61 external Fib retracement resistance level.