


The Ethereum price has been trading inside a descending wedge for more than a year. Previous history and technical indicators suggest that it will soon break out and begin a new upward move.
The Ethereum (ETH) network is in preparation for the biggest update in its history, the switch to Ethereum 2.0. This is expected to occur in 2020, after the Istanbul hard fork. The update will change the network from a proof-of-Work to a Proof-of-Stake, where validators will approve all transactions.
However, the Ethereum price decreased significantly over the past week, following the lead set by the Bitcoin price. Market analyst and trader CryptoWolf (@IamCryptoWolf) suggested that the Ethereum and Bitcoin prices are possibly following a very similar cycle. Currently, Ethereum is in a similar position to where Bitcoin was in 2012.
Ethereum cycle I looks like Bitcoin cycle I.
5k is pessimistic, more probably 10k. pic.twitter.com/k4c6zW6NcW— Wolf 🐺 (@IamCryptoWolf) November 28, 2019
If so, he suggested that Ethereum will reach $10,000. Will the price get there? Continue reading below in order to find out.
For those of you interested in a video analysis, please click below:
RSI Pattern
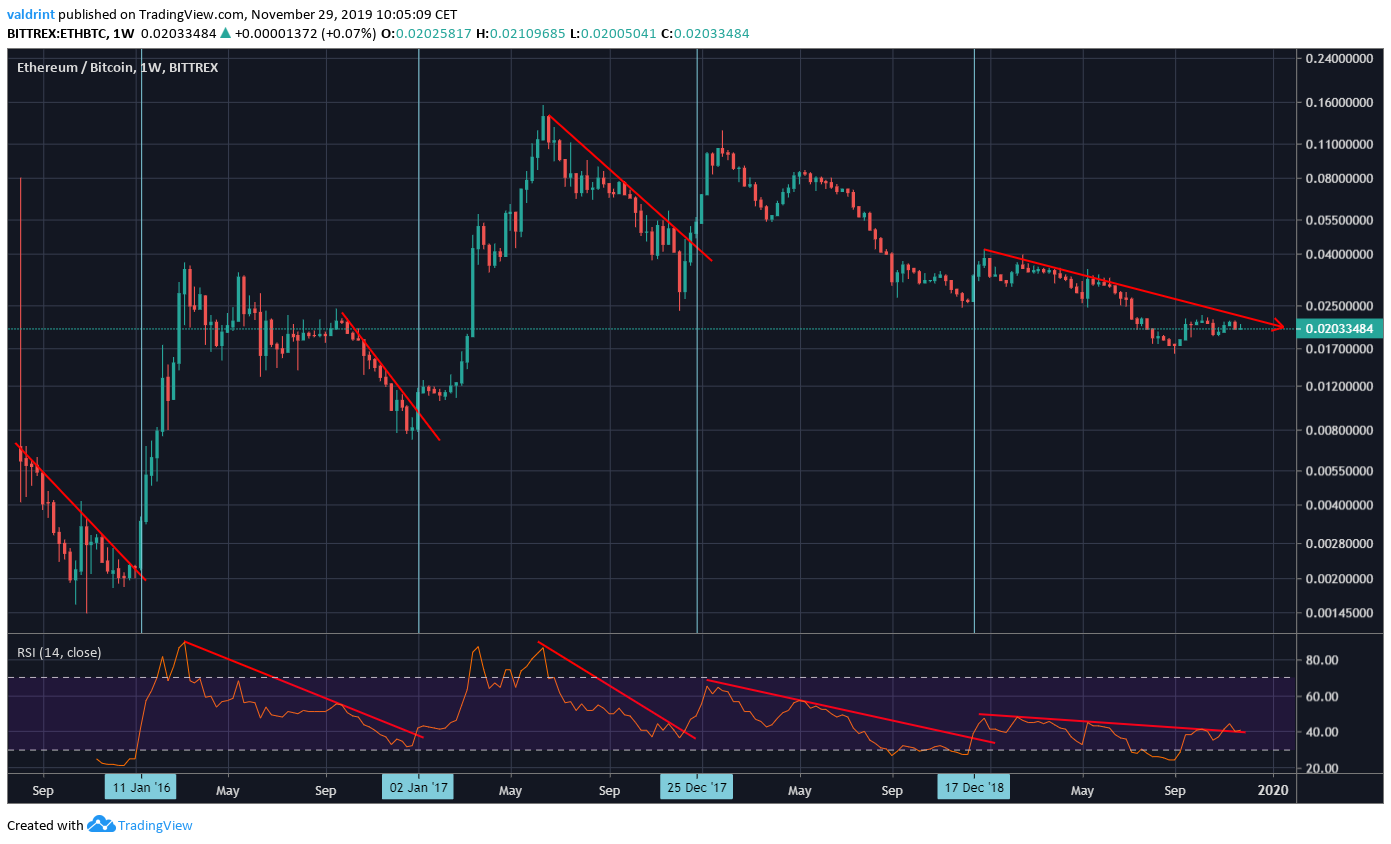
Looking at Ethereum’s price history, we can see an interesting development that has been occurring every year.
- An upward cycle of a different magnitude has always begun in December/January.
- This was preceded by a breakout above the resistance trend-line of the weekly RSI.
- Slightly after the RSI break, the price broke out above a significant resistance area and began an upward trend.
Currently, the RSI trend has been broken, while the price resistance is still intact. If it is broken, we could see an upward move similar to what transpired over the previous years.
Ethereum Descending Wedge
Looking closer at the pattern, we can see a developing descending wedge that has been in place since December 2018.
Additionally, there is a very strong bullish divergence in both the weekly RSI and the MACD. Since the descending wedge is considered a bullish pattern and divergence is present in such a high time-frame, we are expecting a breakout.
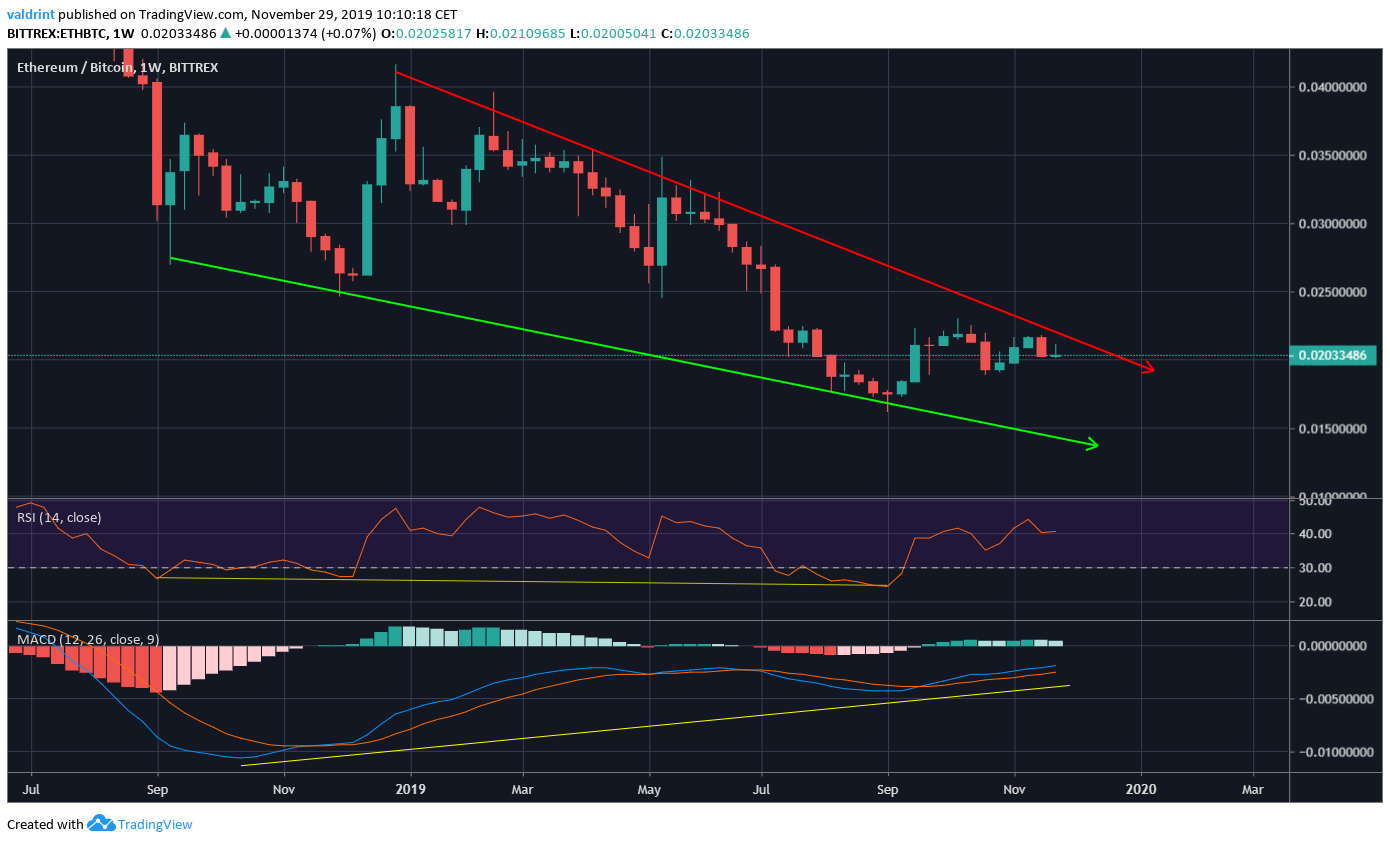
Since the price has been trading inside its current pattern for more than a year, it would be normal for a significant upward move to follow.
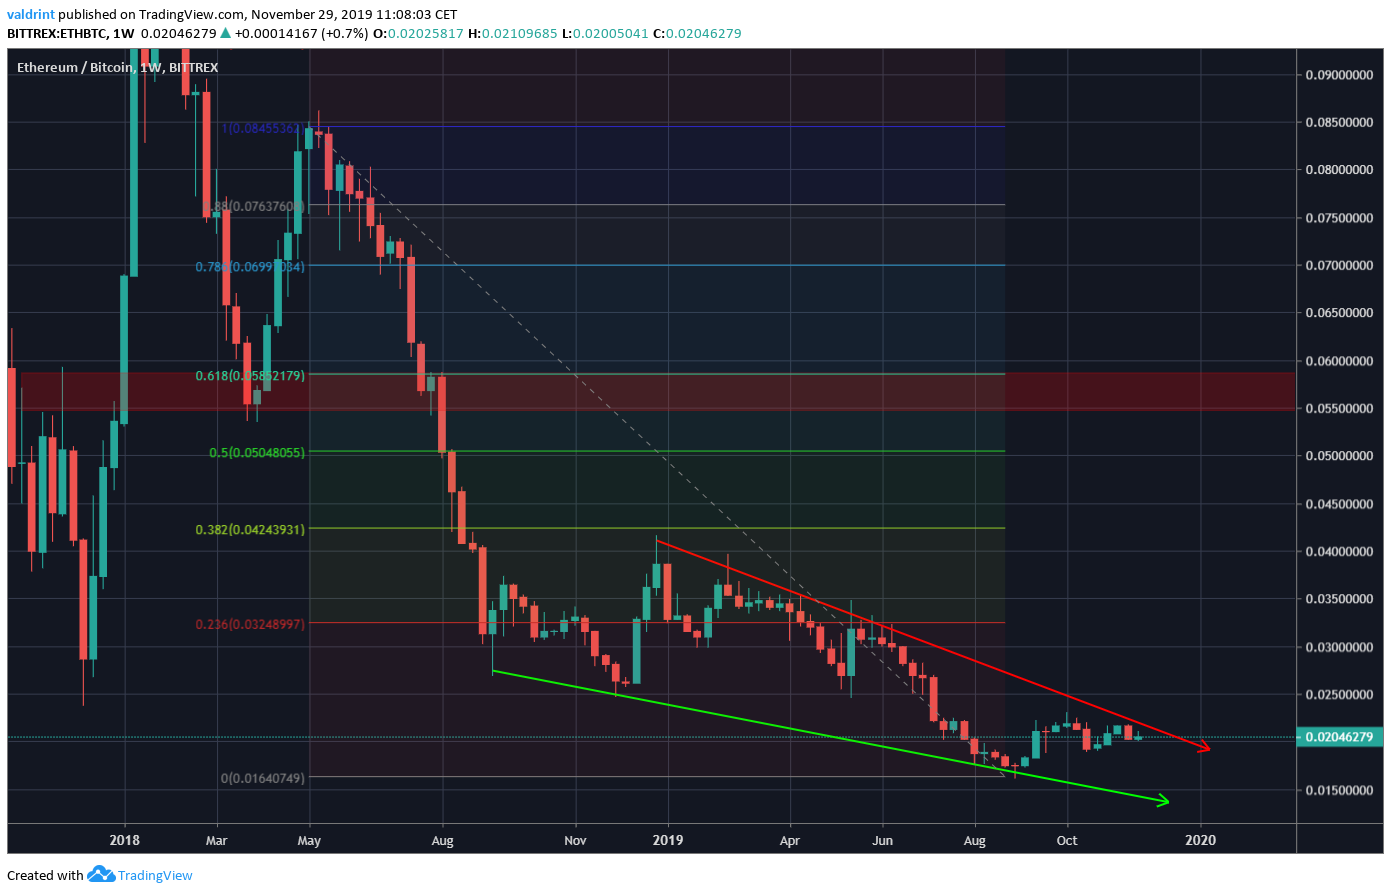
The bare minimum for the increase would be ₿0.055. This level corresponds with the 0.618 fib level of the previous downward move and has previously acted as support, before the price flipped it as resistance.
To conclude, after a long period of consolidation, Ethereum looks primed for an eventual breakout. This hypothesis is supported by both technical indicators and previous price movement.
Disclaimer: This article is not trading advice and should not be construed as such. Always consult a trained financial professional before investing in cryptocurrencies, as the market is particularly volatile.
