

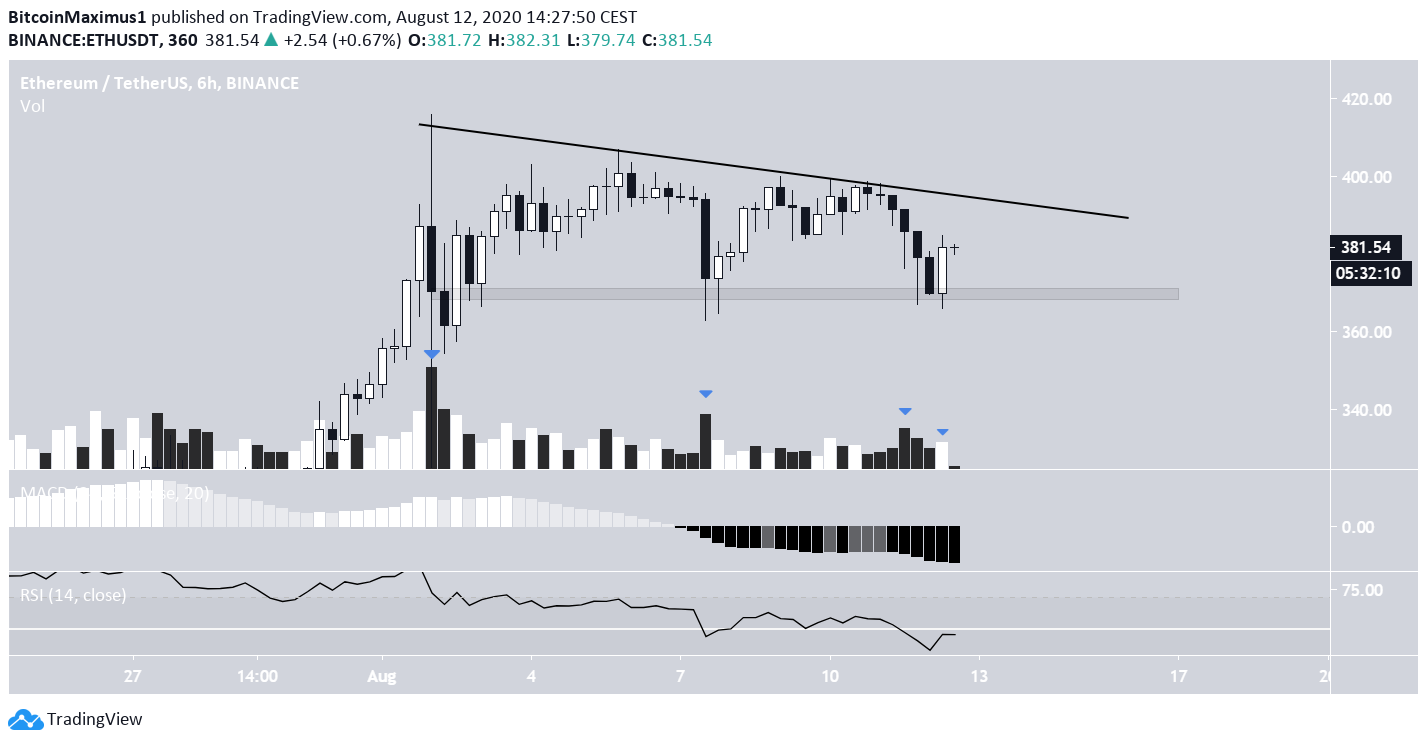
The Ethereum (ETH) price has been declining since reaching a high of $416 on August 2. While it has made several attempts to move upwards, they’ve been generally weak, creating multiple bearish divergences.
It’s possible that ETH has reached a top and a corrective period will soon ensue.
Long-Term Resistance Levels
The Ethereum price has been increasing since March 13. During the week of July 27 – August 4, the price rallied to close above $366, which is the 0.382 Fib level from the entire decline that began in April 2019. If the price successfully confirms this level as support, the next resistance area would be found between the 0.5 – 0.618 Fib levels, at $455 – $544. If the current move is an upwards correction with regards to the previous downward move, the rally should end near this level. Technical indicators on the weekly time-frame are still bullish. Both the MACD and RSI are increasing, and there is no bearish divergence yet. However, the latter has reached the overbought zone, indicating that the move is overextended, and the upside could be limited.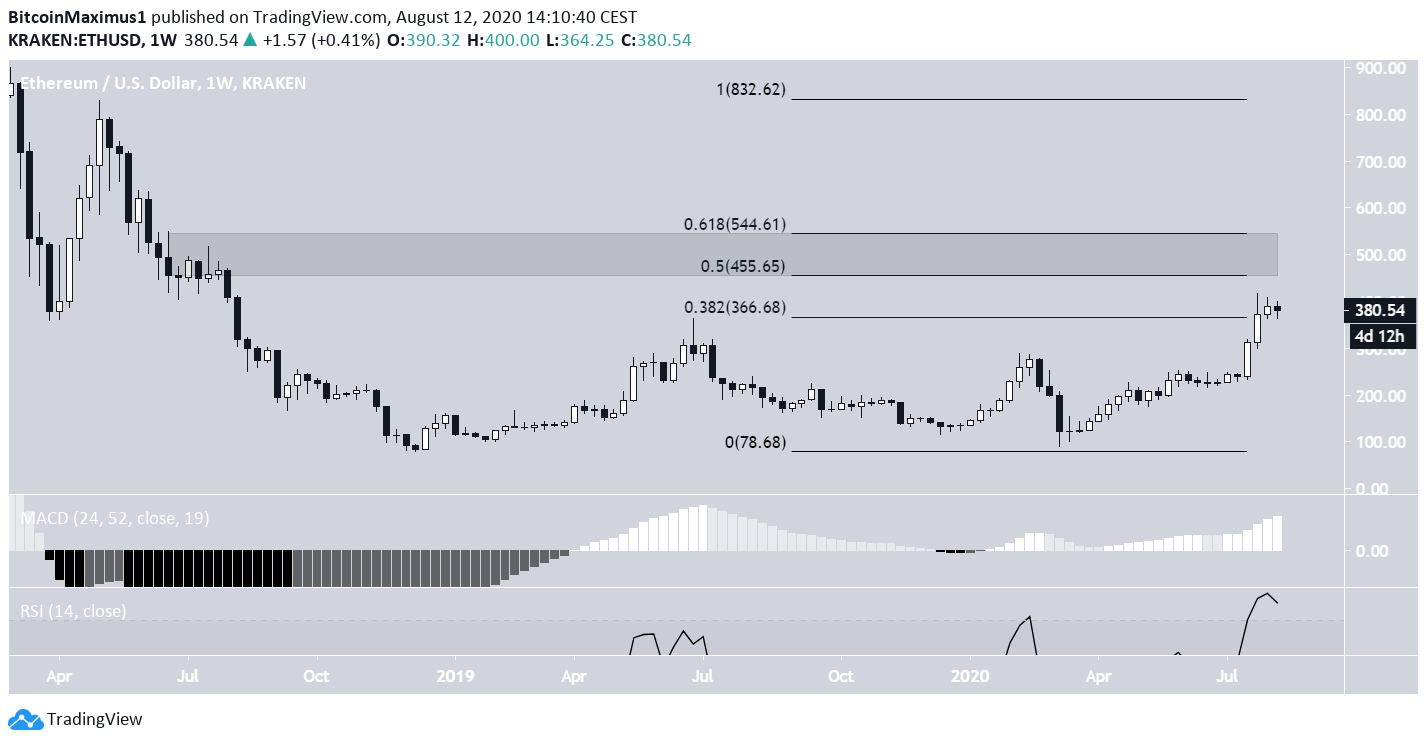
Time For a Retracement?
Despite the bullishness on the longer-term time-frames, the daily chart shows considerable weakness. After creating a long-legged doji on August 2, the Ethereum price has since formed bearish divergence on the RSI. In addition, the MACD has begun to fall, indicating a decrease in the bullish momentum. This is a sign that the rally is coming to an end. If the price begins to fall, The closest support levels would be found at $316, $292, and $258, the 0.5, 0.618, and 0.786 Fib levels of the entire upward move. The 0.5 and 0.786 levels are also supported by the 50 and 200-day moving averages (MA), respectively. A daily close below $372, which was the close on August 2, would indicate that the price has begun its correction.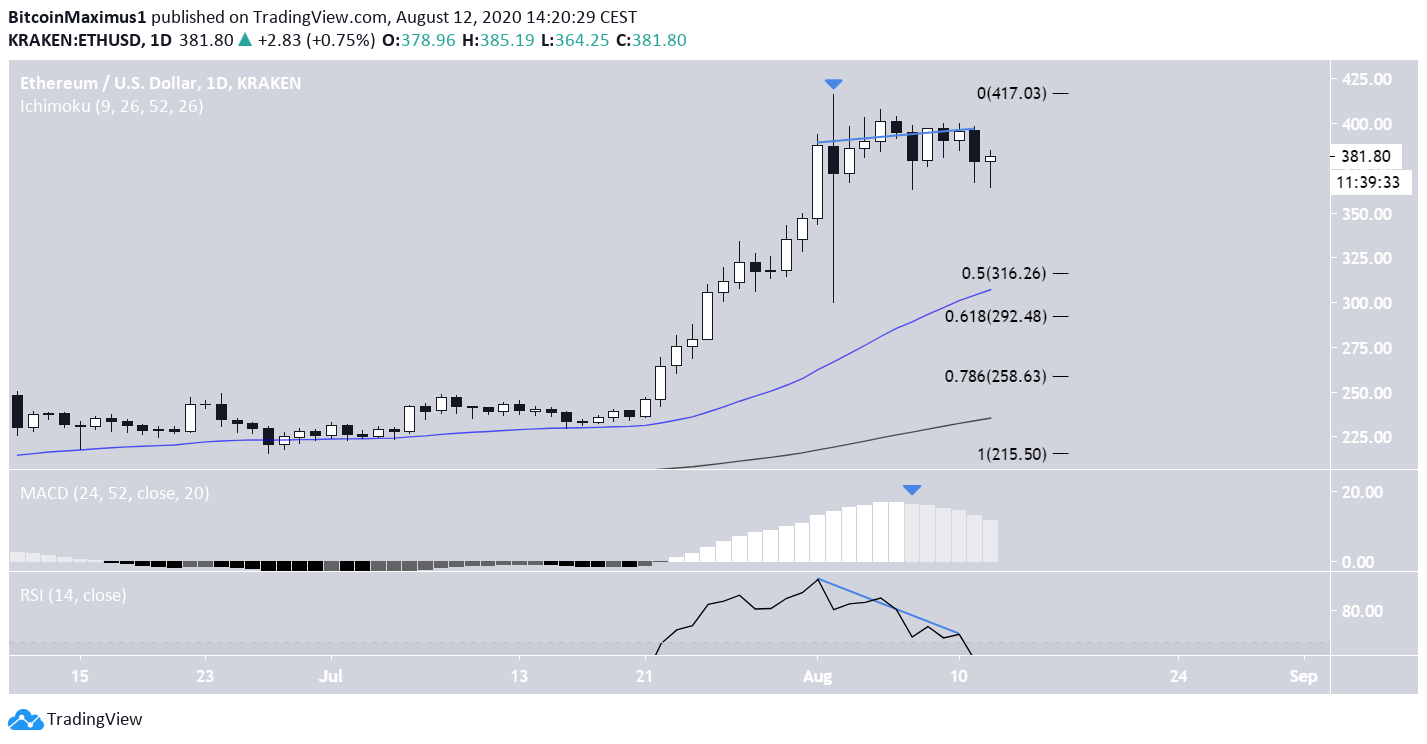
Ethereum Wave Count
As for the wave count, the price has likely begun a five-wave impulsive pattern formed at the beginning of March. It currently seems to be in the fifth and final wave (black). The fifth wave has become extended, and can be outlined with five sub-waves inside it (blue). Furthermore, the fifth sub-wave has also become extended, containing another five sub-waves inside (brown). Whenever a wave extends, the same numbered sub-wave inside it can also extend, so this isn’t unusual. The August 2 top was extremely close to the 1.618 Fib level of waves 1 – 3, so it’s a likely place for the move to end. Furthermore, it is close to the 0.382 Fib of the entire upward move (as outlined in the first section), and the multiple divergences support the creation of a top. A daily close above $400 would invalidate this particular wave count.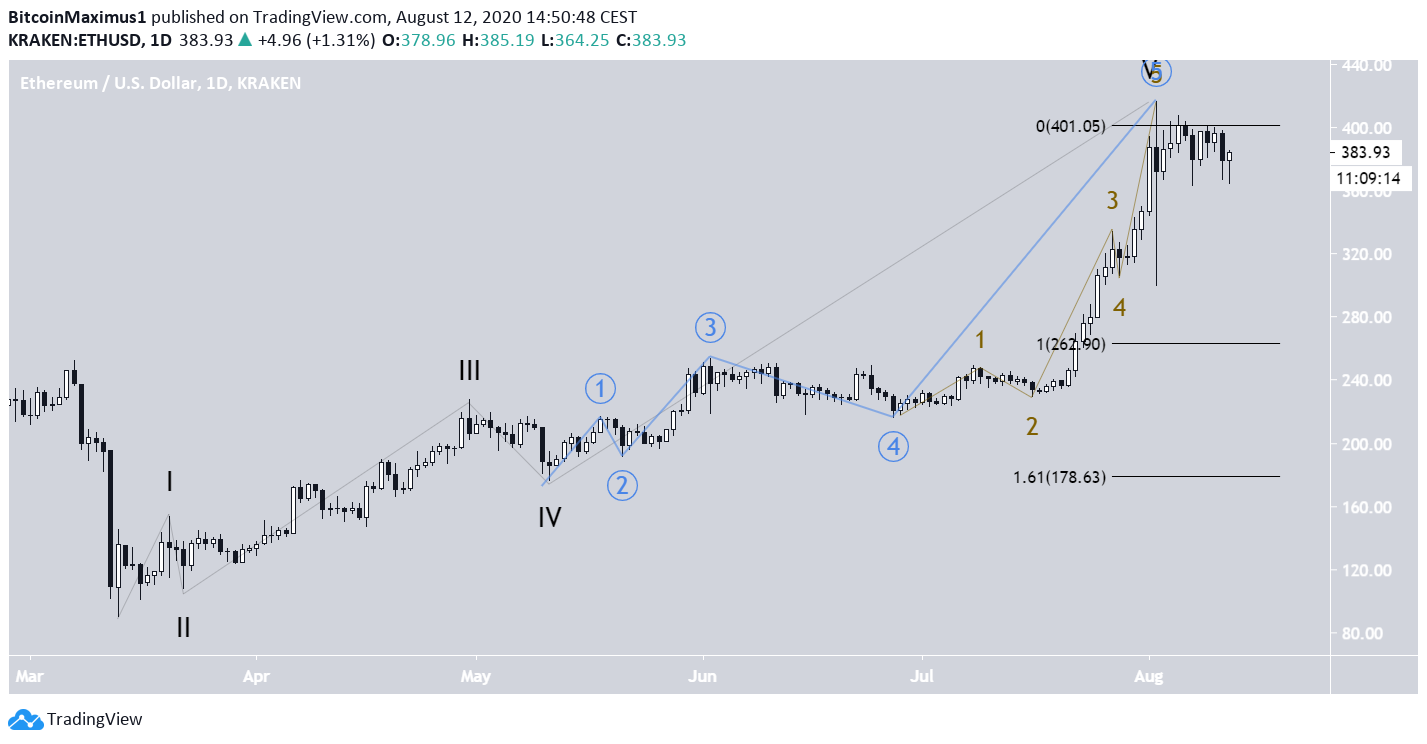
Top crypto platforms in the US
Disclaimer
In line with the Trust Project guidelines, this price analysis article is for informational purposes only and should not be considered financial or investment advice. BeInCrypto is committed to accurate, unbiased reporting, but market conditions are subject to change without notice. Always conduct your own research and consult with a professional before making any financial decisions. Please note that our Terms and Conditions, Privacy Policy, and Disclaimers have been updated.

Valdrin Tahiri
Valdrin discovered cryptocurrencies while he was getting his MSc in Financial Markets from the Barcelona School of Economics. Shortly after graduating, he began writing for several different cryptocurrency related websites as a freelancer before eventually taking on the role of BeInCrypto's Senior Analyst.
(I do not have a discord and will not contact you first there. Beware of scammers)
READ FULL BIO
Sponsored
Sponsored