The Ethereum (ETH) price is trading inside an important resistance area. A breakout above this level could trigger a rapid rally.
Note: This article will focus on the ETH/BTC pair. For the ETH/USD pair, click here.
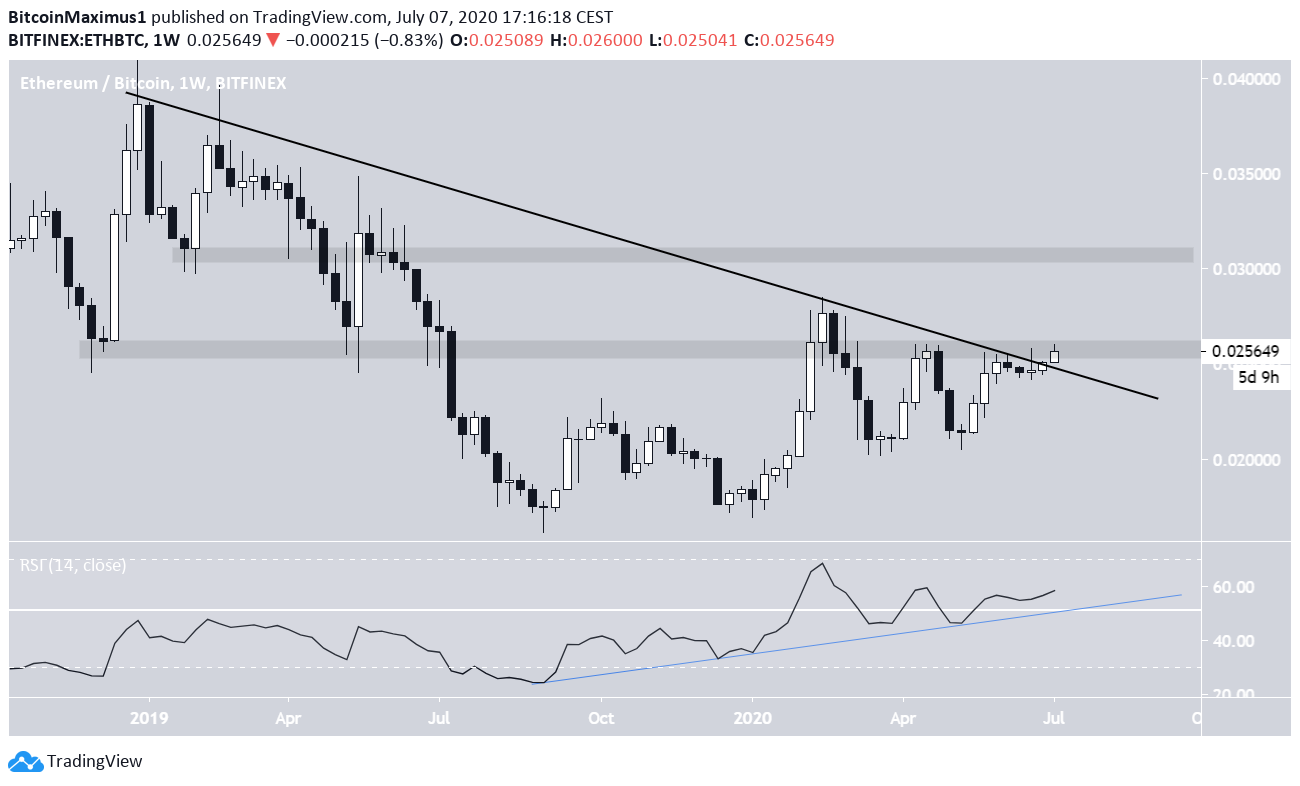
The Ethereum price has possibly been following a descending resistance line since January 2019. The line has been validated four times until now, and the price is currently in the process of breaking out.
Ethereum Long-Term Resistance
ETH is still trading inside the ₿0.0259 resistance area. Until it breaks out above it and confirms it as support, the price movement cannot be considered bullish. If successful, the price could move towards the next resistance area at ₿0.0305.
The weekly RSI is following an ascending support line, which could be a good measure of the trend of Ethereum. As long as the support line is not broken, the long-term trend for ETH can remain bullish.
Cryptocurrency trader @VinnyVo44 stated that the Ethereum price is likely to continue its ascent towards ₿0.03 and even possibly ₿0.035. The first target coincides with our closest resistance area.
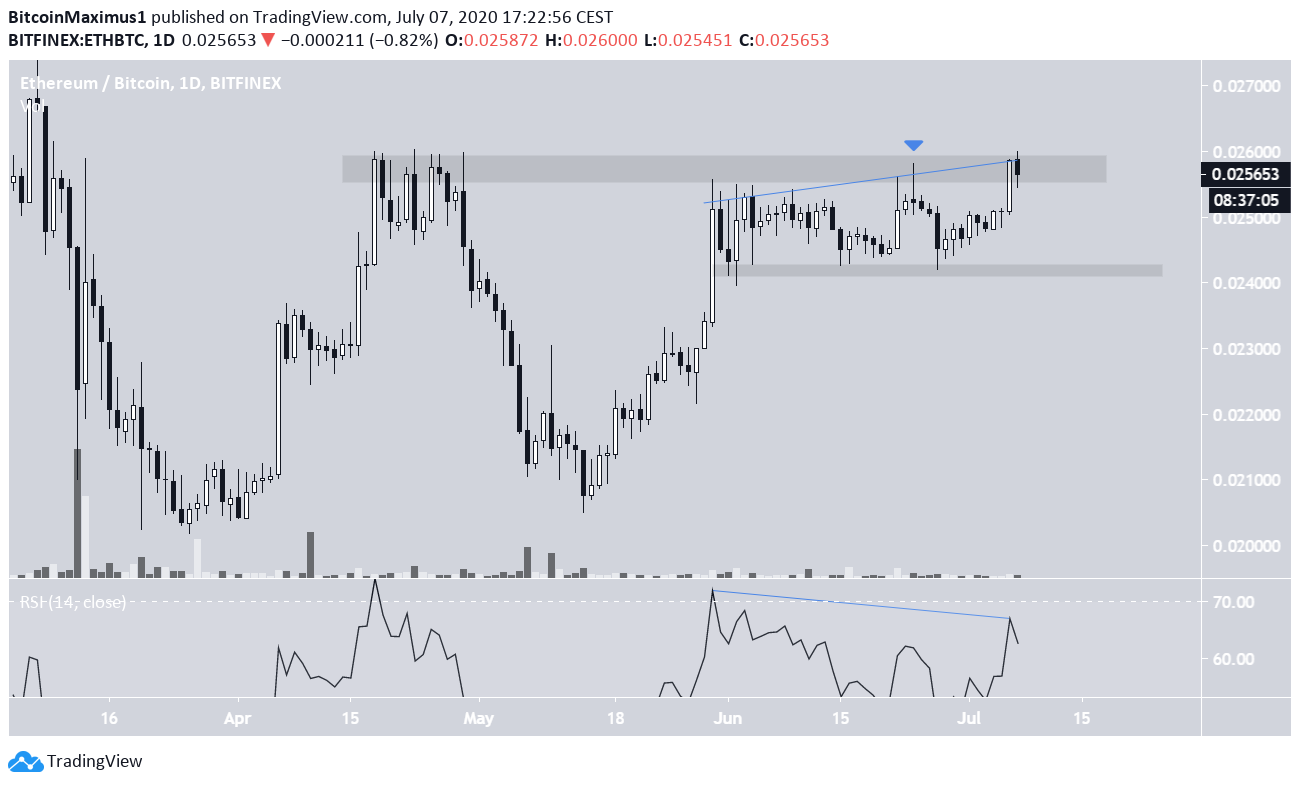
Trading Range
In the daily chart, we can see resistance and support at ₿0.0259 and ₿0.0242, respectively.
The price initially respected the resistance area by creating several long upper-wicks, culminating with a shooting star on June 25. It created a bullish engulfing candlestick yesterday, purportedly breaking out above this resistance.
However, there is a bearish divergence developing in the RSI, indicating that the price might not be successful in breaking out above this resistance area.
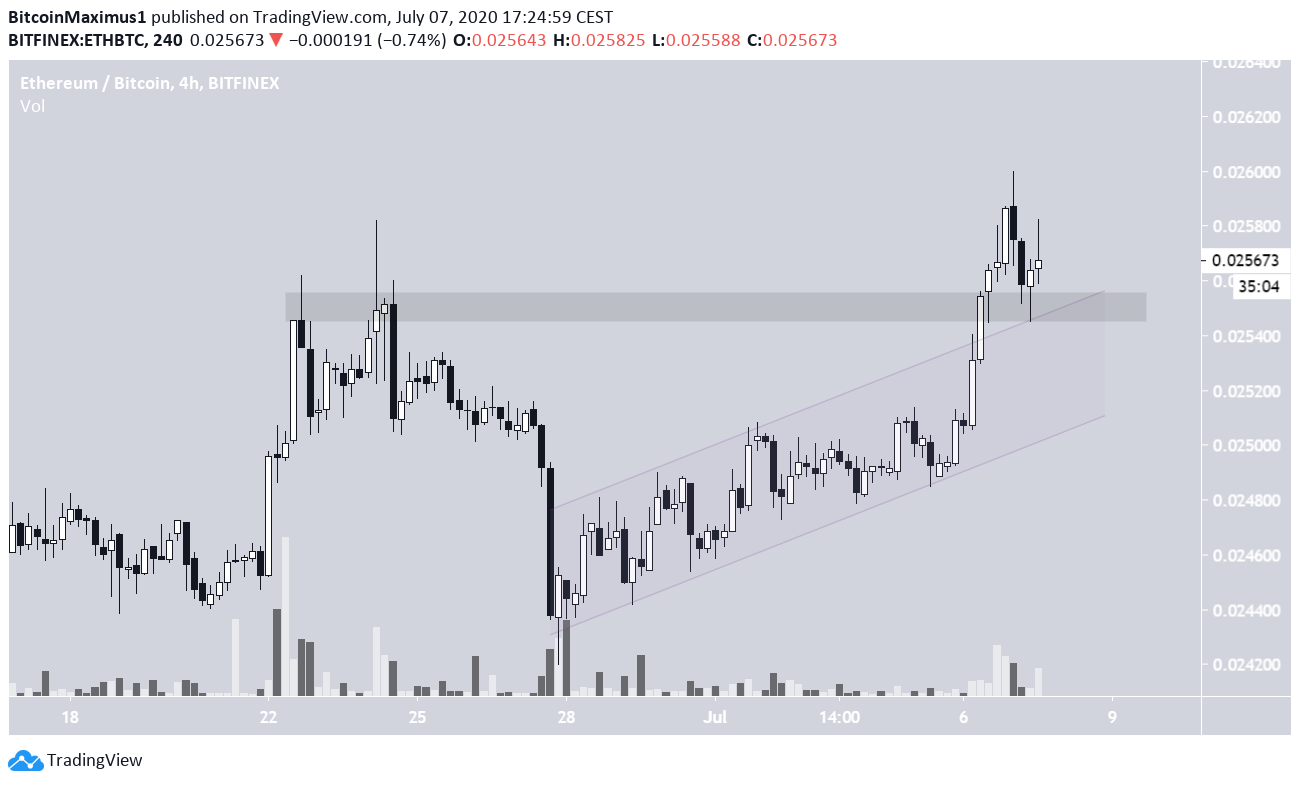
Short-Term Breakout
The hourly chart provides a bullish picture. Ethereum has broken out from an ascending channel and afterward reclaimed the previous resistance area at ₿0.0255 as support. ETH has also validated the resistance line of the channel as support.
If Ethereum manages to stay above the ₿0.0255 area, it would be expected to continue its upward movement towards ₿0.0305.
On the other hand, a decrease below this level would indicate that the previous breakout was not legitimate and would likely fall towards the ₿0.0242 support.