


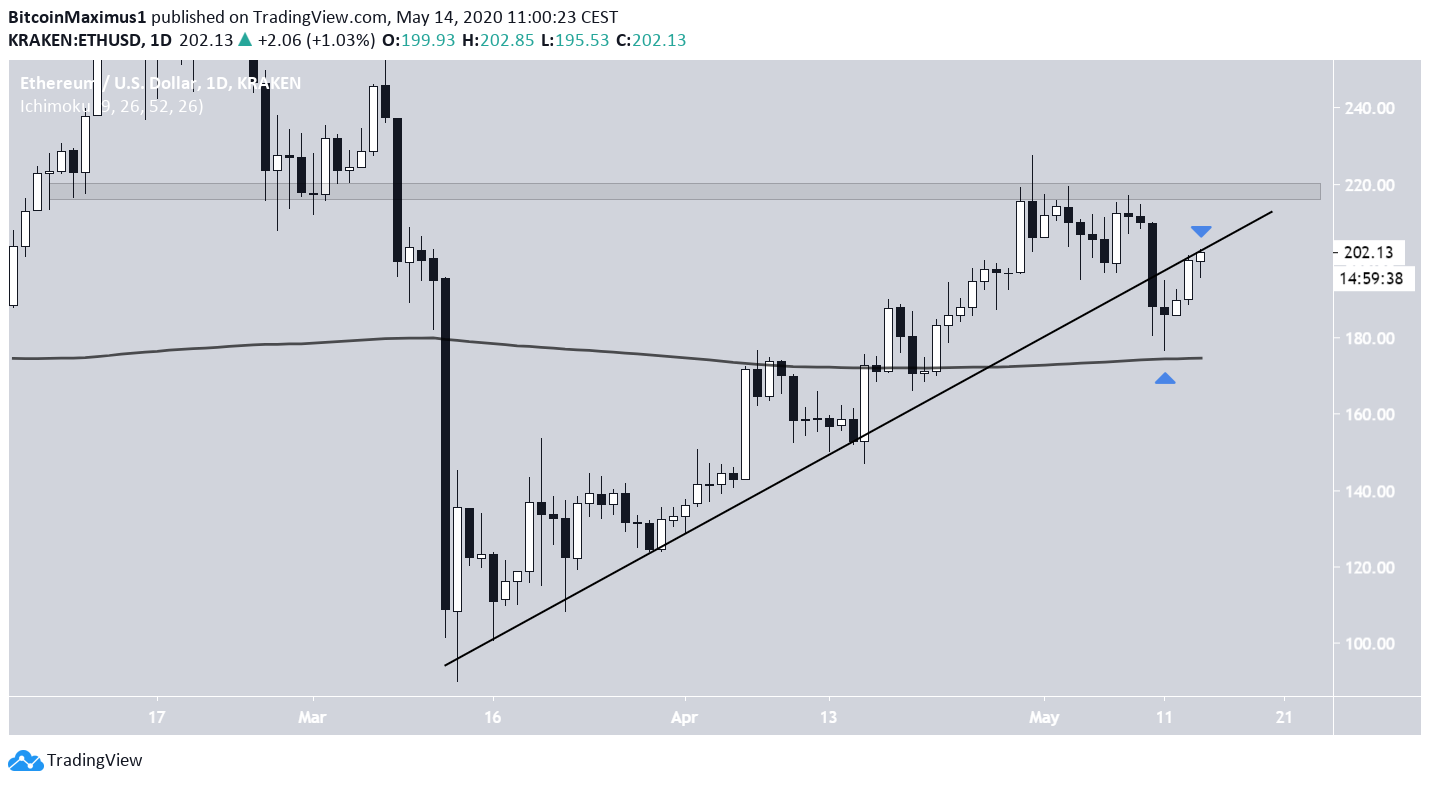
The Ethereum price has been decreasing under a descending resistance line since April 30, when it reached a high of $227. The downturn really began to accelerate on May 8.
On May 10, the Ethereum price broke down from an ascending support line that it had been following since the bottom on March 10. Since then, it has validated this level as resistance.
Well-known cryptocurrency trader @PostyXBT outlined an Ethereum chart that shows a bearish development for the price. Posty stated,
Time to short? If BTC gets rejected at resistance the chances of this happening increases.
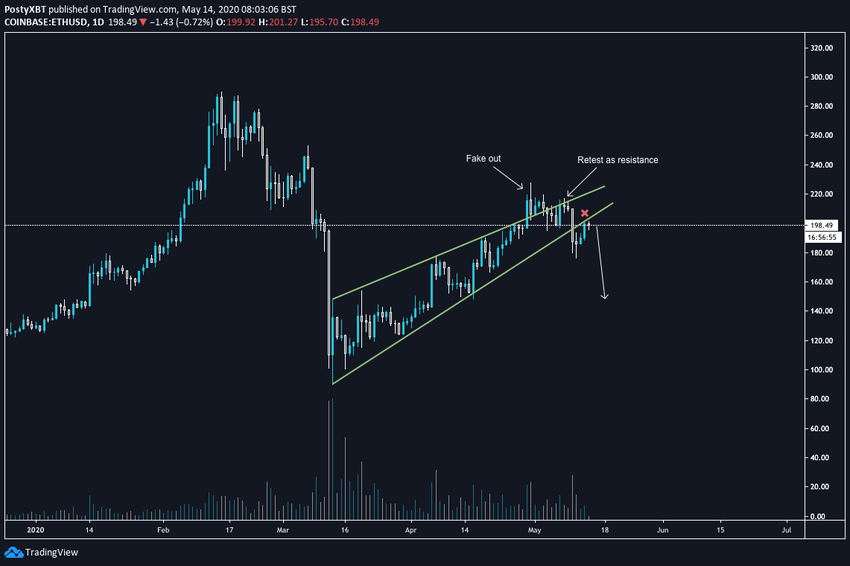
Ethereum’s Ascending Support Line
On May 10, the Ethereum price broke down from the ascending support line it had been following since March 13. A breakout from such a long-term support line often indicates that the ongoing trend has ended.
In addition, prior to the breakout, the price was strongly rejected by the $220 level. The price found support above the 200-day moving average (MA) and returned to validate the support line as resistance. This is a very common movement that indicates that the price will soon continue its downward trend.
A breakdown below the 200-day MA would confirm that the correction has begun.
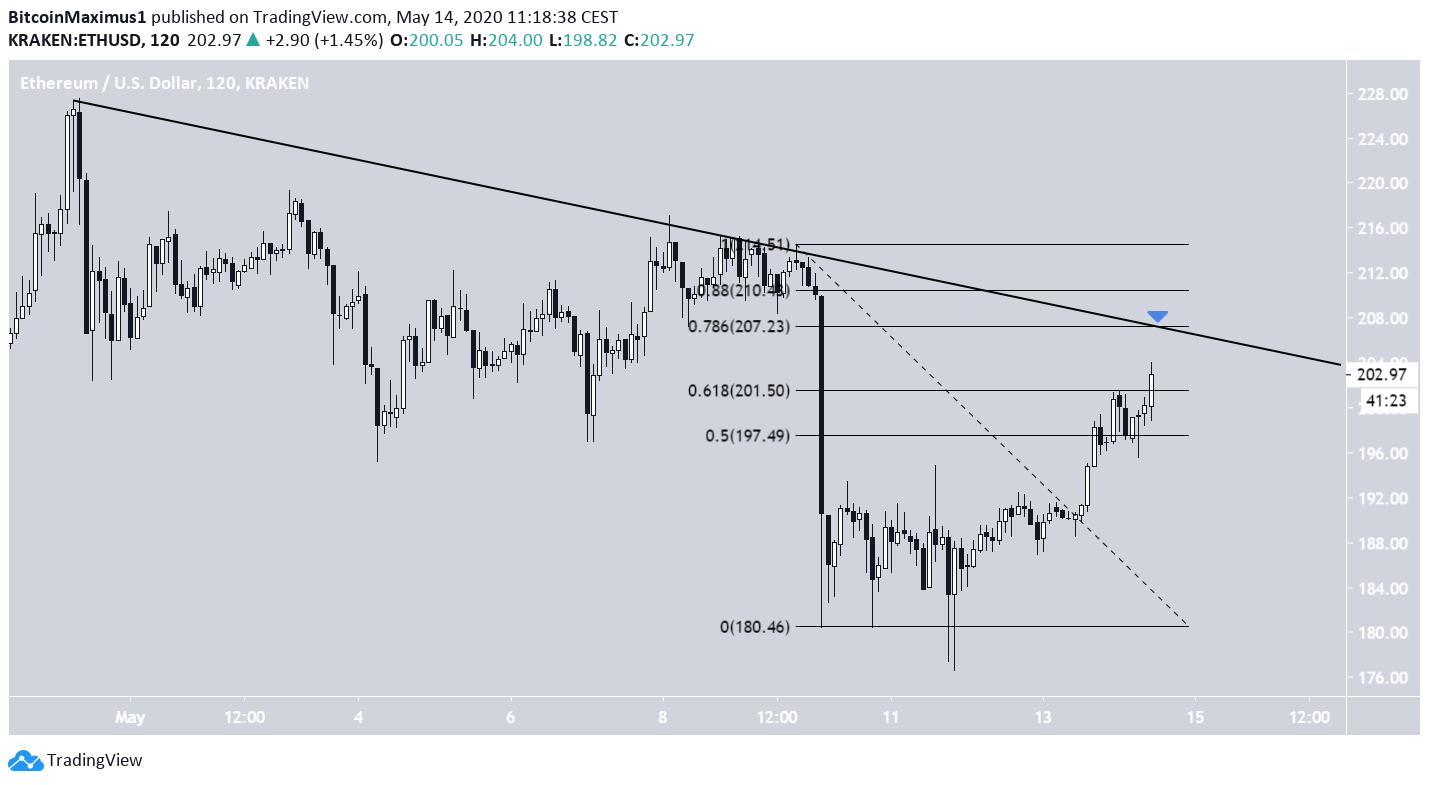
Retracement Levels
When looking at a shorter-term chart, we can see that the price is following a descending resistance line, and has been doing so since the aforementioned April 30 high. At the time of writing, the price was very close to validating this line for the third time.
In addition, its resistance coincides with the 0.786 Fibonacci level of the entire decrease. This makes for a very likely place for a reversal in the form of a decrease towards the 200-day MA, as outlined in the previous section.
To conclude, the Ethereum price has broken down from an ascending support line and validated it as resistance afterward. Its outlook is considered bearish and the ongoing increase seems to be a validation of this support line as resistance rather than a new uptrend.


