
Ethereum came dangerously close to breaching the $3,000 mark, briefly dipping to $3,053 before bouncing back. The fall rattled the market, triggering liquidations and panic selling. But after weeks of steady decline, early signs of a rebound are finally starting to appear.
Despite being down 27% in the past month and 8.4% in the last 24 hours, both technical and on-chain data now hint that Ethereum may have formed a local bottom.
Early Rebound Setup Appears on the Charts
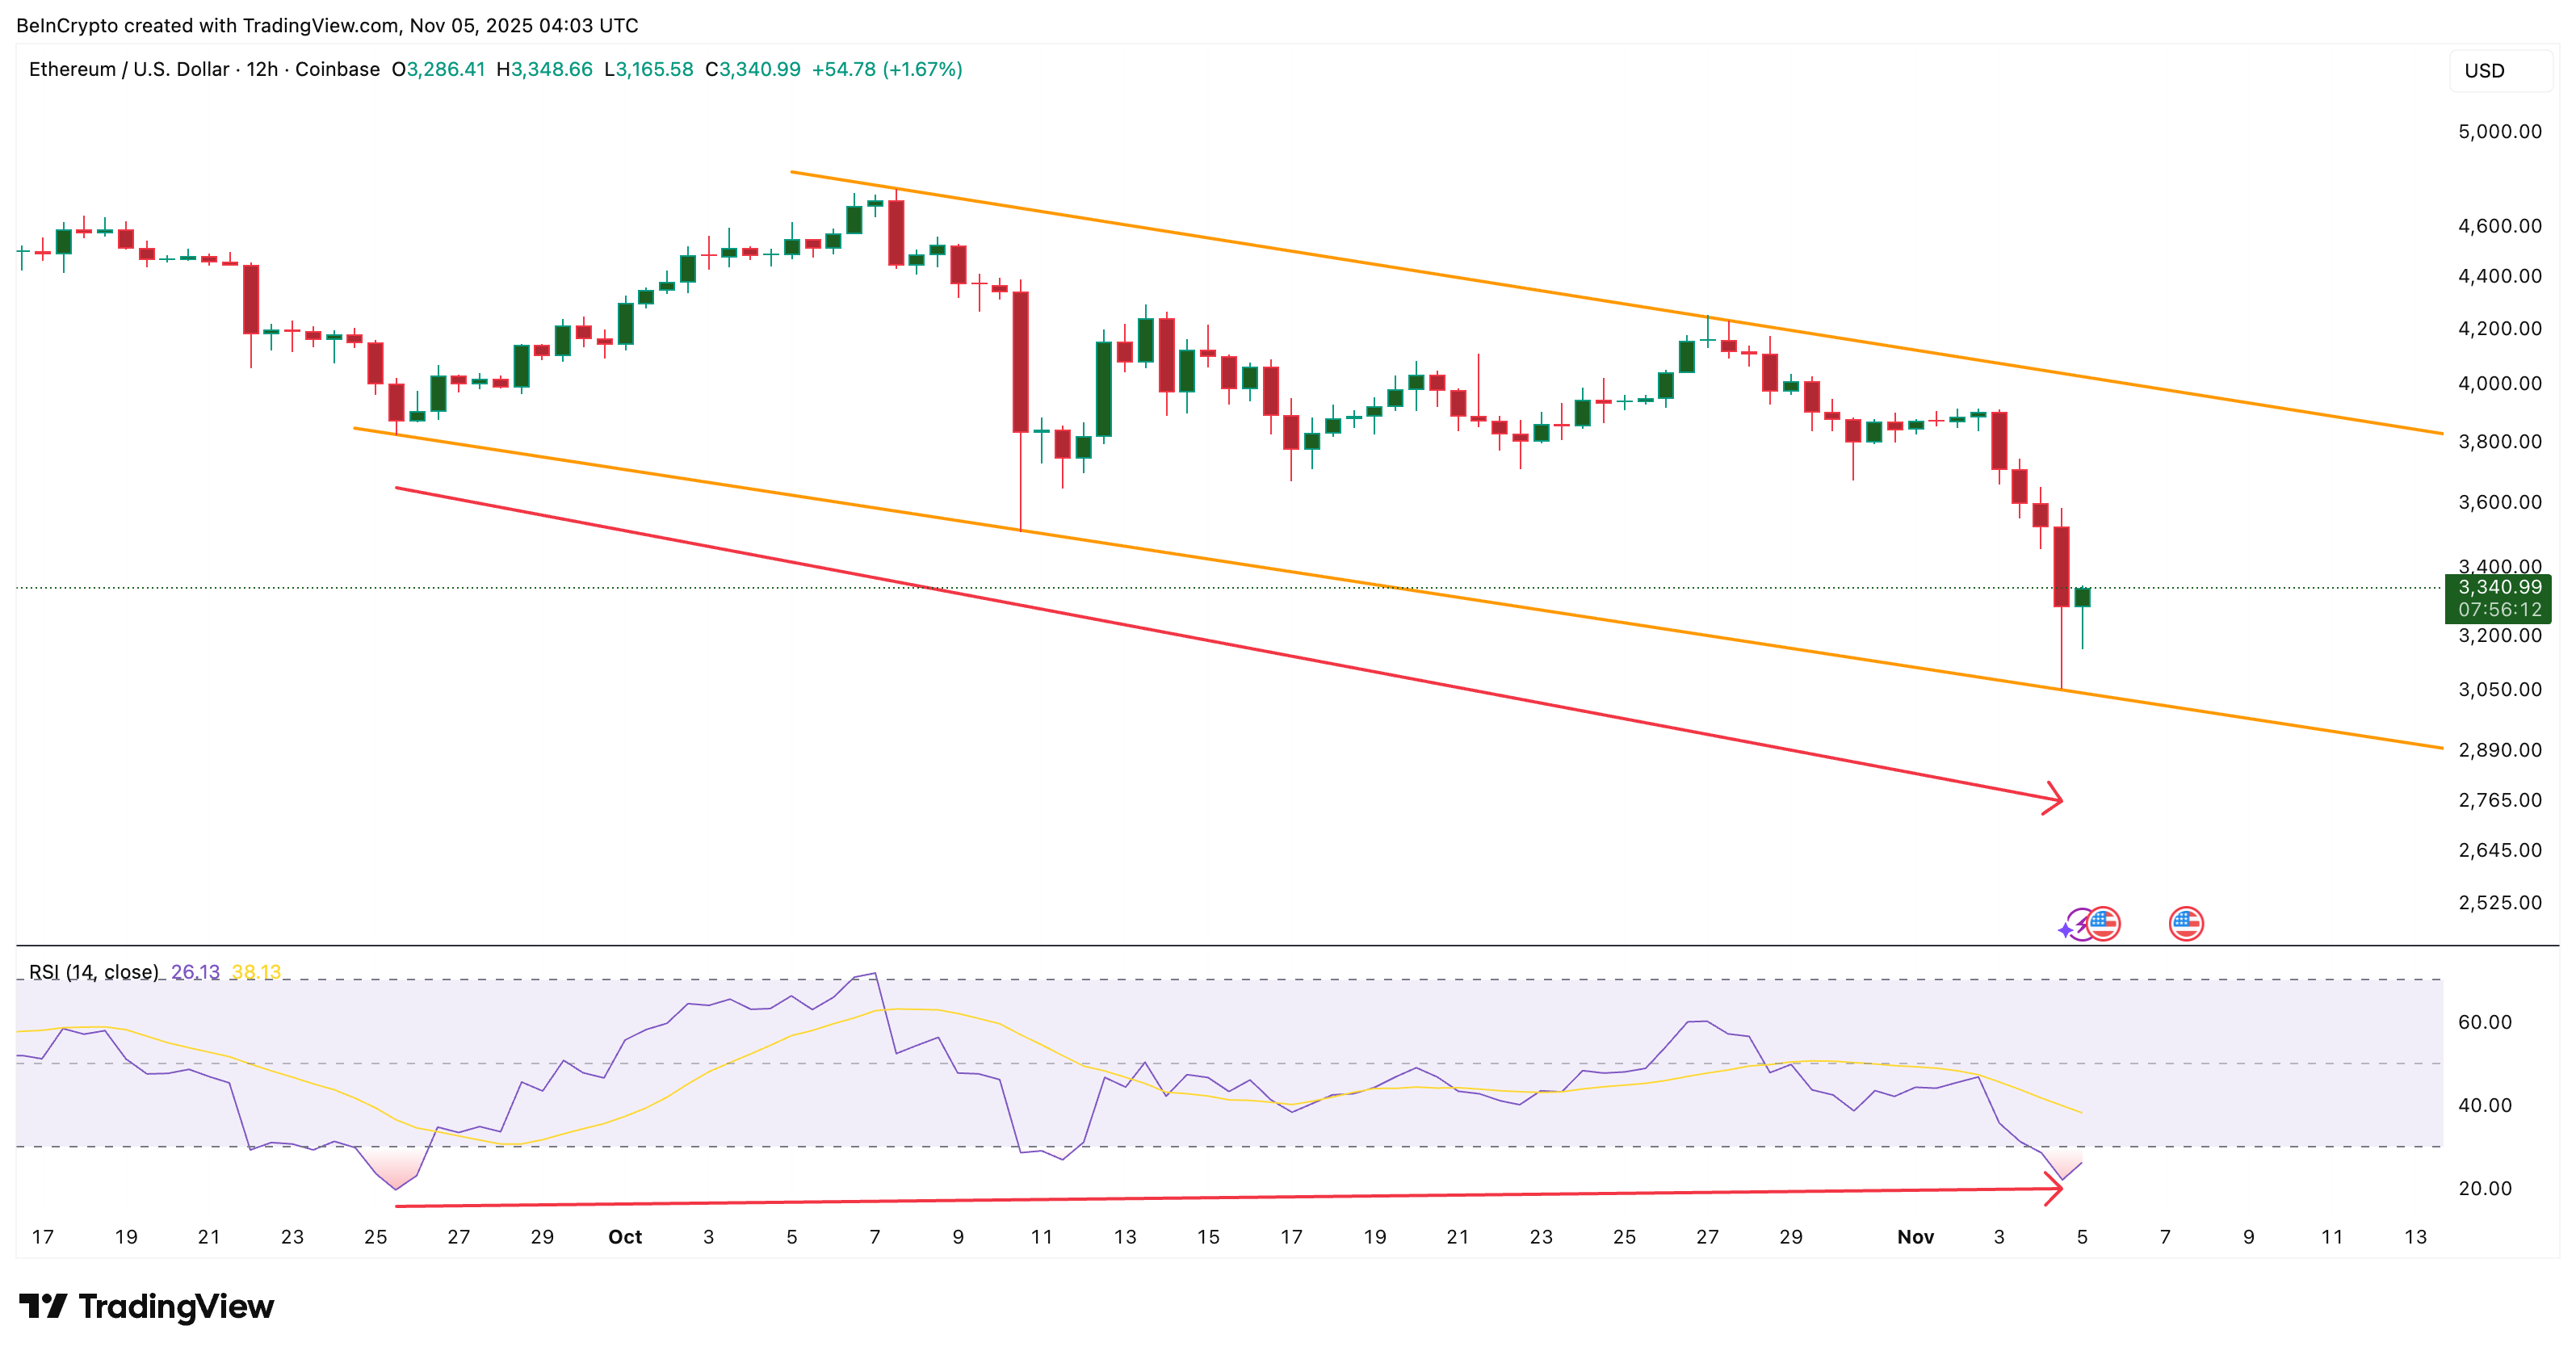
Ethereum’s price movement over the past few weeks shows that bearish momentum is slowing.
On the 12-hour chart, Ethereum’s Relative Strength Index (RSI), which measures price momentum to indicate whether an asset is overbought or oversold, has begun forming higher lows, even as the price made lower lows between September 25 and November 4.
Want more token insights like this? Sign up for Editor Harsh Notariya’s Daily Crypto Newsletter here.
This pattern is known as a bullish divergence, which typically signals that selling pressure is fading and a potential trend reversal or rebound may follow.
Since hitting a low of $3,053, the Ethereum price has already moved up 9%, at press time. That might mean the start of the rebound. However, it is still too early to say.
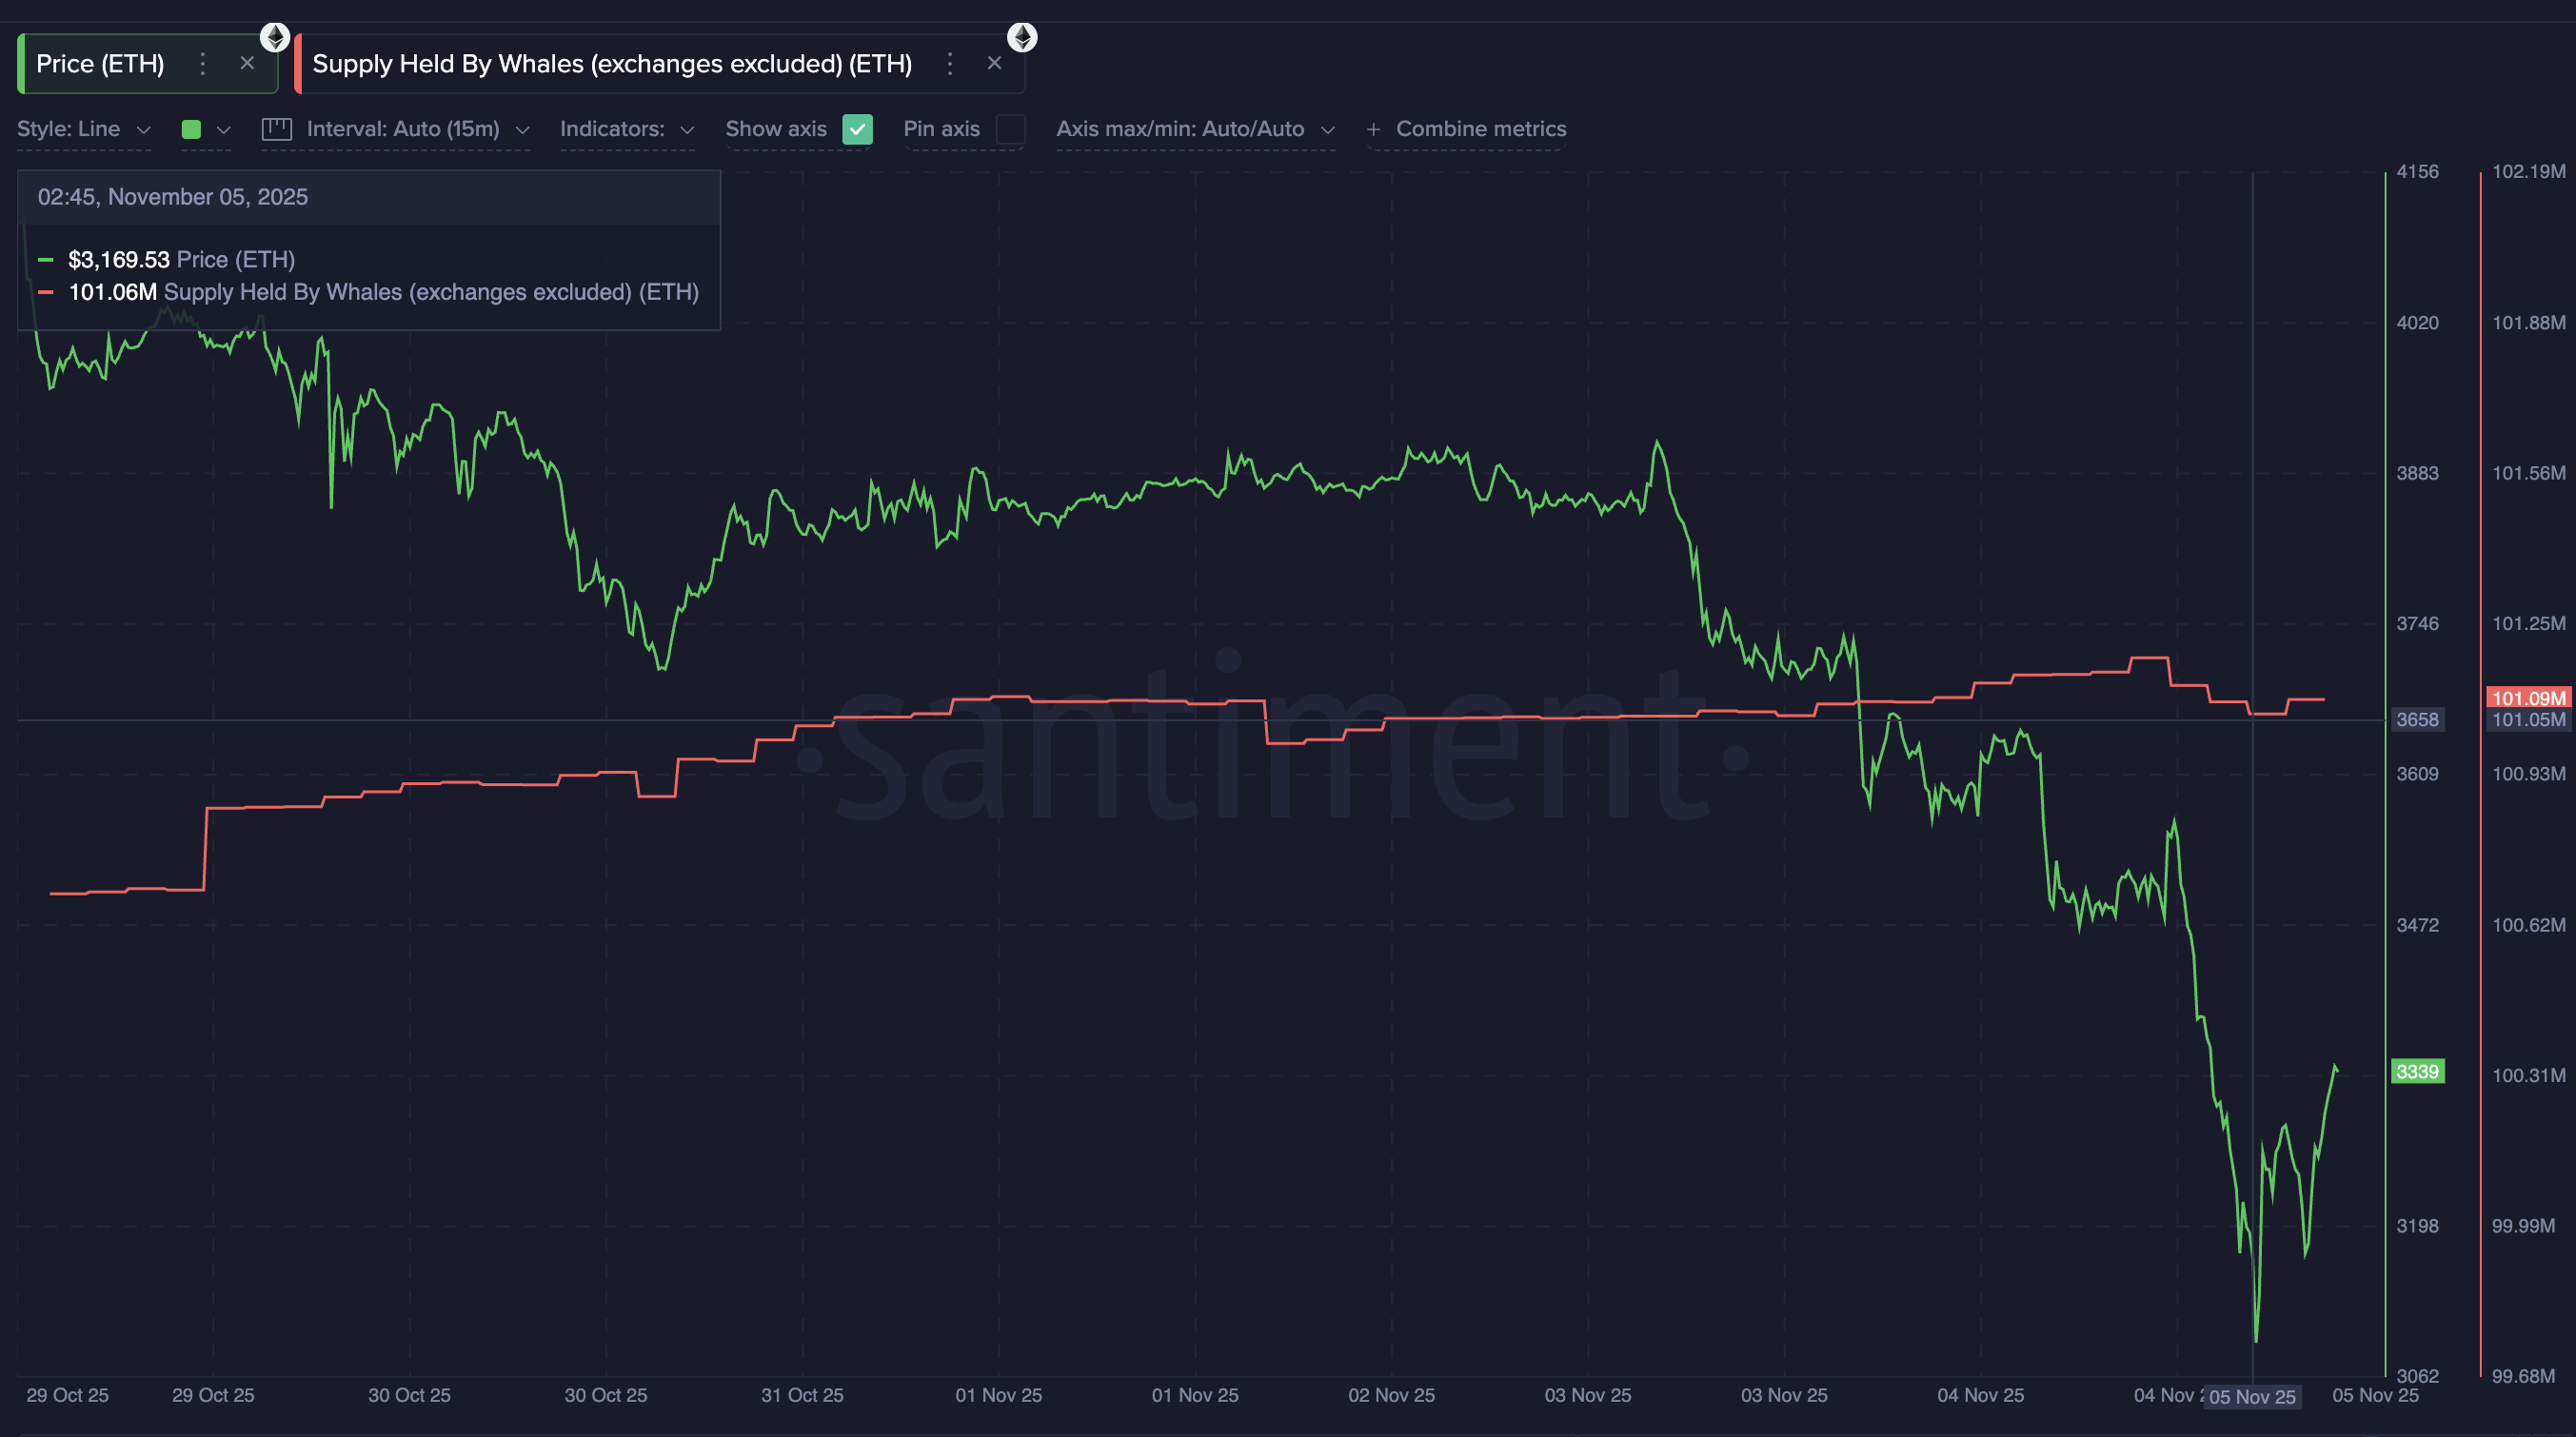
Supporting this setup, large wallet holders have begun to return quietly. Ethereum whales have increased their combined holdings from 101.05 million to 101.09 million ETH in just a few hours, adding around 0.04 million ETH, or $134 million at current prices.
It’s not an aggressive accumulation, but it’s a sign of renewed confidence after a sharp sell-off.
Meanwhile, the Net Unrealized Profit/Loss (NUPL) ratio, which measures how much profit or loss investors are still holding, has dropped to 0.27, its lowest level since July 7. When NUPL falls this low, it often means that most weak hands have exited at a loss, leaving behind determined holders.
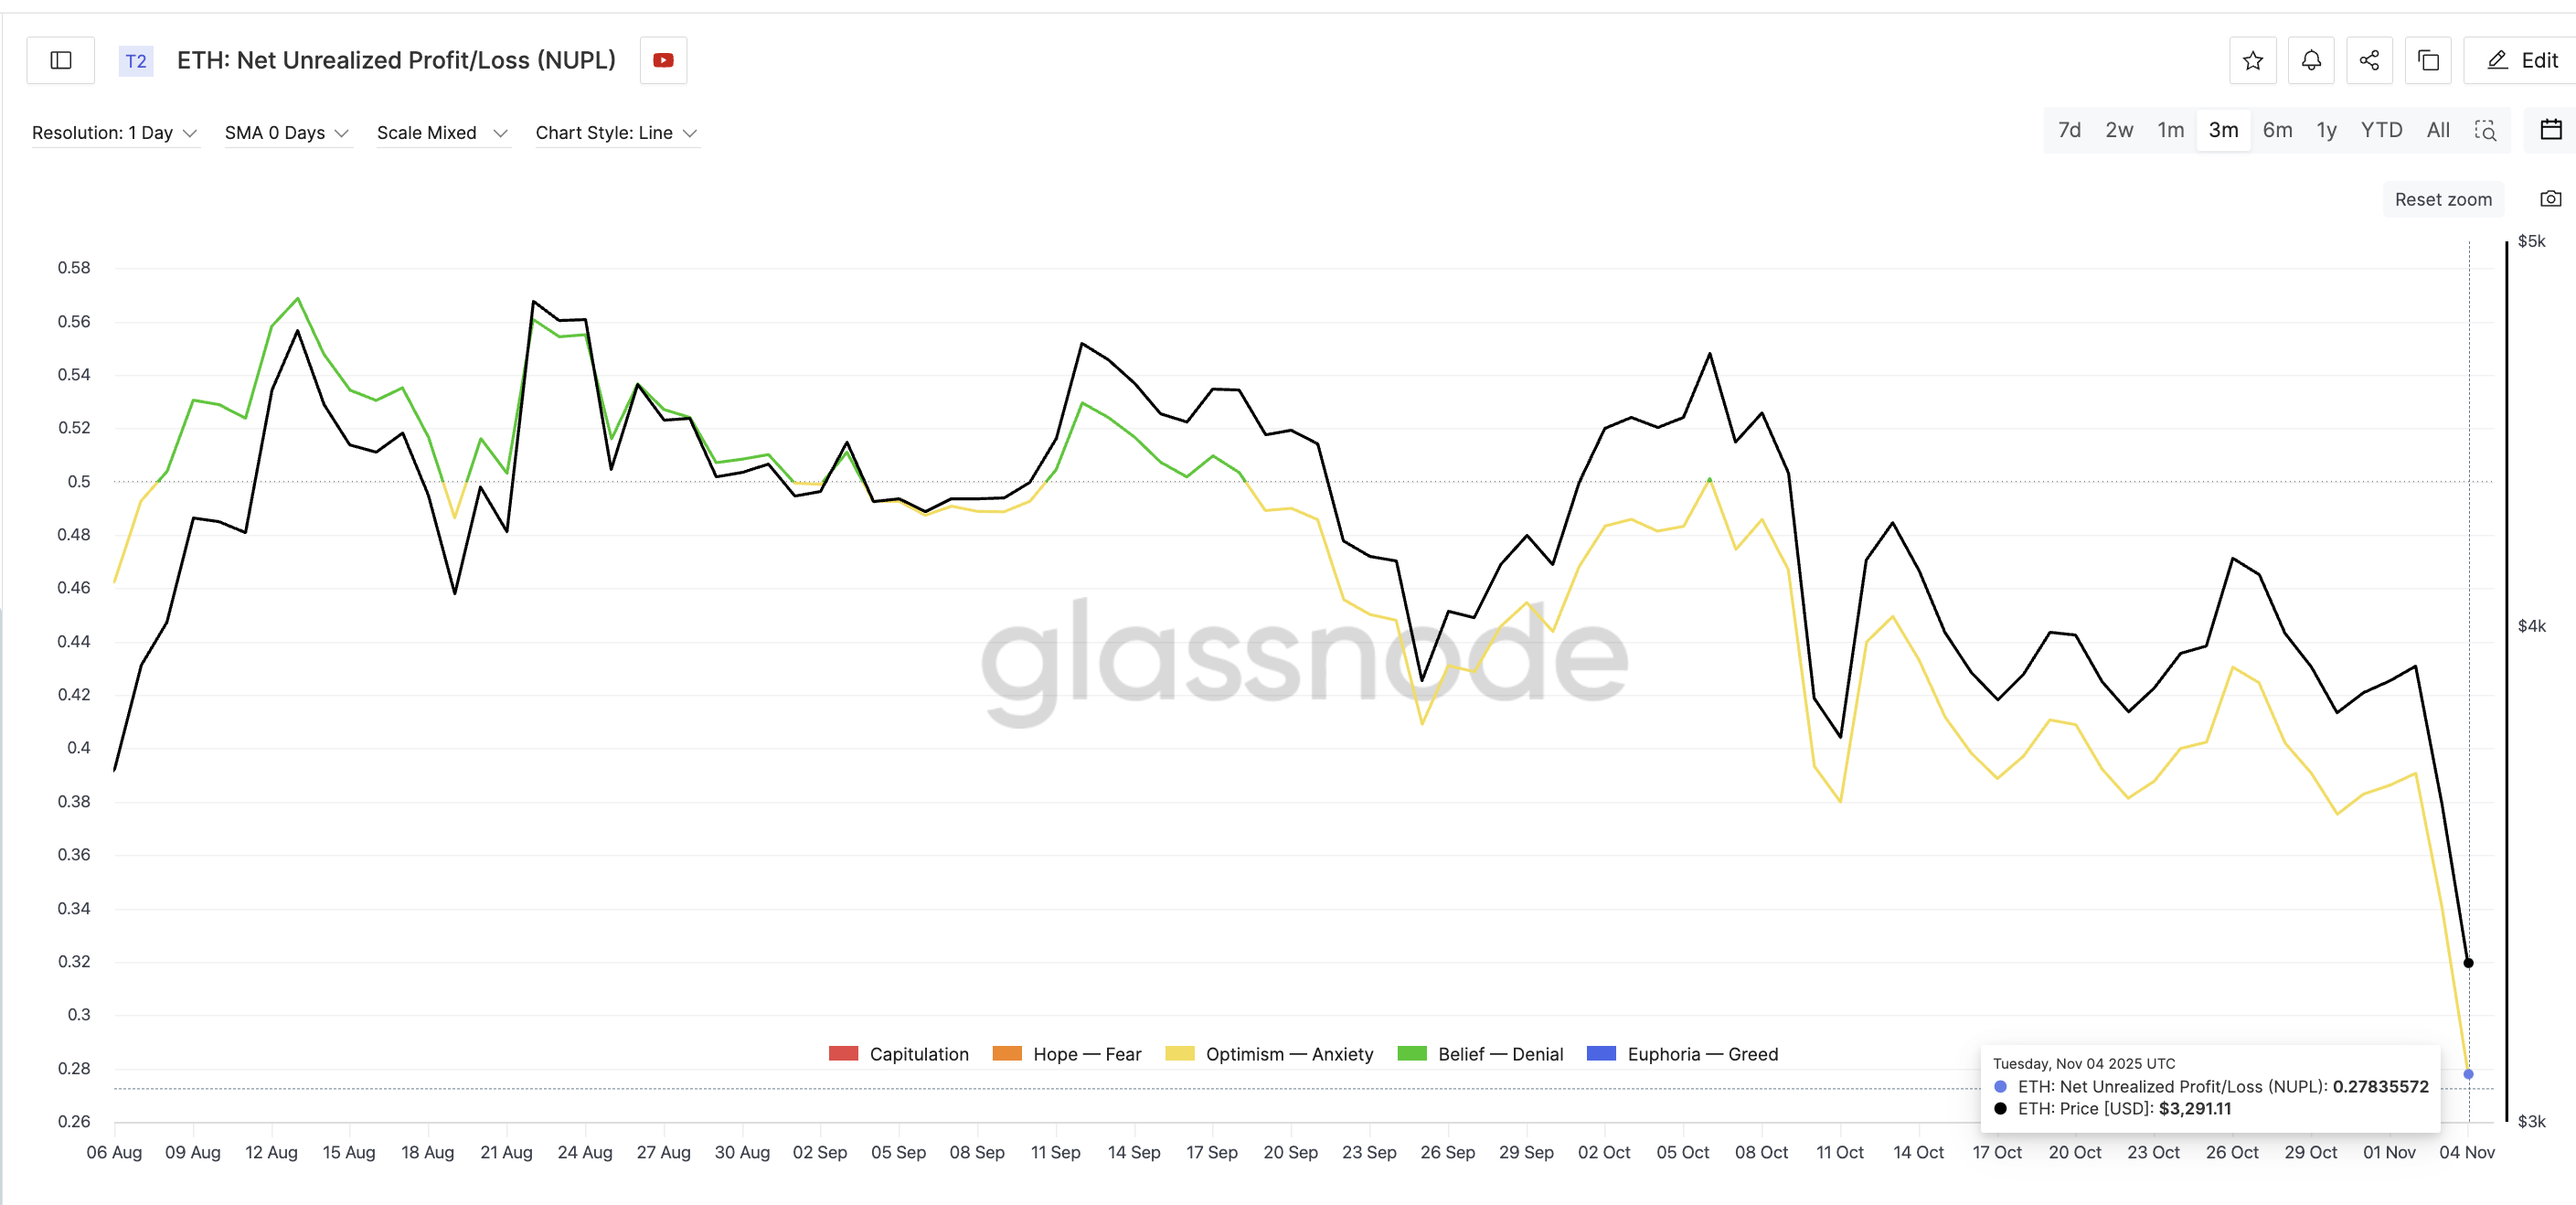
The last time this indicator dropped and formed a local bottom in mid-October, Ethereum rallied by more than 10% within two sessions, suggesting that the market may be repeating this behavior.
Derivatives Data Shows Pressure Building for a Short Ethereum Price Squeeze
Ethereum’s derivative markets also support the rebound case. According to Bybit’s ETH/USDT liquidation map, nearly $1.2 billion in short positions are now at risk between $3,320 and $3,740.
This is massive in comparison to just $330 million in long leverage. That imbalance — almost 3.5× more shorts than longs — suggests that any upward move could trigger a short squeeze, forcing short traders to buy back and accelerate price gains.
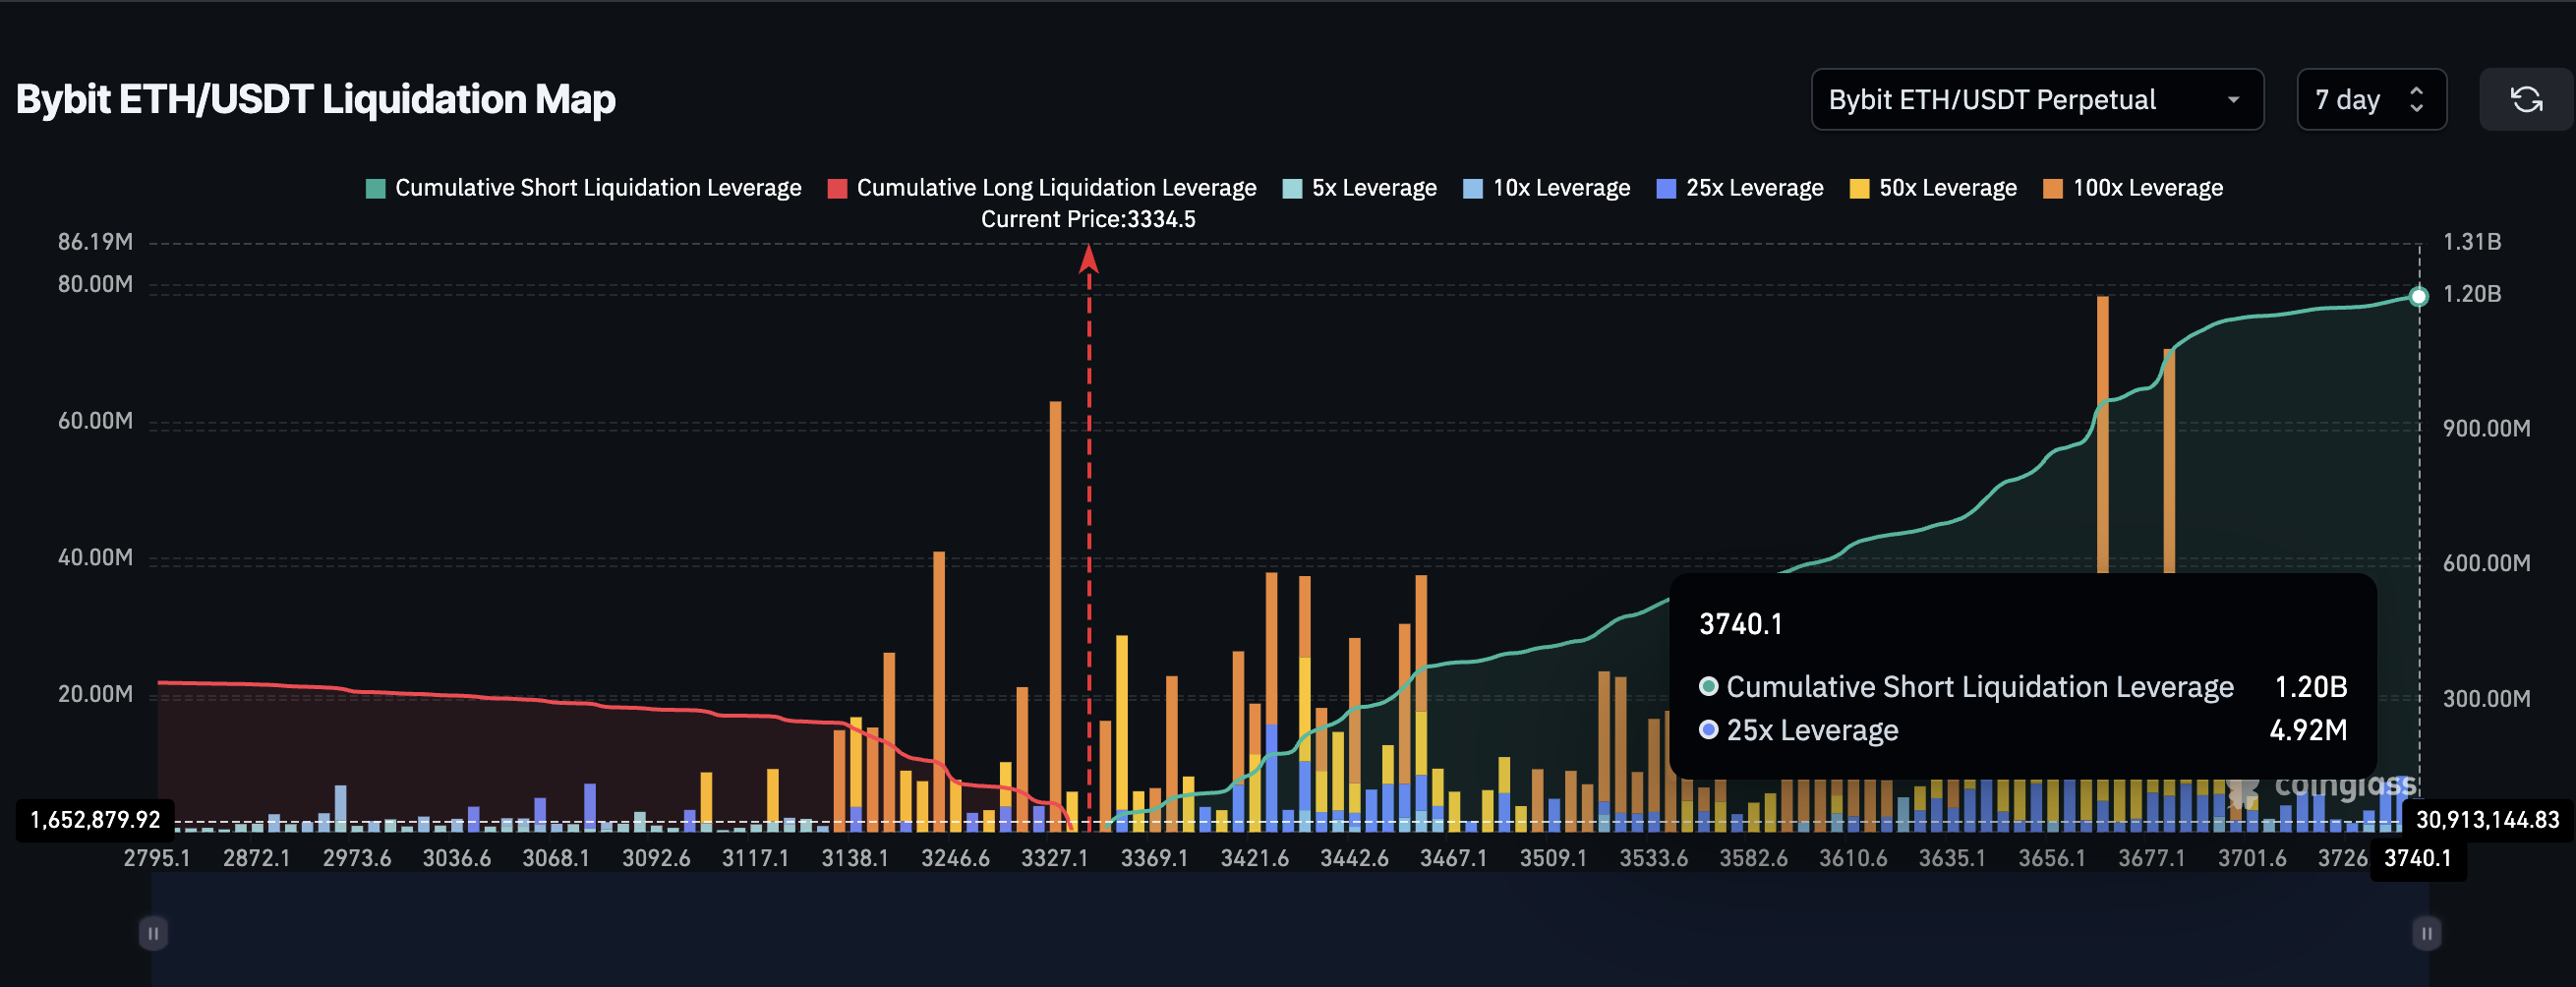
However, a few sizable long positions near $3,100 could still disappear if Ethereum dips again. That is one risk element traders must closely monitor.
Technically, Ethereum continues to move inside a falling channel, confirming that the broader trend is still bearish. But the critical support zone at $3,053 has held so far.
If Ethereum can close above $3,338, it would confirm a rebound setup. From there, the next major resistance is around $3,799.
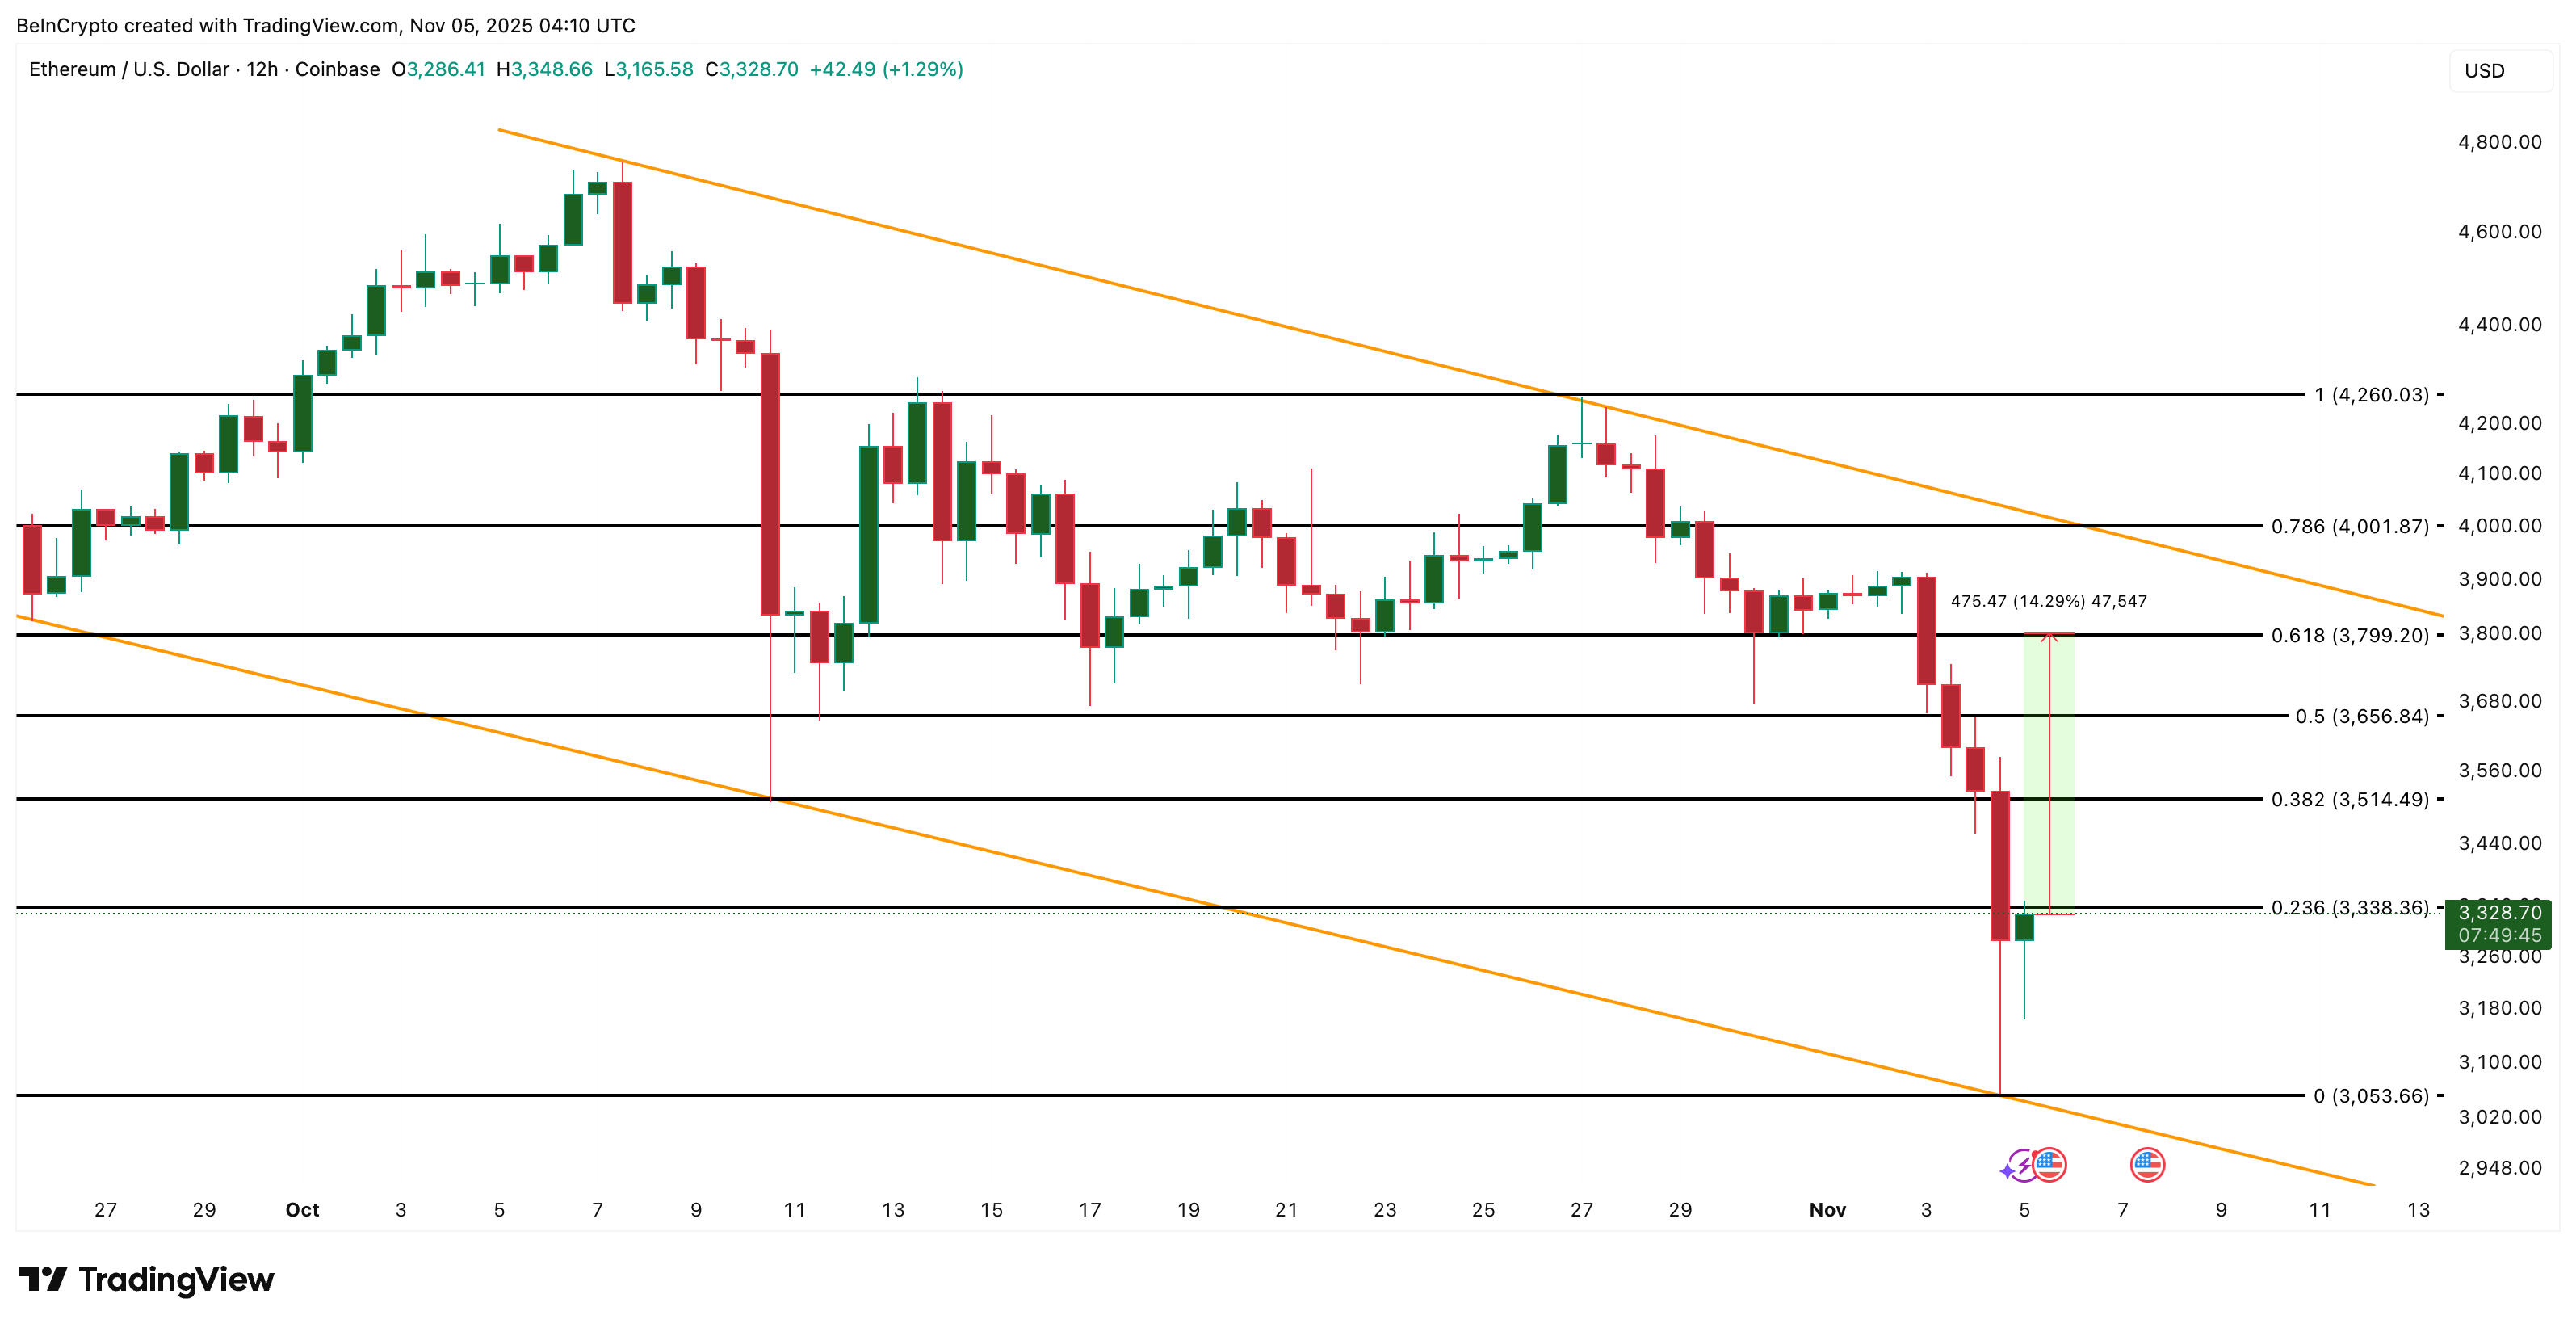
Clearing it with a 14% upmove could ignite a stronger move toward $4,000 and even $$4,260. However, if the 12-hour candle closes below $3,053, the Ethereum price would invalidate the rebound hypothesis.
