
The Ethereum (ETH) price has finally reached a daily close above the $390 resistance level, something it had failed to do since the early Sept drop.
As long as the price is trading above this level, the possibility of upwards continuation is the most likely option.
Reclaim of $390
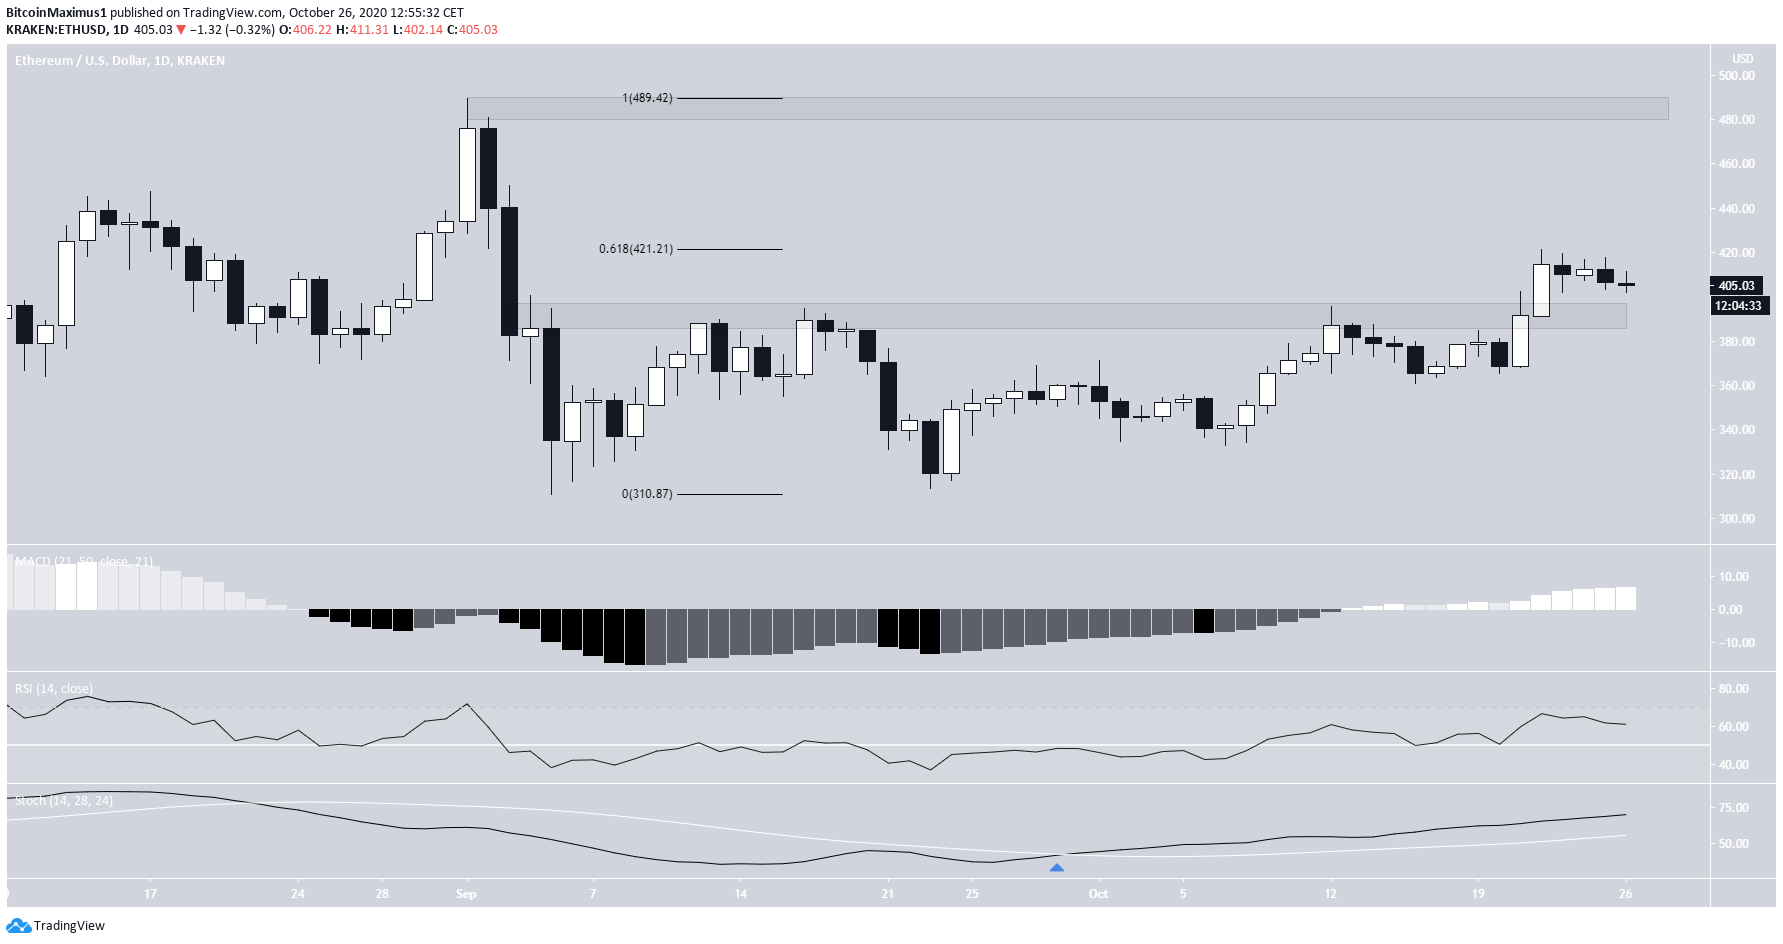
The ETH price has been moving down since the price reached a high of $489.57 on Sept 1. The drop was initially very sharp and the price reached a low of $311.4 on Sept 5. Since then, ETH has been moving up, but has struggled to move above the $390 level.
Resistance rejected a rally above here three times, most recently on Oct 12. However, the price successfully broke out on Oct 21 and is currently in the process of validating the area as support. If successful, it could continue moving upwards towards the next resistance level at $485.
However, it’s worth mentioning that the price has not yet moved above the 0.618 Fib level of the most recent decline, potentially making the current rally corrective. Technical indicators on the daily time-frame are bullish. All three of the: RSI, MACD, and Stochastic Oscillators are increasing.
Cryptocurrency trader @PostyXBT outlined an Ethereum chart that shows the price struggling to break out from the $400 resistance area, stating that a daily close above it would be extremely bullish.
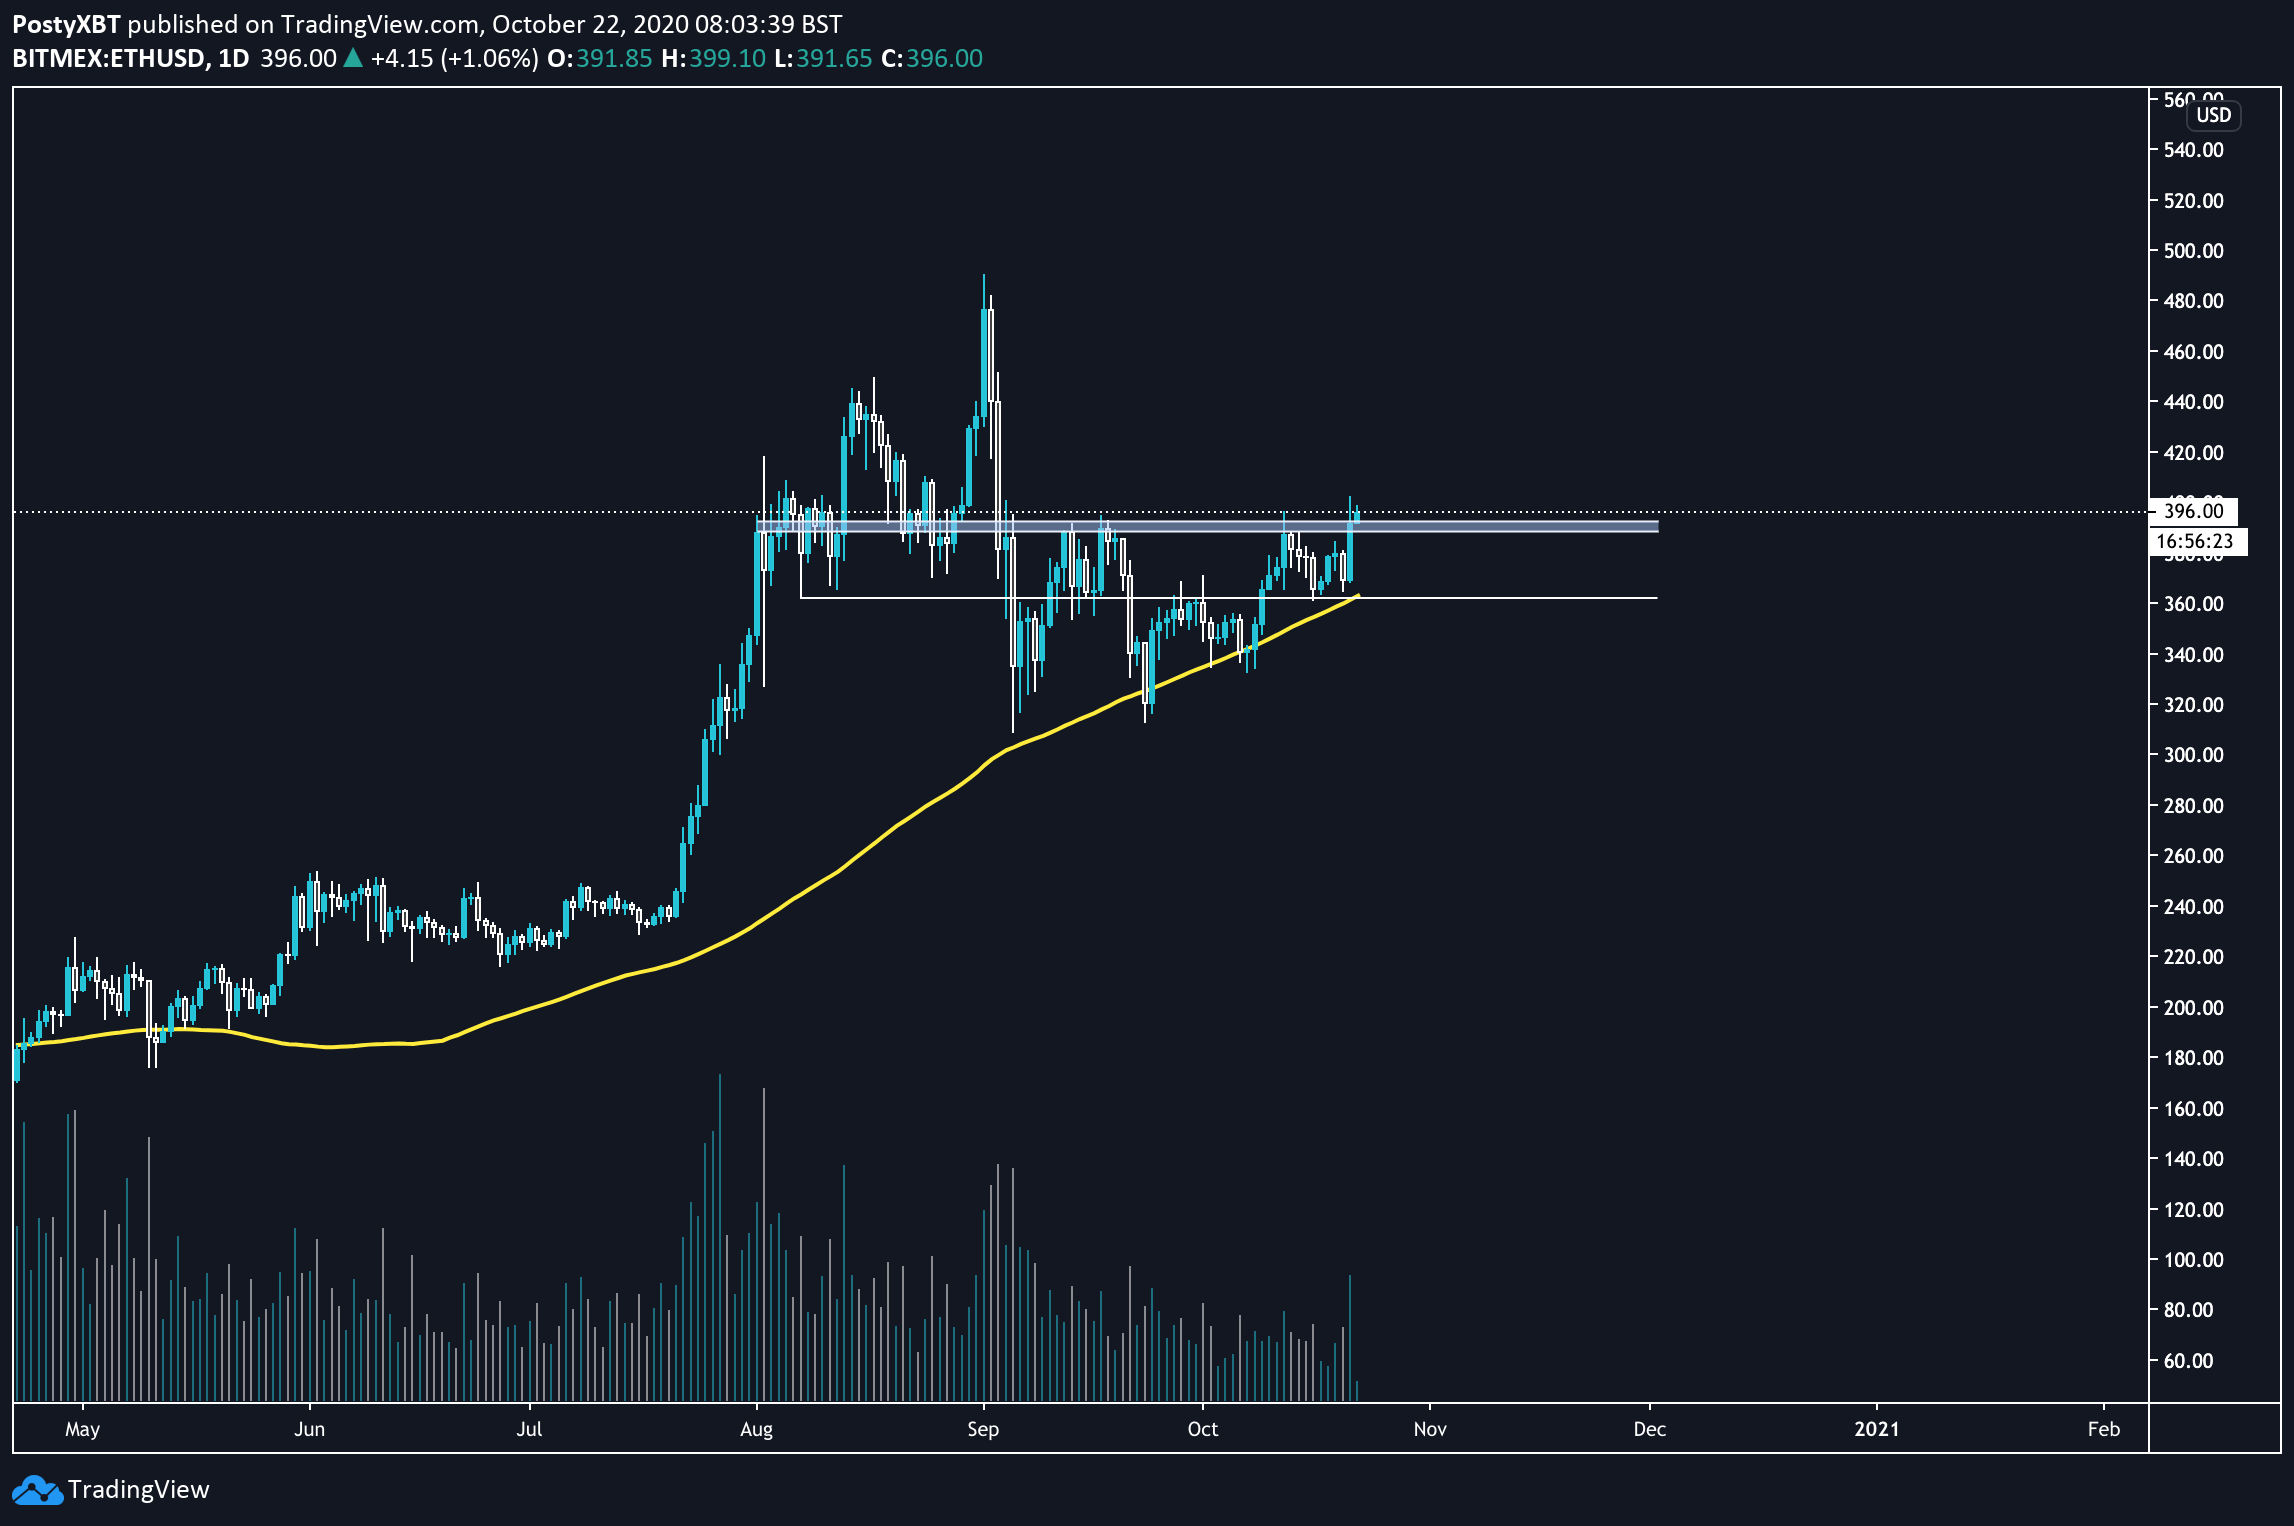
On Oct 12, the price did reach a close above this level, more specifically at $414. This is bullish and could eventually take the price to the previous Sept 1 highs.
Continuation of Upward Move
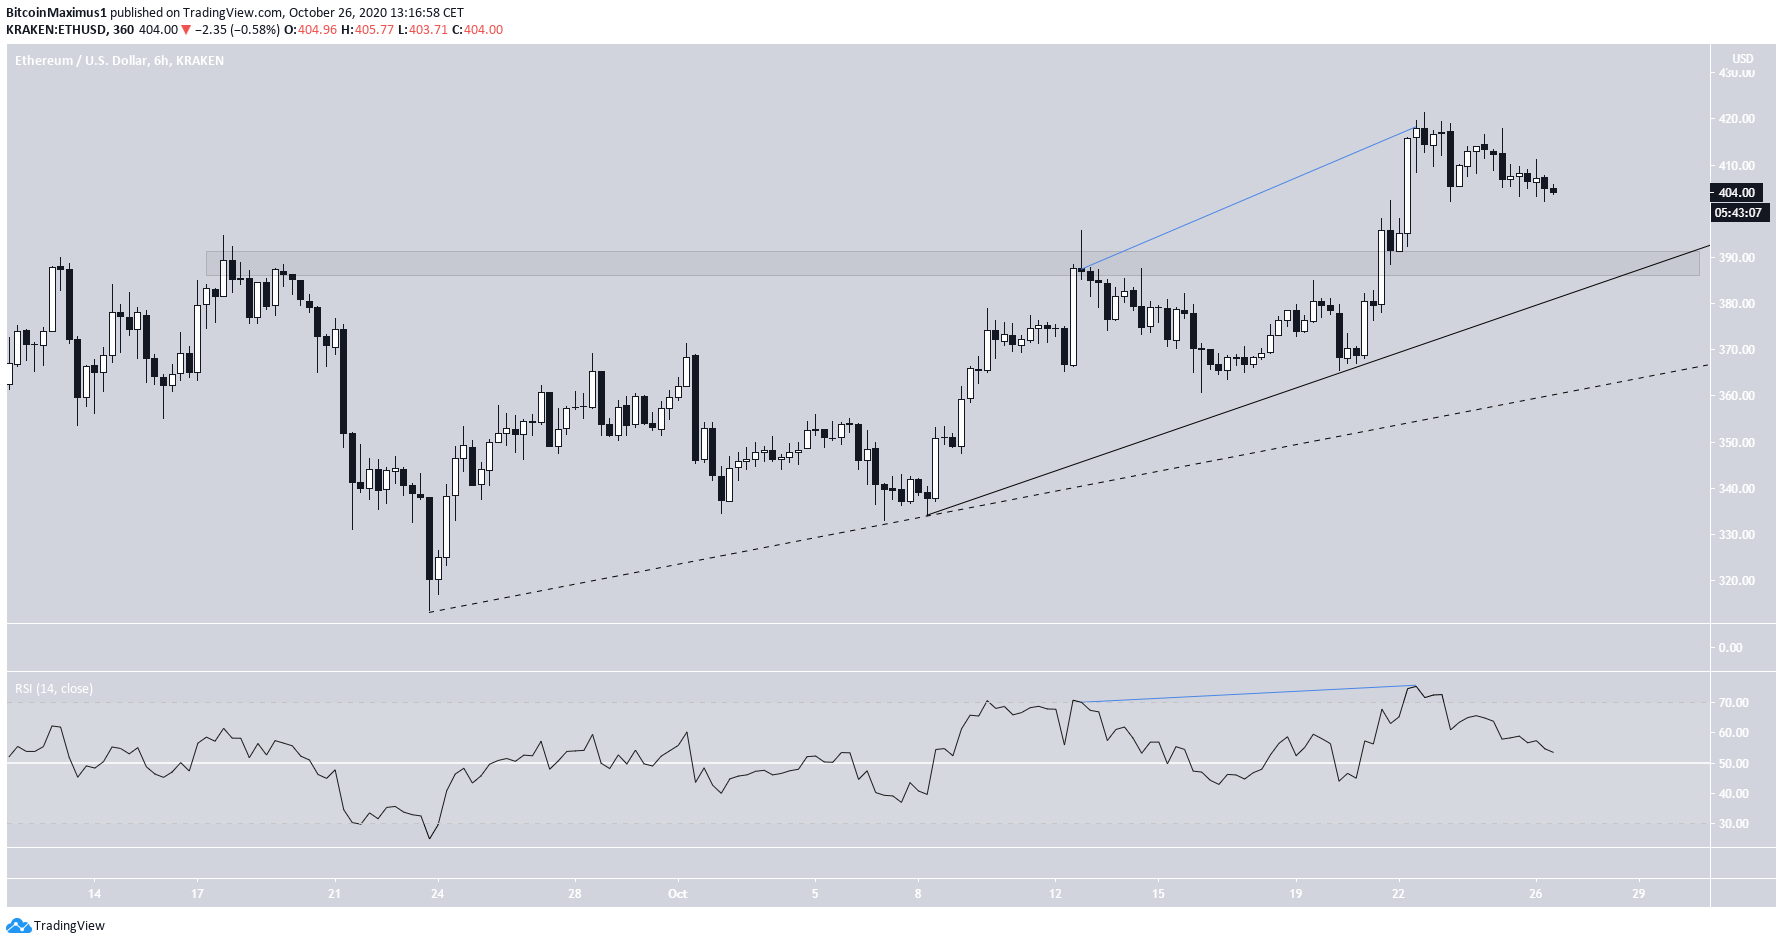
The six-hour chart does not dissuade from the findings of the daily chart. The price has clearly broken out from the $390 resistance area. The breakout also did not create any bearish divergence in the RSI.
Furthermore, the price is potentially following one of two ascending support lines(shown with a solid and dashed line below), neither of which have been validated sufficient times. The latter one (solid) coincides with the $390 area, which should now act as support.
As long as the price is trading above $390, the trend is bullish and upward moves are likely.
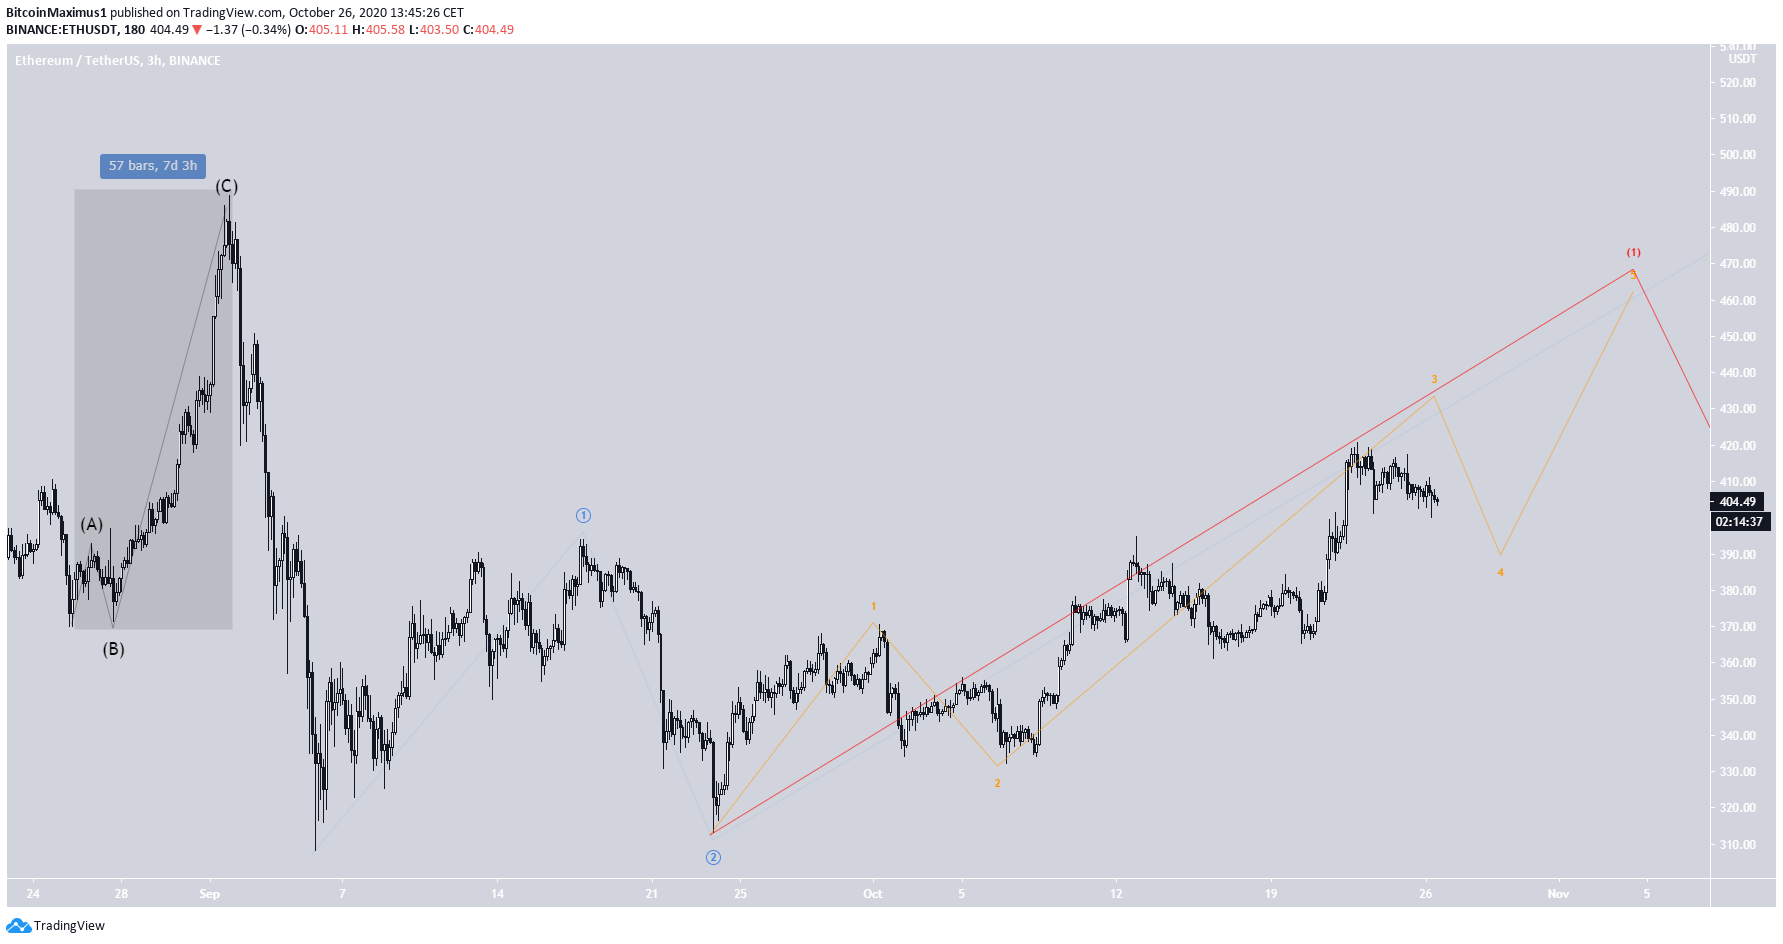
The wave count is not entirely clear. The move that led to the Sept 1 high (highlighted) does not seem impulsive, which would mean that there is one more impulse in the upward direction.
However, the only possible count is a 1-2/1-2 wave formation (blue and red), with the second 1 – 2 being a leading diagonal (orange).
If the count becomes invalidated, then the current rally would be corrective and the price would likely reach new lows. The count would be invalidated with a decline below the sub-wave 1(orange) high at $370.6.
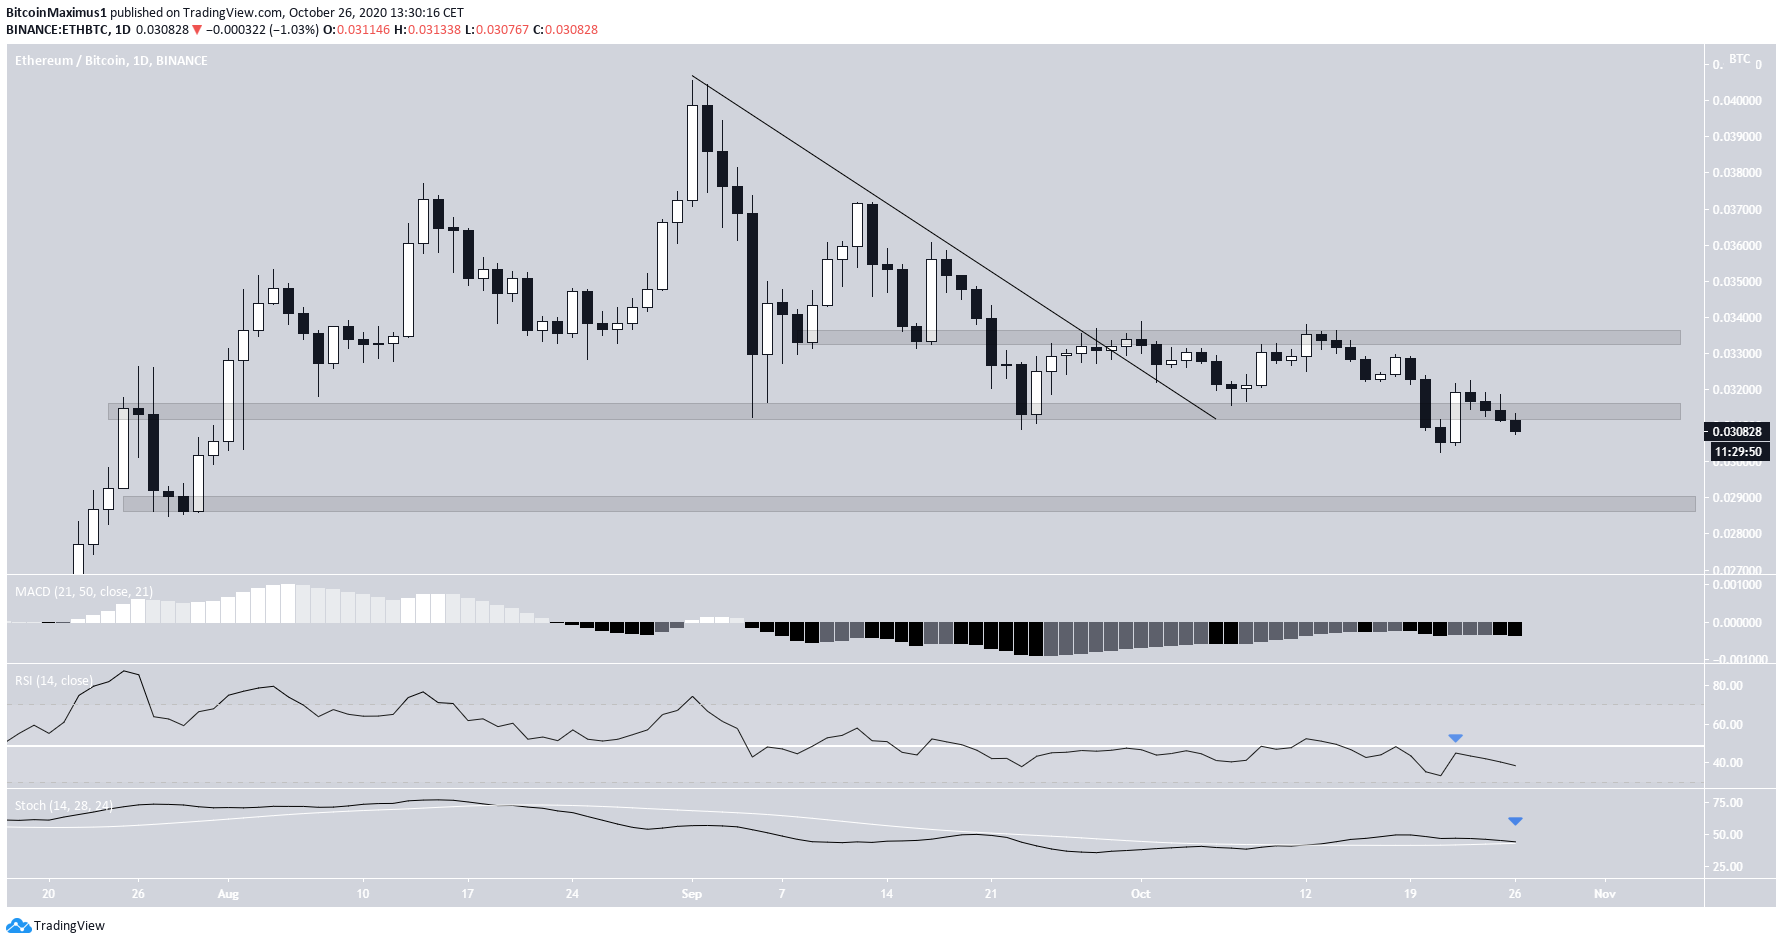
ETH/BTC
The ETH/BTC chart looks more bearish than its ETH/USD counterpart. While ETH initially broke out from a descending resistance line, it could not sustain the higher prices.
The price is trading between support and resistance at ฿0.0287 and ฿0.0314, having just fallen below the latter.
Technical indicators on the daily time-frame are bearish since the RSI is below 50. The MACD is negative and the Stochastic Oscillator is in the process of making a bearish cross.
Therefore, the price should fall towards ฿0.0287.
For BeInCrypto’s previous Bitcoin analysis, click here!
Disclaimer: Cryptocurrency trading carries a high level of risk and may not be suitable for all investors. The views expressed in this article do not reflect those of BeInCrypto.
