
Ethereum’s (ETH) performance relative to Bitcoin (BTC) has seen a sharp decline since July 24, with the ETH/BTC pair now at its lowest point in three years. As market sentiment for ETH turns increasingly bearish, many analysts predict further declines in the coin’s value.
This article breaks down key insights that ETH holders should be aware of as the situation continues to unfold.
Ethereum Overshadowed by Bitcoin as Network Activity Suffers
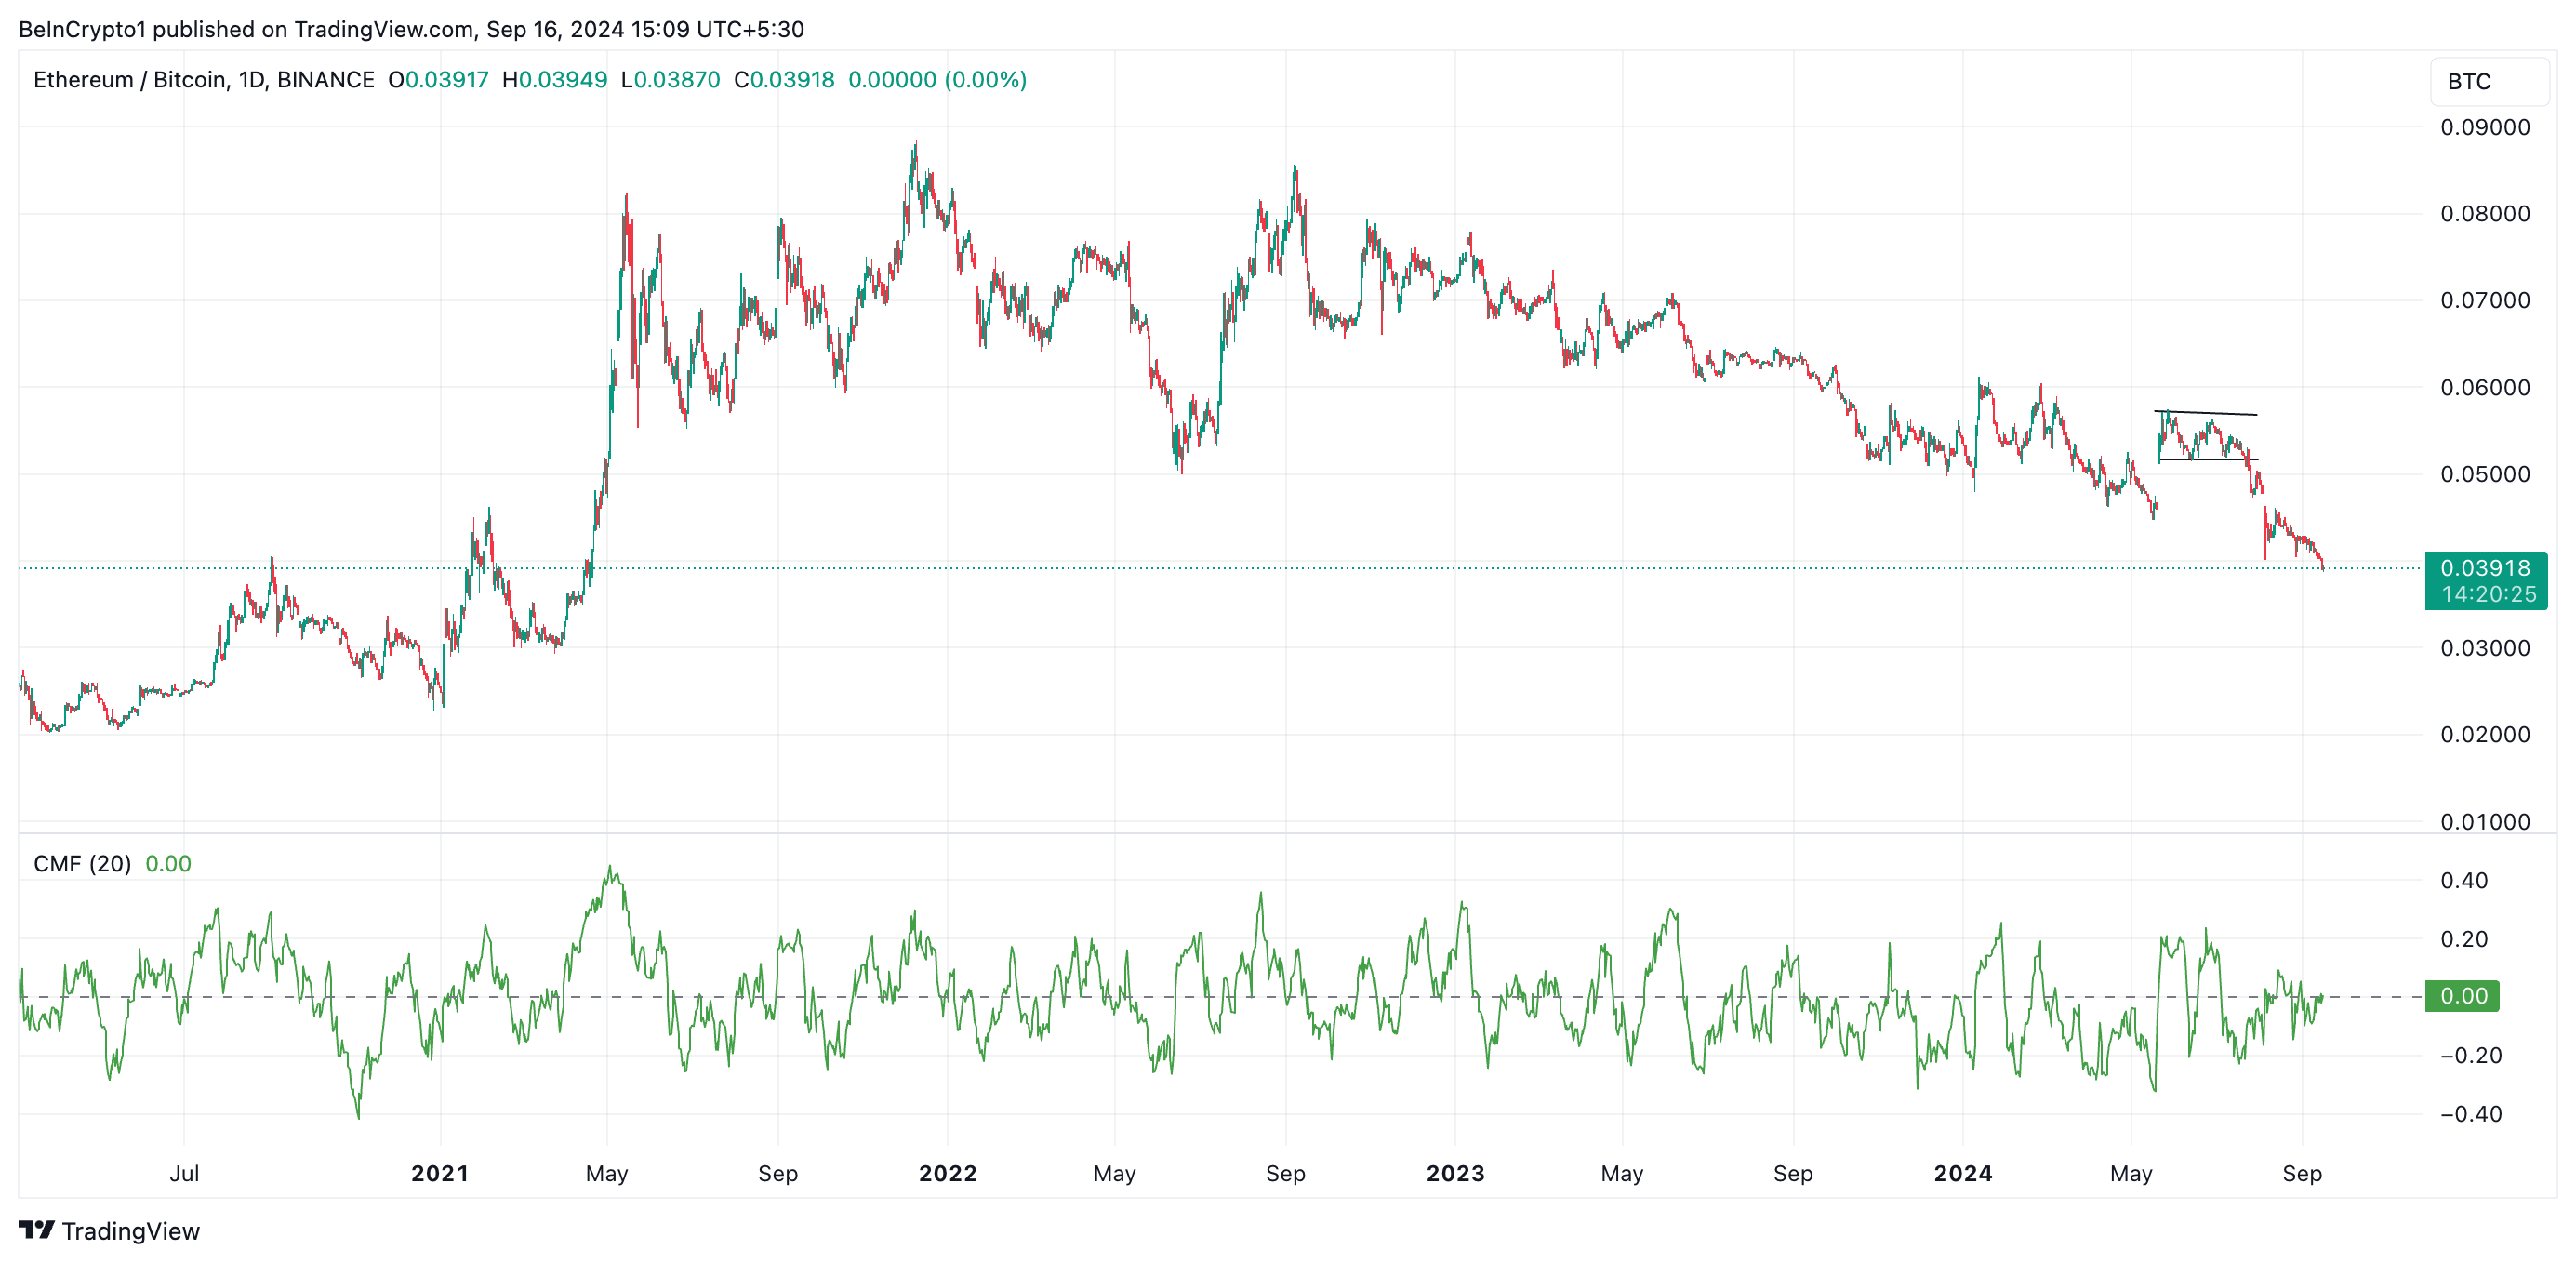
The ETH/BTC pair represents the ratio between the prices of Ethereum (ETH) and Bitcoin (BTC), showing how much BTC is needed to buy one ETH. When this ratio increases, it means ETH is outperforming BTC, either due to ETH rising faster or BTC falling. If the ratio decreases, it indicates BTC is outperforming ETH, either because BTC is rising faster or ETH is underperforming.
Currently, the ETH/BTC ratio stands at 0.039, its lowest level since April 2021. The decline began on July 24 after the pair broke below the horizontal channel it had been trading in between May 21 and July 24.
Interestingly, despite Bitcoin (BTC) struggling to break above $65,000 in recent months, its market dominance (BTC.D) has steadily increased. At 57.95% as of now, it is at its highest level since April 2021.
The simultaneous decline in the ETH/BTC pair and the rise in BTC dominance signal Ethereum’s loss of market share and Bitcoin’s growing strength in the market. Beyond broader bearish macro trends, the reduced activity on the Ethereum network in recent months has likely contributed to this shift.
Lower network usage has led to a decreased burn rate of ETH, increasing its circulating supply and adding pressure on its price.
Read more: 9 Best Places To Stake Ethereum in 2024
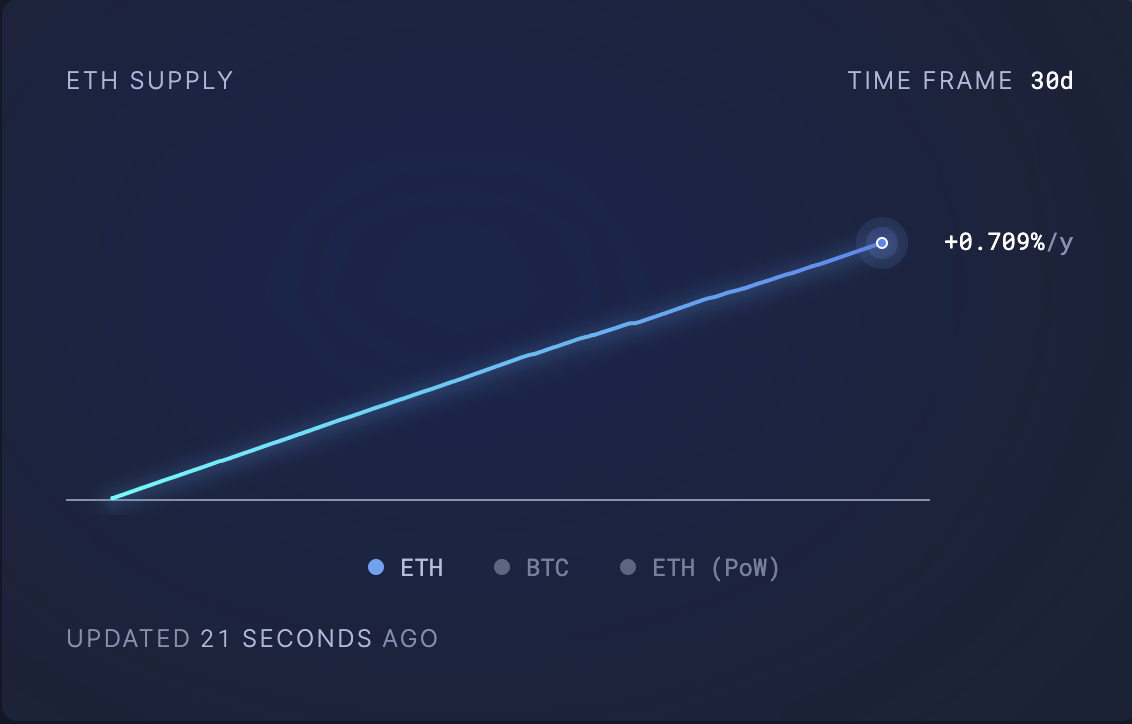
Data from Ultrasoundmoney shows that 70,111 ETH worth over $163 million entered the circulating supply over the past 30 days. As more tokens flood the market, the increase in supply outpaces demand, causing downward pressure on the price.
ETH Price Prediction: Is the Altcoin Ready For a Shocker?
The Federal Reserve is expected to announce a rate cut on September 18, which could lead to market volatility in the coming days. However, Ethereum’s rising Chaikin Money Flow (CMF) suggests an accumulation trend, indicating that its price may rally if demand momentum remains strong.
Currently, ETH’s CMF, which measures the flow of money into and out of its market, sits at 0.12. Despite ETH’s recent price decline, the CMF has been trending upward, creating a bullish divergence. This signals underlying demand for ETH, which could result in a positive price shift in the near term.
If this demand persists, Ethereum’s price could rebound toward the resistance level of $2,579. Breaking through this barrier could pave the way for further gains, potentially pushing the price toward $2,868.
Read more: How to Buy Ethereum (ETH) and Everything You Need to Know
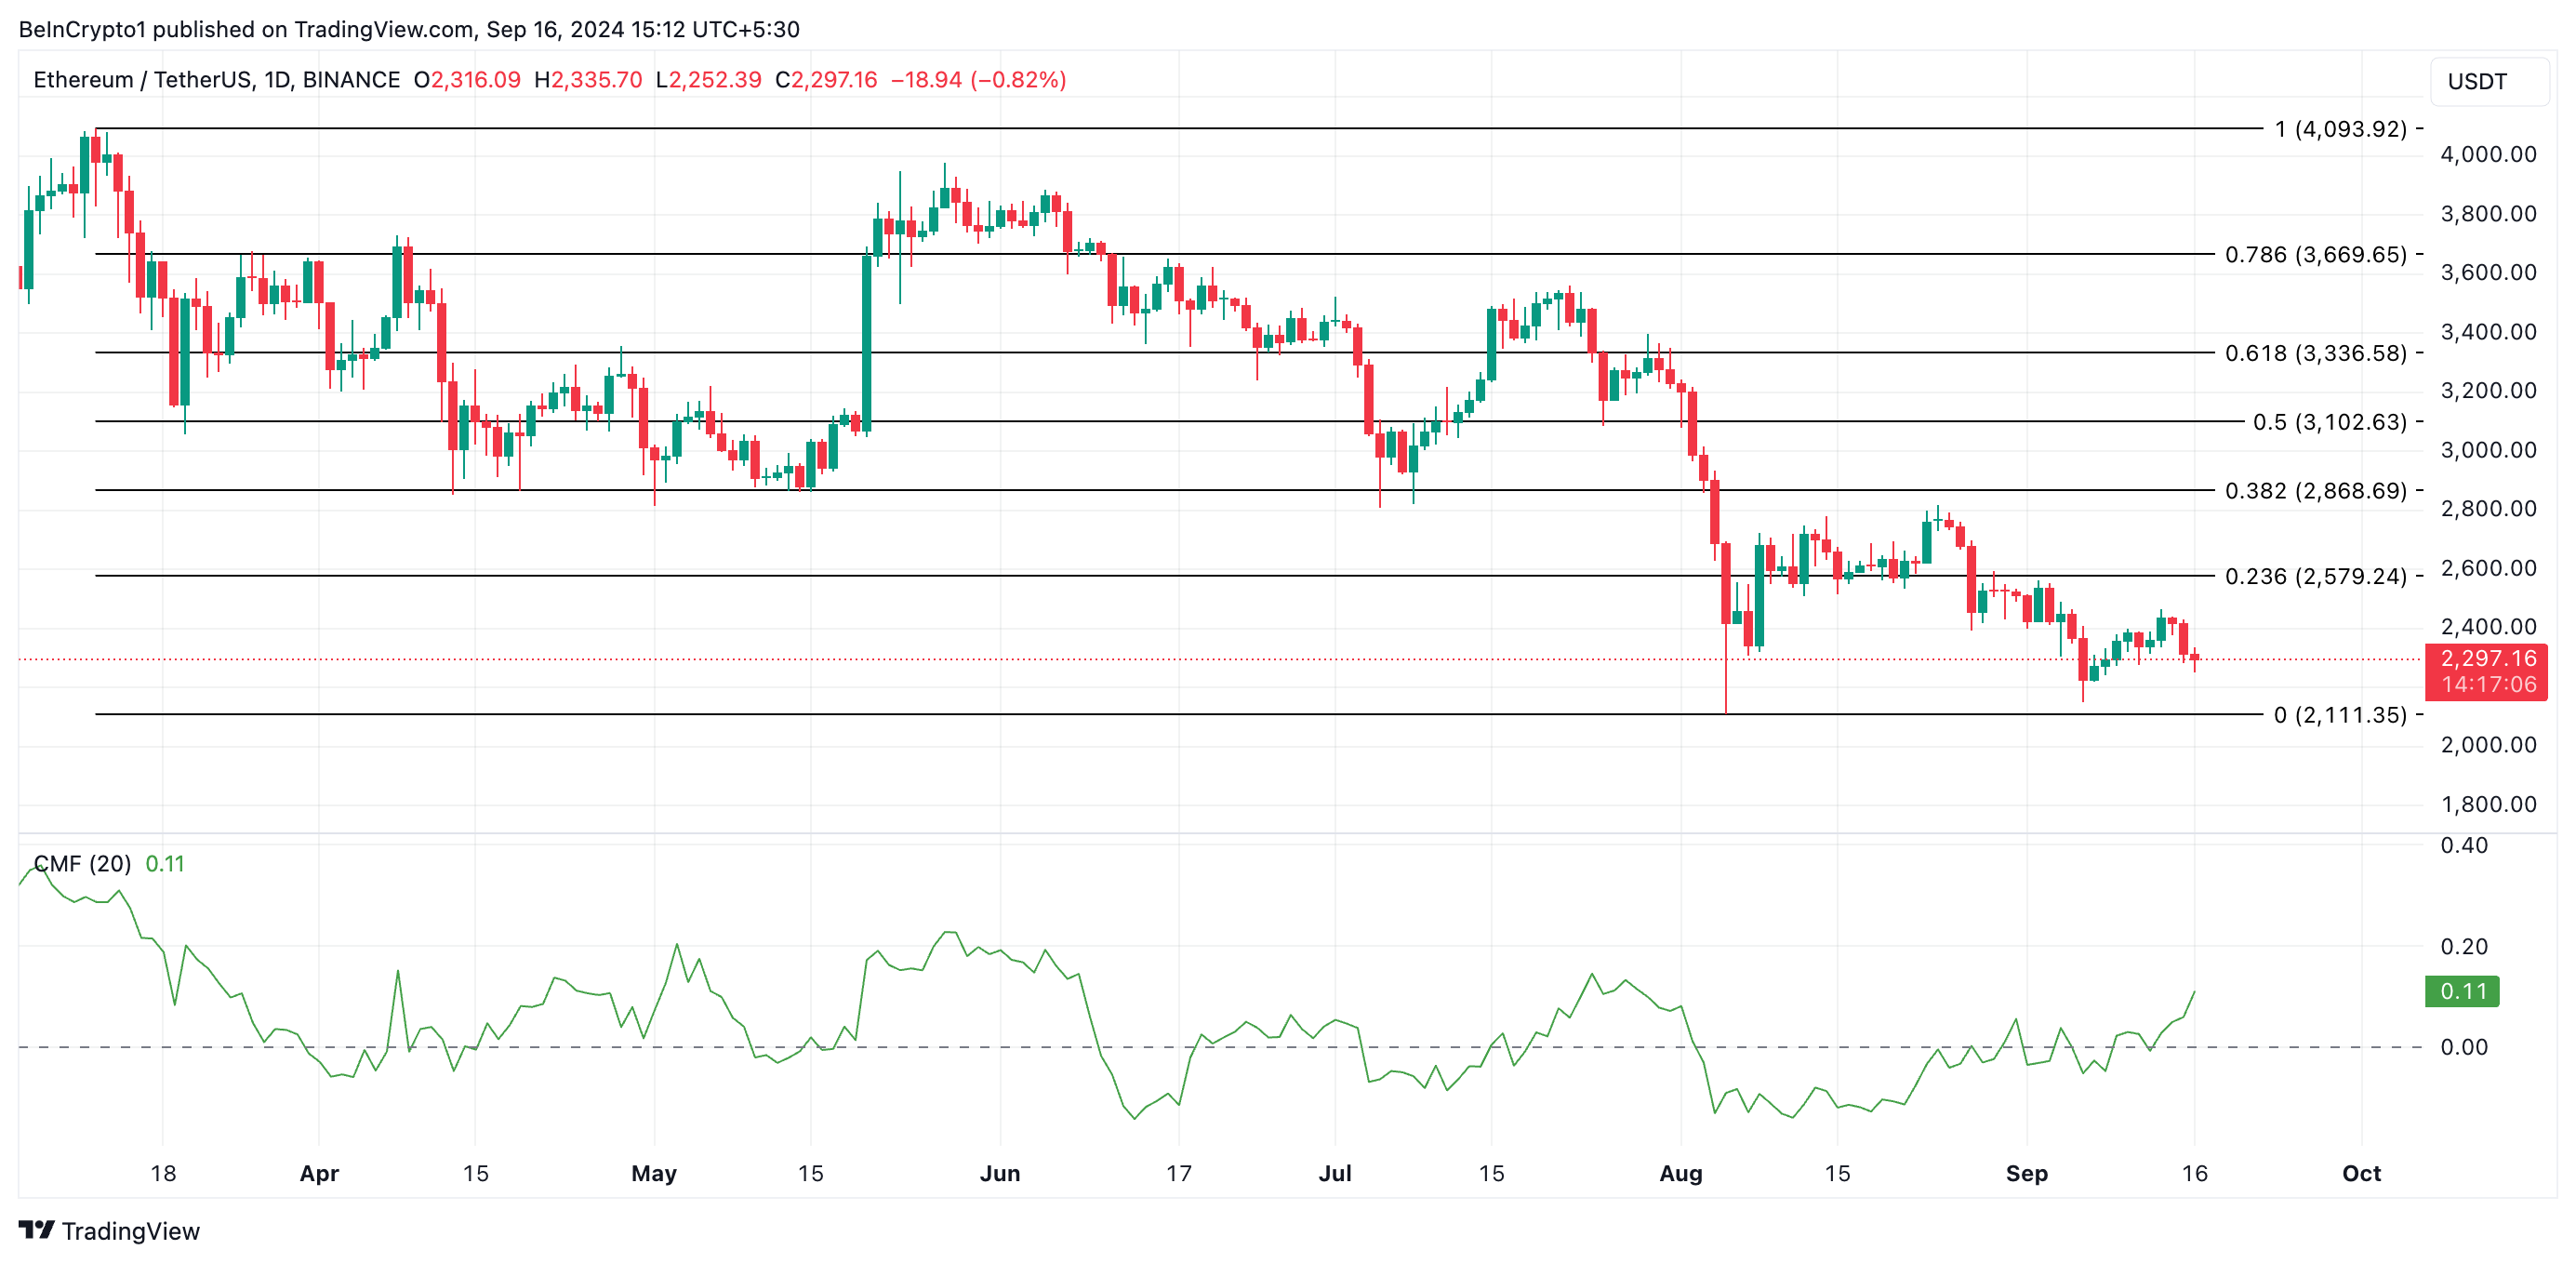
However, this bullish outlook would be invalidated if demand weakens in the coming days, possibly leading to a decline toward the August 5 low of $2,111.
